Abstract
A library of 15 novel and heretofore uncharacterized adamantyl and noradamantyl phthalimidines was synthesized and evaluated for neuroprotective and anti-angiogenic properties. Phthalimidine treatment in LPS-challenged cells effected reductions in levels of secreted TNF-α and nitrite relative to basal amounts. The primary SAR suggests nitration of adamantyl phthalimidines has marginal effect on TNF-α activity but promotes anti-nitrite activity; thioamide congeners retain anti-nitrite activity but are less effective reducing TNF-α. Site-specific nitration and thioamidation provided phthalimidine 24, effecting an 88.5% drop in nitrite concurrent with only a 4% drop in TNF-α. Notable anti-angiogenesis activity was observed for 20, 21 and 22.
Graphical abstract
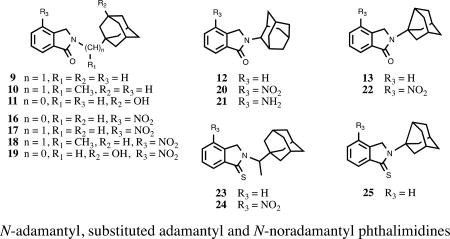
N-adamantyl, substituted adamantyl and N-noradamantyl phthalimidines
1. Introduction
Neurons are highly specialized cells that comprise the central nervous system and interact through a series of complex chemical and voltage-dependent signaling motifs. Like all cells, neurons maintain homeostasis through carefully regulated processes that identify and subsequently respond to physiological strains including high biosynthetic or secretory demands, changes in oxidative/nitrosative1 redox balance, inflammation and aging. In this regard, healthy neurons are typically able to endure episodes of short, intense trauma in addition to periods of lingering, mild stress. However, in the case of vulnerable neurons, the magnitude of such circumstances can promote synapse loss, pruning, cellular dysfunction and even death.2 Depending on the neuronal population or brain region involved, these actions may lead to neurodegenerative disorders such as Alzheimer’s disease (AD), Huntington’s disease (HD), Parkinson’s disease (PD) and multiple sclerosis (MS).3
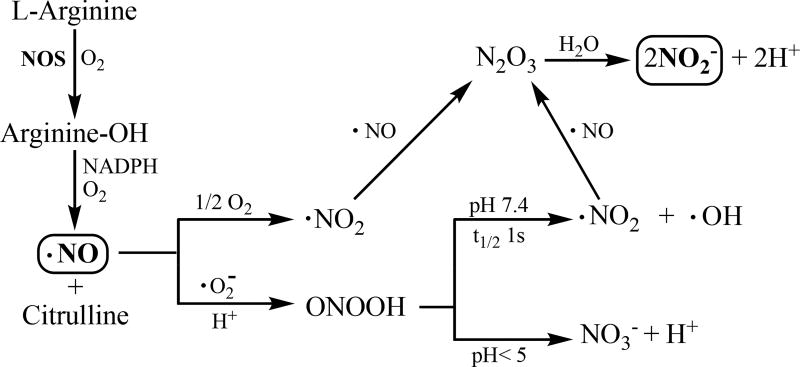
Specific families of proteins, small molecules and biochemical signal-transduction pathways orchestrate these events. For instance, the pro-inflammatory release of tumor necrosis factor-alpha (TNF-α) by microglia can initiate damaging, self-propagating cycles of inflammation if not appropriately regulated in a time-dependent manner.4 TNF-α levels are found consistently elevated by as much as 25-fold in the cerebrospinal fluid (CSF) of AD patients.5 In addition, subjects with mild cognitive impairment that progress to develop AD suggest that increased CSF TNF-α levels are an early event, and their rise correlates with disease progression.6 In a similar fashion, an upsurge of nitric oxide (•NO, Figure 1)7 produced by neuronal nitric oxide synthase (nNOS) or inducible nitric oxide synthase (iNOS) in response to traumatic insult and chronic inflammation is perhaps one of the key midstream elements in the evolution of AD, MS and PD.8 For instance, amyloid-β 1–40 peptide (Aβ1–40) challenge was sufficient to induce a 50-fold profusion of NOS-derived nitric oxide in microglial cells as compared to basal amounts, while simultaneous administration of Aβ1–40 and pro-inflammatory interferon-γ effected an even greater 100-fold release.9 Overproduction of NO has also been associated with increased angiogenesis in tumor lines, leading to expanded vascularization and the progression of certain types of cancer. The mass, degree of vascularization and growth rate of tumors induced by iNOS-clone cell treatment in a population of CD1 nu/nu mice was directly related to NOS-produced NO; combined nitrite/nitrate levels observed in iNOS clones were roughly 70-fold higher at one week relative to wild-type cells, while the resulting tumors in the treated mice were three times heavier at one month and possessed 5-fold more vasculature.10
Figure 1.
Nitric oxide synthase (NOS) catalyzed production of NO and subsequent conversion of ROS (reactive oxygen species) and RNS (reactive nitrogen species) to nitrite in vivo.
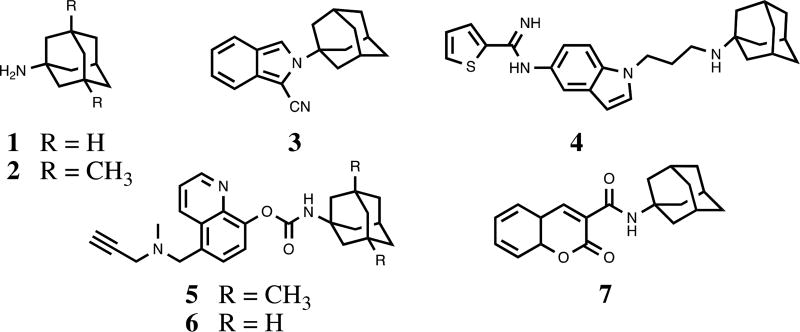
Our recent interests on thalidomide analogs effecting anti-inflammatory responses11 led us to investigate new congeners for desirable neuroprotective properties. To our surprise, a detailed chemical and biological evaluation of substituted N-adamantyl phthalimidines was lacking in the literature. It has been shown that strategic incorporation of adamantyl groups can impart numerous benefits to neuroprotective and anti-inflammatory agents (Figure 2).12 The unique hydrophobic structure bestows increased lipophilicity, facilitating traverse across biological membranes such as the blood-brain barrier. In addition, the large rigid, cage-like skeleton often prevents excessive catabolism and can strengthen desirable interactions with CNS targets. For instance, amantadine 1 and memantine 2 have shown promise for the treatment of AD and PD, functioning as N-methyl-D-aspartate receptor antagonists and also by reducing microglia-associated inflammation.13 The specific size and hydrophobicity imparted by the adamantyl groups are among the key factors in determining the affinity and activity of these ligands. Given the scope of inflammation-associated neurodegenerative disorders coupled with their complicated and potentially intertwined mechanisms of incipience, we set out to develop a series of new chemical entities featuring the substituted N-adamantyl motif and possessing desirable neuroprotective properties. Herein we report the design, synthesis and evaluation of 15 novel and heretofore uncharacterized substituted adamantyl and noradamantyl phthalimidines with nitrite, TNF-α and angiogenesis inhibitory activities.
Figure 2.
Neuroprotective agents containing the adamantyl moiety
2. Results and Discussion
2.1 Synthetic chemistry
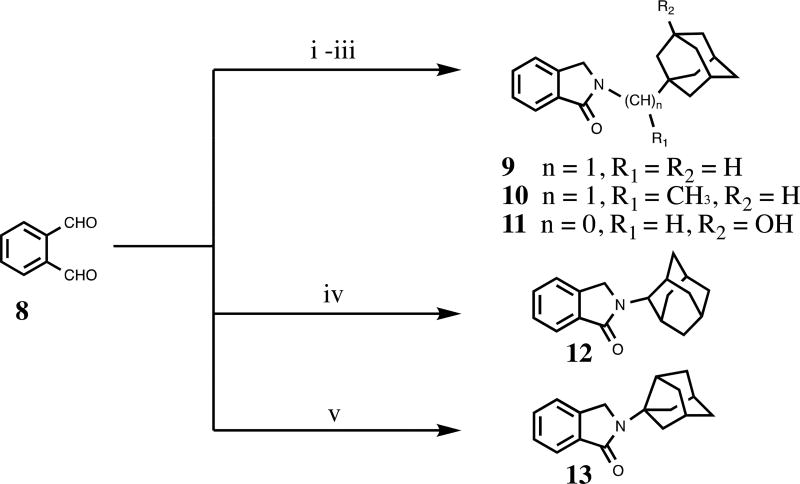
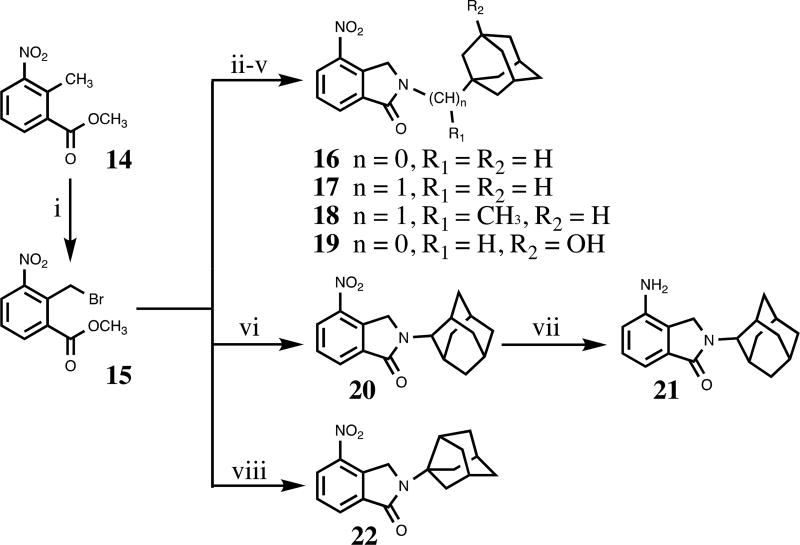
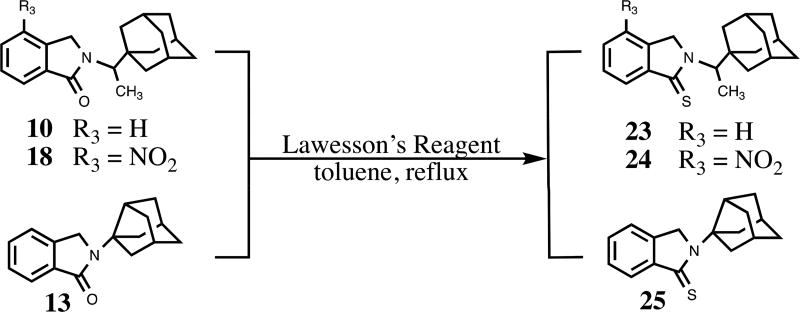
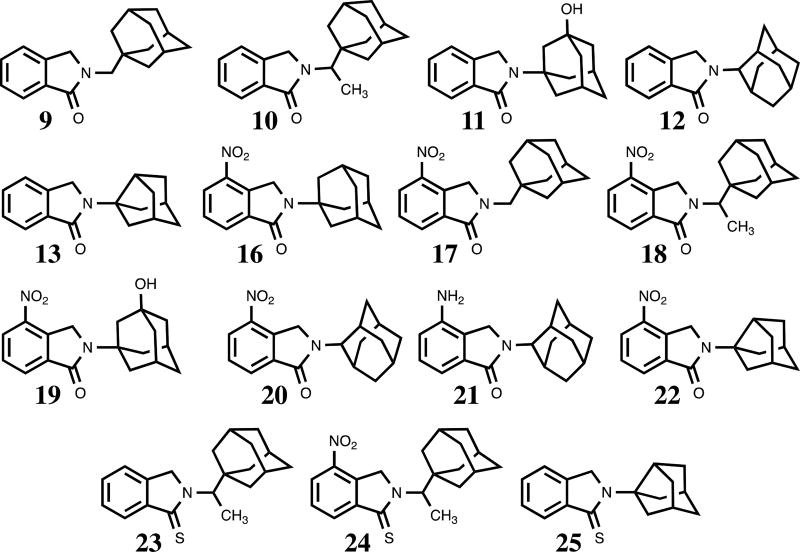
We constructed our phthalimidines with two key pharmacophores in mind. Initially intrigued by thalidomide analogs with known anti-inflammatory activities,14 we envisioned each of our new molecules would feature an aromatic isoindolinone framework. Upon these scaffolds, we would install appropriate adamantyl or noradamantyl moieties, ultimately yielding our family of N-substituted phthalimidines. For compounds 9–13, we utilized a simple one-pot approach. Phthaldialdehyde 8 was combined with various adamantyl or noradamantyl amines to produce the desired products in acceptable yields (Scheme 1). The proposed mechanism of formation is not clear, but is believed to involve a tandem iminium rearrangement and elimination or, alternatively, a [1–5]-H sigmatropic shift.15 Aryl-substituted phthalimidines 16–22 were prepared using a stepwise process (Scheme 2). Initially, methyl 2-methyl-3-nitrobenzoate 14 was subjected to benzylic radical bromination to generate intermediate 15.16 Subsequent condensation with the appropriate amines provided the desired nitrated products in satisfactory yields. Catalytic hydrogenation of 20 provided aniline 21. Thioamides 23–25 were obtained from the corresponding parent isoindolinones by treatment with Lawesson’s reagent (Scheme 3). A summary of novel phthalimidines is presented in Figure 3.
Scheme 1.
Reagents and conditions: (i) 1-adamantanemethylamine (for 9), THF; (ii) 1-(1-adamantyl)ethylamine hydrochloride (for 10), K2CO3, THF; (iii) 3-amino-1-adamantanol (for 11), THF; (iv) 2-adamantylamine hydrochloride (for 12), K2CO3 THF; (v) 3-noradamantanamine hydrochloride (for 13), K2CO3, THF.
Scheme 2.
Reagents and conditions: (i) NBS, benzoyl peroxide (for 15), CCl4, reflux; (ii) 1-adamantylamine (for 16), K2CO3, DMA, rt to 50 °C; (iii) 1-adamantanemethylamine (for 17), K2CO3, DMA, rt to 50 °C; (iv) 1-(1-adamantyl)ethylamine hydrochloride (for 18), K2CO3, DMA, rt to 55 °C; (v) 3-amino-1-adamantanol (for 19), K2CO3, DMA, rt to 58 °C; (vi) 2-adamantylamine hydrochloride (for 20), K2CO3, DMA, rt to 58 °C; (vii) H2, Pd-C(10%), MeOH, rt; (viii) 3-noradamantanamine hydrochloride (for 22), K2CO3, DMA, rt to 50 °C.
Scheme 3.
Synthesis of adamantyl phthalimidine thioamide congeners.
Figure 3.
Structures of novel adamantyl and noradamantyl phthalimidines
2.2 NO2− and TNF-α inhibitory activities
Once we had our phthalimidine library in hand, we set out to evaluate our molecules for anti-TNF-α and nitrite activities. Fortunately, the RAW 264.7 cellular model of inflammation identifying NO2− and TNF-α inhibitors had been reported and was well established.17 Inhibitory activities of LPS-induced NO2− and TNF-α production in RAW 264.7 cells along with cell viability and computed lipophilicity (Clog D value) are shown in Table 1.18 The data afforded some notable observations upon first inspection. We were pleased that our compounds were not appreciably cytotoxic, with most retaining >80% cell viability at 30µM treatment. It also appeared that polar compounds did not fare particularly well in either assay; even the leading –NH2 and -OH substituted inhibitors reduced nitrite by only 28% (amino compound 21) and TNF-α by 20% (hydroxy compound 11). While a few compounds effected moderate reductions of both analytes, TNF-α inhibition was clearly less prominent overall. Foremost TNF-α inhibitor 13 reduced levels to only 52% of the control (vehicle treatment) value, whereas five phthalimidines diminished nitrite levels below 50%. We also noted that compounds with a Clog D value below 3.0 performed poorly in the nitrite assay, generally failing to curtail levels below 70%. Compound 22 was the sole exception, reducing nitrite to 49% concurrent with a Clog D of 2.79. Conversely, of the ten phthalimidines with Clog D values greater than 3.0, eight reduced nitrite amounts below 60%, and four of these further diminished levels well into the sub-50% range.
Table 1.
Adamantyl-substituted phthalimidine inhibition of LPS-induced nitrite and TNF-α production in RAW 264.7 cells.
| #a | Nitrite | TNF-α activityd | Cell Viability | Clog D | |||
|---|---|---|---|---|---|---|---|
| %Δb | P | %Δb | P | %Δb | P | ||
| 9 | 50±3 | 0.0079 | 59±8 | 0.0093 | 81±15 | 0.2225 | 3.72 |
| 10 | 52±4 | 0.0092 | 55±4 | 0.0026 | 82±3 | 0.0071 | 4.25 |
| 11 | 101±3.5 | 0.8674 | 80±2.3 | 0.0098 | 98±4.0 | 0.7527 | 1.87 |
| 12 | 62±10.6 | 0.0319 | 58±3.8 | 0.0029 | 75±4.2 | 0.0064 | 3.51 |
| 13 | N/Ae | N/A | 52±3 | 0.0007 | 74±1 | <0.0001 | 2.88 |
| 16c | 40±4 | 0.0003 | 86±4 | 0.0467 | 114±9 | 0.2024 | 3.29 |
| 17 | 55±0.6 | 0.0015 | 77±2.0 | 0.4152 | 92±0.8 | 0.0149 | 3.63 |
| 18 | 35±3.9 | 0.0002 | 72±8.3 | 0.0857 | 81±3.8 | 0.0105 | 4.16 |
| 19 | 94±1.2 | 0.5117 | 91±2.3 | 0.0953 | 107±3.9 | 0.1557 | 1.78 |
| 20 | 92±1.3 | <0.0001 | 65±2.1 | 0.0004 | 82±3.3 | 0.0074 | 3.42 |
| 21 | 72±3.4 | 0.0018 | 101±9.2 | 0.8952 | 99±2.8 | 0.9435 | 2.49 |
| 22 | 49±1.1 | 0.0068 | 90±1.3 | 0.1080 | 92±2.2 | 0.0734 | 2.79 |
| 23c | 52±4 | 0.0092 | 90±6 | 0.1662 | 84±2 | 0.0820 | 4.67 |
| 24 | 115±0.3 | 0.0083 | 96±1.2 | 0.3553 | 83±1.9 | 0.0013 | 4.58 |
| 25c | N/Ae | N/A | 85±4 | 0.0301 | 94±5 | 0.4769 | 3.30 |
Values presented in the table are mean ± S.E.M. of n=3 measurements. A Student’s t test was used to asses for statistically significant changes; P<0.05 was considered significant. Clog D are calculated log D values determined at pH 7.0 (CompuDrug, Pallas).
compounds screened at 30µM for nitrite, TNF-α, and viability assays
percentage of vehicle control value; vehicle control = 100% analyte
compounds were not completely soluble at 30µM; 16, 23 and 25 were partially precipitated upon addition to the cell culture media
For comparison, the known TNF-α inhibitor Lenalidomide effects TNF activity of 109% ± 10 with P = 0.4482 (see reference 18 for further detail)
Data was not available as the levels in the control media (i.e. DMSO + LPS) were lower than the lowest level on the nitrite values on the standard curve.
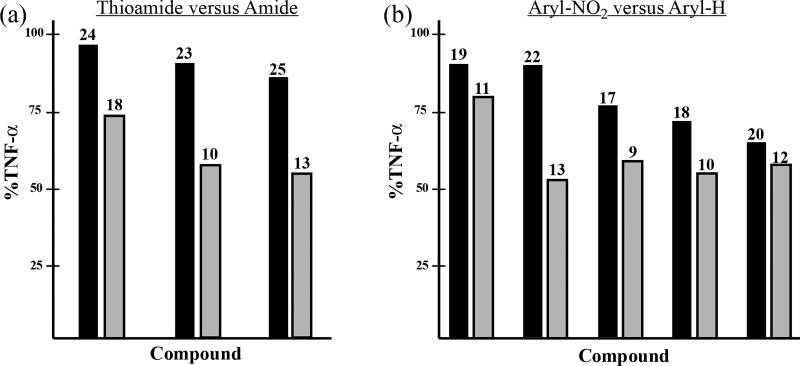
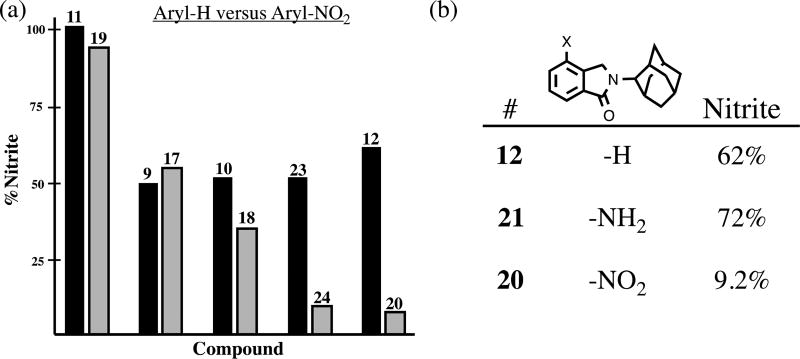
When the data was examined more prudently, we became aware of some specific trends in the primary structure-activity relationship. Analysis of a series of phthalimidine and thioamide counterparts revealed the parent amides as superior inhibitors of TNF-α production. On average, TNF-α levels were decreased to 72%, 55% and 52% with amide congeners 18, 10, and 13, respectively (Figure 4, plot a). We did not observe any prominent link between thioamidation and nitrite activity. When we investigated the influence of aromatic nitration on TNF-α and nitrite activity, we noticed an interesting phenomenon. It was clear that unsubstituted hydro analogs were more effective regulators of TNF-α than their corresponding nitro derivatives. (Figure 4, plot b). For instance, in the case of the 22/13 grouping, nitrated 22 permitted 90% TNF-α secretion while hydro compound 13 effected 52% activity. However, when similar phthalimidine pairings were analyzed in the nitrite assay, we discovered an opposing trend. Nitration was clearly beneficial to anti-nitrite activity (Figure 5a). The effects were quite dramatic in 23/24 and 12/20 where nitrite levels were reduced, on average, from 52% to 11.5% and from 62% to 9.2%, respectively. It should be noted that in regards to 2-adamantyl substrates 12, 20, and 21, the results appear specifically attributable to the nitro group, not manifest by simple or arbitrary substitution at the isoindolinone 4-position (Figure 5b.)
Figure 4.
Effects of thioamidiation and aromatic nitration in strucurally related adamantyl phthalimidines on levels of secreted TNF-α. The compounds listed in each bar pair differ only at the site of indicated subsitution. Data extrapolated from Table 1 and presented graphically as the mean % change of TNF-α activity relative to the control. (a) Comparison of thioamide (C=S) and amide (C=O) congeners on levels of secreted TNF-α. Thioamides are shown as the left bar of each pair; their corresponding amides appear on the right. (b) Comparison of 4-nitro (-NO2) and 4-hydro (-H) substituted congeners on levels of secreted TNF-α. Phthalimidines with 4-nitro-substituted isoindolinone cores are depicted as the left bar of each pair; their corresponding unsubstituted 4-hydro version appears on the right.
Figure 5.
Effects of aromatic nitration on nitrite production. Data extrapolated from Table 1 and presented as the mean % change of nitrite activity relative to the control, (a) The compounds listed in each pairing differ only by the presence/absence of a nitro group in the isoindolinone 4-position. Hydro versions appear on the left, while nitro analogs appear on the right, (b) Comparison of 4-position substituent effects.
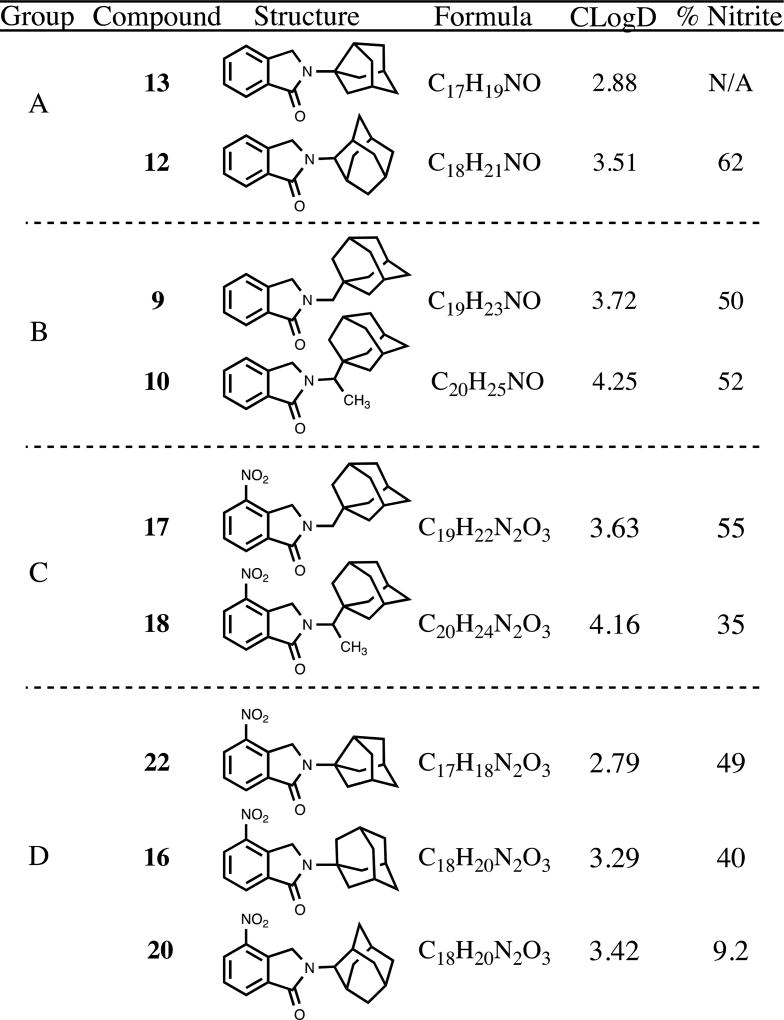
We also noticed that within groups of structurally related phthalimidines, increasing N-substituent bulk typically resulted in evolution or enhancement of anti-nitrite activity. Taking the form of methyl additions or noradamantyl ring expansions, these steric progressions are clearly reflected in the associated Clog D values (Figure 6). For example, in the case of the simple phthalimidines from Group A, noradamantyl 13 possessed a Clog D of 2.88 and effected no detectable change in nitrite while the larger adamantyl 12 registered a modest 62% reading along with a Clog D of 3.51. In the case of groups B and C, it was clear that methylation was well tolerated. While, admittedly, the performance of 9 was not improved significantly upon methylation to 10, it is important to stress that the activity was not compromised. It was quite apparent, however, that methylation enhanced the anti-nitrite activity of 17. While average nitrite was reduced to 55% of control amounts with des-methyl 17, production was curtailed to 35% with corresponding methylated analog 18. Finally, the pattern seen in nitro-substituted compounds from Group D was particularly noteworthy, with ring expansion from noradamantyl 22 to adamantyl entries 16 and 20 having the marked effect of increasing steric bulk and Clog D concurrent with decreasing average nitrite levels from 49% to 40% and 9.2%. Fortunately, these findings parallel and expand upon our earlier premise relating heightened Clog D and general nitrite inhibition.
Figure 6.
Effects of relative N-substituent bulk in strucurally related phthalimidines on levels of secreted nitrite. The progression of structures in each group reflects the net addition of CH2 to the initial compound. Data absorbed from Table 1 and presented as the mean % change of nitrite activity relative to the control.
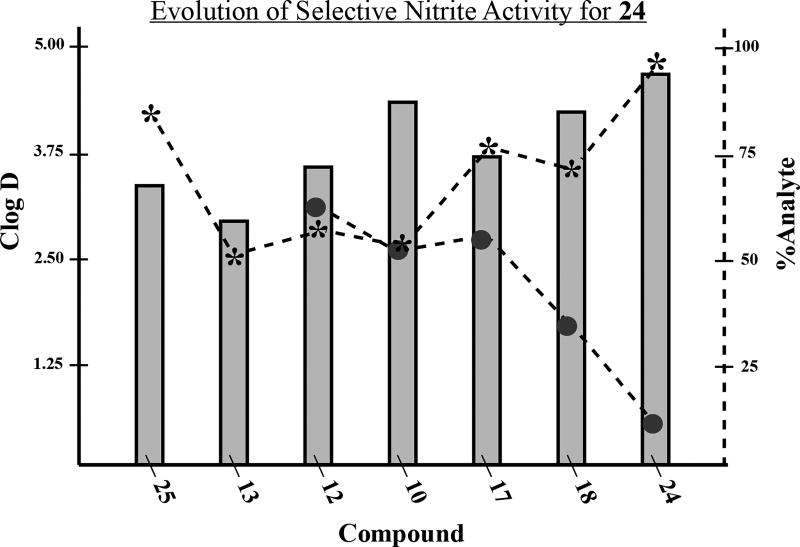
When considering these observations within the context of the data as a whole, perhaps the most salient finding is that compound 24 effects significant nitrite inhibition but leaves TNF-α essentially unperturbed. Analyzed in the logical progression, a focused series of phthalimidines correlates this selective anti-nitrite activity with consolidation of steric bulk, nitration and thioamidation (Table 2). The least-encumbered substrates 25 and 13 effected no detectable change in nitrite levels but clearly illustrated that thioamidation enhanced relative TNF-α production. As the bulk surrounding the phthalimidine nitrogen was progressively increased from noradamantyl in 13 to 2-adamantyl in 12 through alkyl-adamantyl in 10, TNF-α remained approximately 50% of control amounts, while nitrite levels began to decrease steadily. Des-methyl analog 17 reaffirmed that aromatic nitration enhances anti-nitrite activity, notwithstanding the slight decrease in steric bulk. Upon reintroduction of the methyl group in 18, TNF-α levels remained elevated but nitrite levels expectedly diminished in accordance with the increased lipophilicity. Ultimately, when appropriate sterics, nitration and thioamidation were united in 24, nitrite levels plummeted to 11.5% while TNF-α remained at 96% of the control, notably suggesting that 24 functions as a selective nitrite inhibitor under our assay conditions. This evolution of selective anti-nitrite activity is further illustrated and summarized in Figure 7. As the progression of compounds unfolds from 25 to 24, the Clog D (represented by the left axis and corresponding to the grey bars) trends upwards. As these values increase, an inflection is reached at compound 10. After this point, the associated analyte levels begin to differentiate and diverge. Quantified by the right axis, TNF-α (*) begins to rise while nitrite (●) begins to fall. When 24 is reached, Clog D is at its pinnacle, TNF-α remains high, and nitrite is substantially reduced.
Table 2.
Structure-activity trends in a family of substituted phthalimidines.
| compound | structure | Clog D | % TNF-αa | % nitritea |
|---|---|---|---|---|
| 25 |

|
3.30 | 85 | N/Ab |
| 13 |

|
2.88 | 52 | N/Ab |
| 12 |

|
3.51 | 58 | 62 |
| 10 |

|
4.25 | 55 | 52 |
| 17 |

|
3.63 | 77 | 55 |
| 18 |

|
4.16 | 72 | 35 |
| 24 |

|
4.58 | 96 | 11.5 |
Analyte % are represented as average % of analyte relative to control samples. Raw data absorbed from Table 1.
Data was not available as the levels in the control media (i.e. DMSO + LPS) were lower than the lowest level on the nitrite values on the standard curve.
Figure 7.
Graphical summary of selective anti-nitrite activity for compound 24. The focused library of phthalimidines is listed on the X-axis in progression towards compound 24. The corresponding grey bars represent Clog D values and are plotted via the left axis. The assocaited nitrite (●) and TNF-α (*) percentages are plotted via the right axis. Data extrapolated from Table 1 and presented graphically as the mean % change of analyte relative to control values.
2.3 Anti-angiogenesis activity
Given the anti-nitrite characteristics of our novel phthalimidines, we wondered what effect our molecules would have on angiogenesis in a model system. We took advantage of the fli1:EGFP zebrafish embryo model for determining in vivo angiogenic responses.19 In short, embryos were developed for 24 hours and then exposed to the phthalimidines of interest. During this period, the vasculature grows rapidly, producing new intersegmental vessels (ISVs). After an additional 24 hours of phthalimidine incubation, the zebrafish embryos were anaesthetized and analyzed for phthalimidine-sensitive angiogenic behavior. When compared to the control (vehicle alone) system, anti-angiogenic activity was evidenced by loss of ISVs or relative decreases in ISV outgrowth.
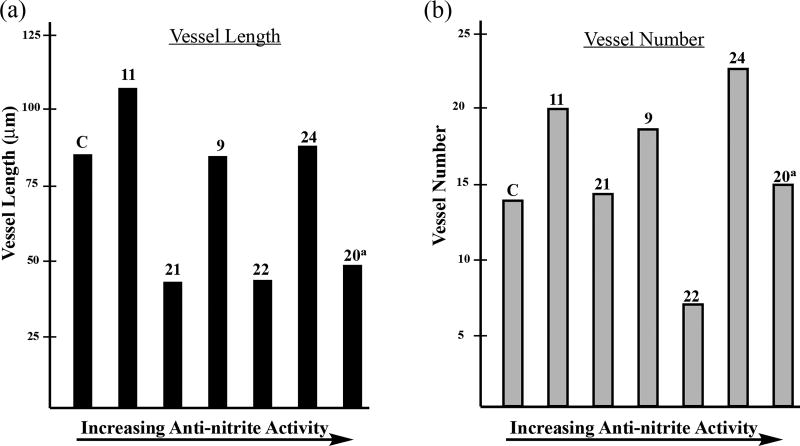
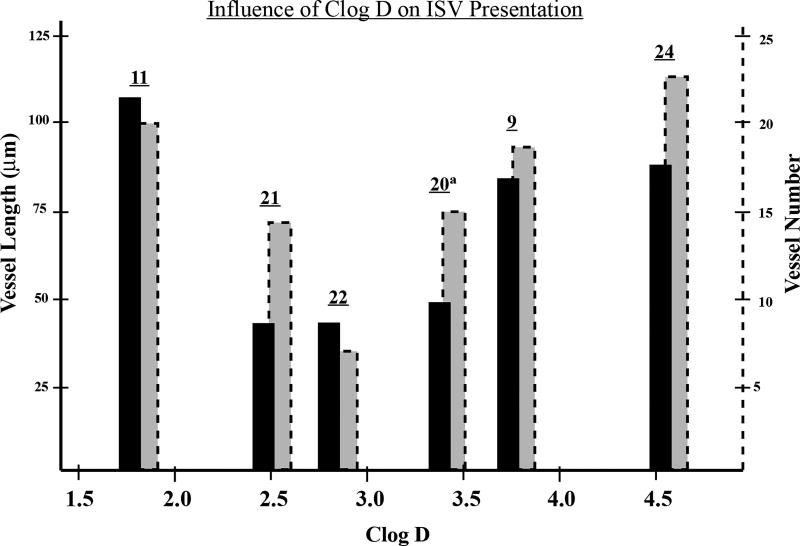
For this preliminary evaluation, we opted for a condensed series of phthalimidines spanning the range of anti-nitrite activity. We chose molecules affording an extensive selection of functional groups and skeletal backbones while also considering the logical progression and evolution of the anti-nitrite structure-activity relationship (Table 3). Compounds were initially tested at a low dose of 10µg/mL, roughly on par with the 30µM concentrations utilized in the preliminary TNF-α/nitrite screen. At first glance, the data appears quite erratic without any particular trends. When vessel length and vessel number are plotted according to increasing anti-nitrite ability, both parameters seem to fluctuate sporadically (Figure 8). However, an interesting pattern emerges when the combined data is plotted against Clog D (Figure 9). Based upon this focused series of phthalimidines, it appears that compounds at the extremes of Clog D behave unfavorably and in some cases, promote angiogenesis relative to the control. However, there does appear to be an anti-angiogenic sweet-spot localized around Clog D ≈ 2.8, where both vessel length and vessel number converge toward a minimum. In this regard, compound 22 was clearly the most effective molecule studied in this preliminary screen. Interestingly, the selective nitrite efficacy of 24 did not translate into notable anti-angiogenic activity in the zebrafish assay. On the contrary - compound 24 proved no more effective than the vehicle at decreasing vessel length and moderately bolstered vessel number relative to vehicle.
Table 3.
Anti-angiogenesis properties of substituted phthalimidines.
| compound | structure | % nitritea | vessel lengthb | # of vesselsc |
|---|---|---|---|---|
| 11 |

|
101 | 105.1±4.9 | 19.5±0.5 |
| 21 |

|
72 | 42.1±3.3 | 14.0±1.4 |
| 9 |

|
50 | 83.1±2.4 | 18.2±0.4 |
| 22 |

|
49 | 42.8±9.2 | 8.6±2.7 |
| 24 |

|
11.5 | 86.4±2.8 | 22.0±0.5 |
| 20 |

|
9.2 | 48.2±1.9d | 14.6±0.6d |
nitrite data extrapolated from Table 1; presented as mean % of control
vessel length in µm, obtained at 10µg/mL; presented as mean ± S.E.M
vessel number obtained at 10µg/mL; values presented as mean ± S.E.M
compound 20 screened at 5µg/mL; values presented as mean ± S.E.M
Figure 8.
Summary of anti-angiogeneis data for a focused family of adamantyl phthalimidines. Data obtained at 10µg/mL dosage. Each bar corresponds to an indicated novel phthalimidine or control (C). Data presented as the mean values extrapolated from Table 3 (a) Plot of average vessel length (µm). (b) Plot of average vessel number.
aThe data for compound 20 was obtained at 5µg/mL dosage.
Figure 9.
Comparison of vessel length and vessel number to Clog D. The solid black bars correspond to vessel length and are plotted via the solid left axis. The associated vessel number is depicted by the dashed grey shaded bars and is plotted via the corresponding dashed right axis. Data extrapolated from Table 3 and represetned as the mean values.
aThe data for compound 20 was obtained at 5µg/mL dosage.
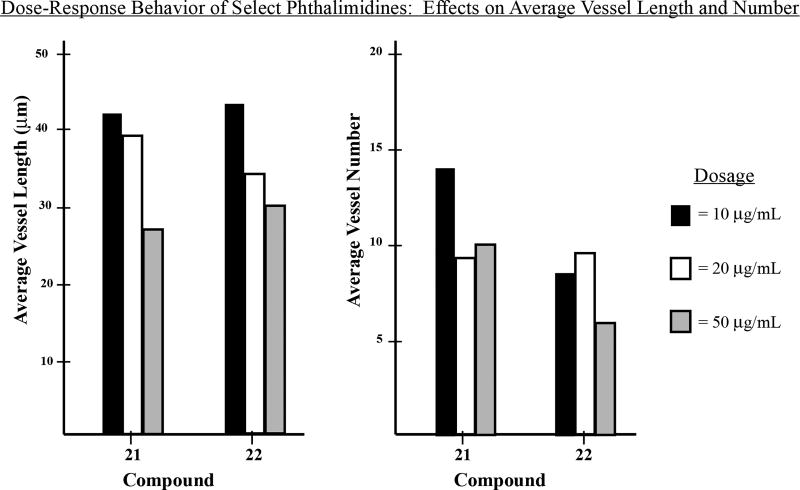
We selected compounds 20, 21, and 22 as the most promising anti-angiogenic candidates and subsequently analyzed each at increasing concentrations for evidence of dose-response behavior. Compound 20 appeared quite toxic, proving lethal to zebrafish at concentrations above 5µg/mL. Phthalimidines 21 and 22 were more well behaved, demonstrating dose-dependent decreases on vessel length for concentrations up to 50µg/mL (Figure 10). However, beyond this threshold the compounds became exceedingly toxic to zebrafish and we therefore chose to conclude our preliminary screen.
Figure 10.
Dose-response behavior for selected phthalimidines 21 and 22. Average vessel length and vessel number are expressed as mean values. Compounds and evaluated doses are represented by three-bar groupings as indicated in each plot.
When contemplating the anti-angiogenesis data in relation to the nitrite and TNF-α results, it is important to place in context the method of compound administration; with in vitro routes, compounds are applied directly to cells, while in the zebrafish embryo model, they are diluted into the tank water. The amount of analyte taken up by the zebrafish embryo is naturally variable, and the associated bioavailability is likely related to the polarity of the compounds in question. It is therefore also reasonable to hypothesize that for a supplied dosage, some phthalimidines are actually more anti-angiogenic than indicated; understandably, the fli1:EGFP assay simply may not translate such heightened effects for substrates of particular lipophilicity. It should be noted, however, that most of the compounds were generally well tolerated in RAW246.7 (see Table 1), suggesting that anti-angiogenic activity was likely attributable to selective targeting by our phthalimidines and not derivative of non-specific declines in protein synthesis consequent of drug-induced toxicity.
2.4 Hypothesis on Potential Mechanism of Action
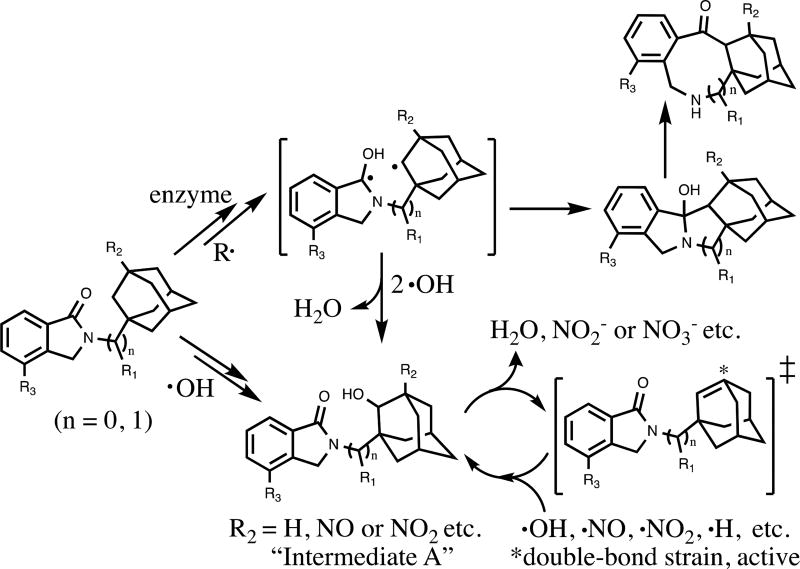
Our preliminary investigations revealed novel adamantyl phthalimidines as molecules with desirable biological properties and possessing noteworthy anti-nitrite activity. Given that cellular nitrite is linked to nitric oxide production and the associated radical pathways,20 we wondered if our molecules could act as radical scavengers, limiting nitrite by directly intercepting reactive oxygen (ROS) and nitrogen species (RNS). Horvat and colleagues21 have reported the diradical character and reactivity of activated N-(1-adamantylmethyl) and N-(2-adamantylmethyl) phthalimides, and we realized the structural analogies inherent in our own system. We therefore hypothesized that adamantyl phthalimidines might possess two radical-active positions (Scheme 4). In the top pathway, radical excitation or enzymatic initiation is followed by carbon-carbon bond formation, eventually leading to complex ring-expanded products. The lower pathway highlights adamantyl-type capture of ROS; elimination from Intermediate A provides a high-energy olefin22 capable of sequestering a variety of reactive species. Such intracellular neutralization of toxic free radicals is often neuroprotective, reducing CNS damage and lowering the risk of cancer and diseases caused by oxidative stress.
Scheme 4.
A hypothetical model of adamantyl phthalimidines functioning as radical scavengers inside cells. The generic groups R1, R2 and R3 are indicative of functional group locations and substituted patterns characteristic to novel adamantyl phthalimidines.
3. Conclusion
Herein we have reported 15 new substituted adamantyl and noradamantyl phthalimidines that demonstrate desirable neuroprotective and anti-angiogenic properties. Through careful and thorough analysis of the associated nitrite and TNF-α data, we were able to discern various trends inherit to this focused library, subsequently establishing the framework for a primary structure activity relationship. In the logical progression, site-specific nitration, alkylation and thioamidation provided compound 24, which when dosed at 30 µM, effected an 89% drop in LPS-induced nitrite production concurrent with only a 4% drop in TNF-α activity. Subsequent investigations revealed our novel phthalimidines as promising anti-angiogenics with 21 and 22, in particular, demonstrating dose-response behavior on zebrafish vessel length at concentrations up to 50µg/mL. Collectively, these observations prompt further exploration into diversified phthalimidine architecture with the goals of enhancing the SAR, illuminating the underlying mechanisms of action and fostering amelioration of relevant biological activities.
4. Experimental
4.1 General methods for organic synthesis
Melting points (uncorrected) were measured with a Fisher-Johns apparatus. 1H NMR, and 13C NMR were recorded on a Bruker (Bellevica, MA) AC-300 spectrometer and a Varian AS400 spectrometer. MS (m/z) data were measured on an Agilent 5973 GC-MS (CI). Elemental analyses were performed by Atlantic Microlab, Inc.
For compounds 9–13, a mixture of 77–155 mg (0.6–1.2 mmol) of phthaldialdehyde 8 and equal molar amount of appropriately substituted adamantylamine or noradamantylamine (if utilized as the hydrochloride salt, potassium carbonate, 0.55–1.0 eq, was added as appropriate) in 40–80 mL tetrahydrofuran was stirred for 171.5–211.0 h under a nitrogen atmosphere at room temperature. After removing solvent, the residues were purified by silica gel chromatography (EtOAc/Hex or MeOH/CH2Cl2).
For compounds, 16–22, a mixture of 216–522 mg (0.8–1.9 mmol) of 15, equal molar amount of potassium carbonate and equal molar amount of appropriately substituted adamantylamine or noradamantylamine (if utilized as the hydrochloride salt, potassium carbonate, 1.0–1.55eq, was added as appropriate) in 2–3 mL N,N-dimethylacetamide (DMA) was stirred for 18–71 h under a nitrogen atmosphere at room temperature, and then continuously reacted for 22–32 h at 50–58 °C. After removing solvent, the residues were purified by silica gel chromatography (EtOAc/Hex or MeOH/CH2Cl2) or by recrystallization with acetone.
For compounds 23–25, A mixture of 45–100 mg (0.176–0.338 mmol) of appropriately substituted adamantylalkyl phthalimidine or noradamantyl phthalimidine and 0.55 to 1.0 molar ratio of Lawesson’s reagent in 20 mL anhydrous toluene was refluxed for 15.5–22.0 h under a nitrogen atmosphere. After removing solvent, the residues were purified by silica gel chromatography (EtOAc/Hex).
4.2. 2,3-Dihydro-2-[(tricyclo[3.3.1.13,7]dec-1-yl)methyl]-1H-isoindol-1-one (9)
White solid (24%, from EtOAc/Hex); mp 148.0–149.0 °C; 1H NMR (CDCl3) δ 7.85 (d, J = 7.3 Hz, 1H, C7-H), 7.55-7.41 (m, 3H, Ar-H), 4.50 (s, 2H, C3-H), 3.26 (s, 2H, NCH2Ad), 1.99-1.57 (m, 15H, Ad-H) ppm; 13C NMR (CDCl3) δ 169.5, 141.4, 132.9, 131.1, 127.9, 123.8, 122.4, 55.8, 54.0, 41.1, 36.9, 36.0 and 28.4 ppm; MS (CI/CH4), m/z 282 (MH+); Anal. calcd for C19H23NO1/5H2O: C, 80.07; H, 8.28; N, 4.91. Found: C, 80.08; H, 8.13; N, 4.70.
4.3. 2,3-Dihydro-2-[1-(1-tricyclo[3.3.1.13,7]dec-1-yl)ethyl]-1H-isoindol-1-one (10)
White needle crystals (60%, from EtOAc/Hex); mp 185.0–186.5 °C; 1H NMR (DMSO-d6) δ 7.68 (d, J = 7.4 Hz, 1H, C7-H), 7.62-7.45 (m, 3H, Ar-H), 4.54 (s, 2H, C3-H), 4.01 (q, J = 7.2 Hz, 1H, NCHMeAd), 1.98-1.41 (m, 15H, Ad-H) and 1.21 (d, J = 7.2 Hz, 3H, CH3) ppm; 13C NMR (DMSO-d6) δ 168.2, 142.4, 132.6, 131.5, 128.2, 123.7, 123.2, 39.3, 37.4, 36.9, 28.3 and 12.6 ppm; MS (CI/CH4), m/z 295 (M+); Anal. calcd for C20H25NO: C, 81.31; H, 8.53; N, 4.74. Found: C, 81.01; H, 8.46; N, 4.62.
4.4. 2,3-Dihydro-2-(3-hydroxy-tricyclo[3.3.1.13,7]dec-1-yl)-1H-isoindol-1-one (11)
White crystals (41%, from MeOH/CH2Cl2); mp 218.5–219.5 °C; 1H NMR (CDCl3) δ 7.79 (d, J = 7.4 Hz, 1H, C7-H), 7.52-7.39 (m, 3H, Ar-H), 4.47 (s, 2H, C3-H), 3.48 (s, 1H, OH), 2.43-1.55 (m, 14H, Ad-H) ppm; 13C NMR (CDCl3) δ 168.9, 140.8, 134.3, 131.0, 127.9, 123.3, 122.4, 69.2, 57.8, 47.7, 44.1, 38.7, 34.9 and 30.8 ppm; MS (CI/CH4), m/z 284 (MH+); Anal. calcd for C18H21NO21/5H2O: C, 75.34; H, 7.52; N, 4.88. Found: C, 75.38; H, 7.23; N, 4.75.
4.5. 2,3-Dihydro-2-(tricyclo[3.3.1.13,7]dec-2-yl)-1H-isoindol-1-one (12)
White needle crystals (62%, from MeOH/CH2Cl2); mp 121.5–123.0 °C; 1H NMR (CDCl3) δ 7.83 (d, J = 7.7 Hz, 1H, C7-H), 7.54-7.41 (m, 3H, Ar-H), 4.67 (s, 2H, C3-H), 4.34 (s, 1H, C2’-H) and 2.49-1.71 (m, 14H, Ad-H) ppm; 13C NMR (CDCl3) δ 169.3, 141.6, 133.0, 131.0, 127.8, 123.3, 122.4, 58.3, 50.3, 38.2, 37.8, 32.7, 31.7, 27.6 and 27.3 ppm; MS (CI/CH4), m/z 267 (M+); Anal. calcd for C18H21NO1/10H2O: C, 80.32; H, 7.94; N, 5.20. Found: C, 80.06; H, 7.88; N, 5.03.
4.6. 2,3-Dihydro-2-(tricyclo[3.3.1.03,7]non-3-yl)-1H-isoindol-1-one (13)
White needle crystals (60%, from MeOH/CH2Cl2); mp 151.5–153.0 °C; 1H NMR (CDCl3) δ 7.82 (d, J = 6.9 Hz, 1H, C7-H), 7.50-7.41 (m, 3H, Ar-H), 4.50 (s, 2H, C3-H) and 2.99-1.55 (m, 13H, Norad-H) ppm; 13C NMR (CDCl3) δ 168.9, 141.2, 134.4, 130.8, 127.9, 123.1, 122.4, 67.8, 49.3, 47.6, 43.4, 42.3, 37.2 and 34.7 ppm; MS (CI/CH4), m/z 253 (M+); Anal. calcd for C17H19NO1/10H2O: C, 80.03; H, 7.58; N, 5.49. Found: C, 79.99; H, 7.29; N, 5.41.
4.7. Methyl 2-bromomethyl-3-nitrobenzoate (15)
A mixture of 18.7 g (95.8 mmol) of methyl 2-methyl-3-nitrobenzoate 14, 17.1 g (96.1 mmol) of N-bromosuccinimide and 0.7 g (2.9 mmol) of benzoyl peroxide in 500 mL carbon tetrachloride was refluxed for 20 h. The reaction mixture was cooled and concentrated. Thereafter, it was precipitated and washed by ethyl ether to afford product 15 (22.3 g, 84.8%) as yellowish crystals: mp 68.0–70.0 °C (ref. 67–70 °C). Prepared in accordance with reference 15 (Hay, J. V. US 4,678,500 A 1987).
4.8. 2,3-Dihydro-4-nitro-2-(tricyclo[3.3.1.13,7]dec-1-yl)-1H-isoindol-1-one (16)
Yellowish solid (54%, from EtOAc/Hex); mp 214.0–215.5 °C; 1H NMR (CDCl3) δ 8.37 (d, J = 7.6 Hz, 1H, C7-H), 8.12 (d, J = 7.6 Hz, 1H, C5-H), 7.66 (t, J = 7.6 Hz, 1H, C6-H), 4.93 (s, 2H, C3-H) and 2.43-1.73 (m, 15H, Ad-H) ppm; 13C NMR (CDCl3) δ 166.1, 143.2, 138.0, 136.5, 129.6, 129.4, 126.2, 56.2, 48.6, 40.0, 36.4, 36.2, 29.7 and 29.6 ppm; MS (CI/CH4), m/z 312 (M+); Anal. calcd for C18H20N2O31/2H2O: C, 67.27; H, 6.59; N, 8.72. Found: C, 67.18; H, 6.36; N, 8.55.
4.9. 2,3-Dihydro-4-nitro-2-[(tricyclo[3.3.1.13,7]dec-1-yl)methyl]-1H-isoindol-1-one (17)
White crystals (63%, from MeOH/CH2Cl2); mp 178.5–179.5 °C; 1H NMR (CDCl3) δ 8.35 (d, J = 7.6 Hz, 1H, C7-H), 8.11 (d, J = 7.6 Hz, 1H, C5-H), 7.65 (t, d, J = 7.6 Hz, 1H, C6-H), 4.92 (s, 2H, C3-H), 3.26 (s, 2H, NCH2Ad) and 2.04-1.47 (m, 15H, Ad-H) ppm; 13C NMR (CDCl3) δ 167.0, 143.2, 137.0, 136.1, 129.9, 129.6, 126.5, 55.9, 54.8, 41.1, 36.8, 36.0, 28.4 and 28.3 ppm; MS (CI/CH4), m/z 326 (M+); Anal. calcd for C19H22N2O31/2H2O: C, 68.04; H, 6.91; N, 8.35. Found: C, 68.10; H, 6.72; N, 8.15.
4.10. 2,3-Dihydro-4-nitro-2-[1-(1-tricyclo[3.3.1.13,7]dec-1-yl)ethyl]-1H-isoindol-1-one (18)
Yellow crystals (42%, by recrystallization with acetone); mp 187.5–188.5 °C; 1H NMR (DMSO-d6) δ 8.40 (d, J = 7.6 Hz, 1H, C7-H), 8.11 (d, J = 7.6 Hz, 1H, C5-H), 7.78 (t, J = 7.6 Hz, 1H, C6-H), 4.91 (s, 2H, C3-H), 3.99 (q, J = 7.3 Hz, 1H, NCHMeAd), 1.91-1.41 (m, 15H, Ad-H) and 1.21 (d, J = 7.3 Hz, 3H, CH3) ppm; 13C NMR (DMSO-d6) δ 166.2, 143.7, 138.0, 135.8, 130.3, 129.8, 126.8, 39.3, 37.6, 36.8, 28.4, 28.3, 28.2 and 12.5 ppm; MS (CI/CH4), m/z 340 (M+); Anal. calcd for C20H24N2O3: C, 70.56; H, 7.11; N, 8.23. Found: C, 70.28; H, 6.97; N, 8.15.
4.11. 2,3-Dihydro-4-nitro-2-(3-hydroxy-tricyclo[3.3.1.13,7]dec-1-yl)-1H-isoindol-1-one (19)
White crystals (45%, from MeOH/CH2Cl2); mp 230.0–231.5 °C; 1H NMR (DMSO-d6) δ 8.37 (d, J = 7.9 Hz, 1H, C7-H), 8.02 (d, J = 7.9 Hz, 1H, C5-H), 7.75 (t, J = 7.9 Hz, 1H, C6-H), 4.96 (s, 2H, C3-H), 4.61 (s, 1H, OH) and 2.19-1.46 (m, 14H, Ad-H) ppm; 13C NMR (DMSO-d6) δ 165.7, 143.4, 137.4, 137.3, 130.3, 129.5, 126.8, 67.9, 58.0, 48.8, 47.5, 44.3, 38.3, 35.0 and 30.6 ppm; MS (CI/CH4), m/z 328 (M+); Anal. calcd for C18H20N2O4: C, 65.84; H, 6.14; N, 8.53. Found: C, 65.48; H, 6.09; N, 8.34.
4.12. 2,3-Dihydro-4-nitro-2-(tricyclo[3.3.1.13,7]dec-2-yl)-1H-isoindol-1-one (20)
Yellowish crystals (48%, from MeOH/CH2Cl2); mp 179.0–180.5 °C; 1H NMR (Acetone-d6) δ 8.44 (d, J = 7.5 Hz, 1H, C7-H), 8.12 (d, J = 7.5 Hz, 1H, C-5H), 7.85 (t, J = 7.5 Hz, 1H, C6-H), 5.21 (s, 2H, C3-H), 4.29 (s, 1H, C2’-H) and 2.51-1.76 (m, 14H, Ad-H) ppm; 13C NMR (Acetone-d6) δ 166.3, 143.6, 137.7, 136.4, 129.6, 129.1, 126.2, 59.0, 50.7, 37.9, 37.5, 32.3, 31.3, 27.6 and 27.2 ppm; MS (CI/CH4), m/z 312 (M+); Anal. calcd for C18H20N2O3: C, 69.21; H, 6.45; N, 8.97. Found: C, 69.07; H, 6.51; N, 8.79.
4.13. 2,3-Dihydro-4-amino-2-(tricyclo[3.3.1.13,7]dec-2-yl)-1H-isoindol-1-one (21)
A mixture of 60.0 mg (0.192 mmol) of 2,3-dihydro-4-nitro-2-(tricyclo[3.3.1.13,7]dec-2-yl)-1H-isoindol-1-one 20 and 104 mg of palladium on carbon (10 wt.%) in 100 mL methanol was shaken for 67 h under the hydrogen atmosphere (46 lbs.) at room temperature. Thereafter, filtrate was chromatographed on silica gel (MeOH/CH2Cl2 = 1/20) to provide product 21 as a gum (28.8 mg, 53.1%): 1H NMR (CDCl3) δ 7.31-7.25 (m, 2H, C7, C6-H), 6.82 (d, J = 8.4 Hz, 1H, C5-H), 4.52 (s, 2H, C3-H), 4.34 (s, 1H, C2’-H), 3.80 (s, br, 2H, NH2) and 2.36-1.72 (m, 14H, Ad-H) ppm; 13C NMR (CDCl3) δ 169.8, 140.6, 133.9, 129.2, 126.6, 117.4, 114.0, 58.3, 48.1, 38.3, 37.8, 32.8, 31.8, 27.6 and 27.3 ppm; MS (CI/CH4), m/z 282 (M+).
4.14. 2,3-Dihydro-4-nitro-2-(tricyclo[3.3.1.03,7]non-3-yl)-1H-isoindol-1-one (22)
White crystals (70%, from MeOH/CH2Cl2); mp 216.0–217.5 °C; 1H NMR (CDCl3) δ 8.35 (d, J = 7.8 Hz, 1H, C7-H), 8.12 (d, J = 7.8 Hz, 1H, C5-H), 7.66 (t, J = 7.8 Hz, 1H, C6-H), 4.94 (s, 2H, C3-H) and 3.04-1.57 (m, 13H, Norad-H) ppm; 13C NMR (CDCl3) δ 166.0, 143.3, 137.7, 136.8, 129.5, 129.4, 126.2, 68.2, 50.3, 47.6, 43.4, 42.3, 37.1 and 34.6 ppm; MS (CI/CH4), m/z 298 (M+); Anal. calcd for C17H18N2O31/3H2O: C, 67.09; H, 6.18; N, 9.20. Found: C, 66.97; H, 5.96; N, 9.07.
4.15. 2,3-Dihydro-2-[1-(1-tricyclo[3.3.1.13,7]dec-1-yl)ethyl]-1H-isoindol-1-thione (23)
Yellow solid (57%); mp 199.0–200.5 °C; 1H NMR (DMSO-d6) δ 7.85 (d, J = 7.6 Hz, 1H, C7-H), 7.61-7.47 (m, 3H, Ar-H), 5.06 (q, J = 7.1 Hz, 1H, NCHMeAd), 4.86 (s, 2H, C3-H), 1.97-1.47 (m, 15H, Ad-H) and 1.21 (d, J = 7.1 Hz, 3H, CH3) ppm; 13C NMR (DMSO-d6) δ 192.9, 141.1, 139.4, 131.7, 128.4, 125.5, 123.0, 59.7, 55.5, 39.3, 37.7, 36.8, 28.4 and 12.8 ppm; MS (CI/CH4), m/z 309 (M-2); Anal. calcd for C20H25NS: C, 77.12; H, 8.09; N, 4.50. Found: C, 76.83; H, 8.03; N, 4.38.
4.16. 2,3-Dihydro-4-nitro-2-[1-(1-tricyclo[3.3.1.13,7]dec-1-yl)ethyl]-1H-isoindol-1-thione (24)
Orange-red crystals (46%); mp 211.5–212.5 °C; 1H NMR (CDCl3) δ 8.49-8.36 (m, 2H, C5, C7-H), 7.69 (t, J = 8.7 Hz, 1H, C6-H), 5.29-5.09 (m, 3H, C3-H, NCHMeAd), 2.09-1.61 (m, 15H, Ad-H) and 1.35 (d, J = 8.1 Hz, 3H, CH3) ppm; 13C NMR (CDCl3) δ 191.3, 143.0, 142.4, 135.1, 132.6, 129.7, 126.1, 60.4, 56.6, 39.7, 38.2, 36.8, 28.4 and 12.7 ppm; MS (CI/CH4), m/z 356 (M+); Anal. calcd for C20H24N2O2S1/5H2O: C, 66.71; H, 6.83; N, 7.78. Found: C, 66.38; H, 6.53; N, 7.40.
4.17. 2,3-Dihydro-2-(tricyclo[3.3.1.03,7]non-3-yl)-1H-isoindol-1-thione (25)
Yellowish needle crystals (72%); mp 185.0–186.5 °C; 1H NMR (DMSO-d6) δ 7.84 (d, J = 7.7 Hz, 1H, C7-H), 7.58-7.47 (m, 3H, Ar-H), 4.99 (s, 2H, C3-H) and 2.61-1.53 (m, 13H, Norad-H) ppm; 13C NMR (DMSO-d6) δ 190.9, 141.6, 140.4, 131.4, 128.3, 124.5, 122.6, 72.3, 58.0, 46.4, 43.3, 40.9, 37.0 and 34.8 ppm; MS (CI/CH4), m/z 267 (M-2); Anal. calcd for C17H19NS: C, 75.79; H, 7.11; N, 5.20. Found: C, 75.68; H, 6.96; N, 5.14.
5. Biological assays
5.1. Assessments of drug anti-TNF-α and anti-nitric oxide generation in RAW 264.7 cells
RAW 264.7 cells were purchased from ATCC (Manassas, VA, USA). The cells were grown in DMEM media (Invitrogen, DMEM, high glucose, GlutaMAX™ Supplement, pyruvate, #10569-010) supplemented with 10% FBS (Invitrogen, Fetal Bovine Serum, qualified, heat inactivated, #16140-071) with penicillin and streptomycin (Invitrogen, Penicillin-Streptomycin (10,000 U/mL), #15140-122) and were maintained at 37 °C and 5% CO2. The cells were grown to 75% to 85 % confluence on 10 cm plates (Corning-Falcon, #353003) following the protocol described by ATCC. To assess for drug effects on LPS-induced markers of inflammation, namely TNF-α protein and nitrite ion levels (NO2−, a stable end-product of nitric oxide metabolism) cells were seeded into 24 well plates (VWR, #10062-896) at a density of 200 × 103 cells per well. On each plate there was one blank well where no cells were added yet culture media in the well was treated similarly to wells with cells (n=1). The blank well media was used for background subtractions for various downstream assays. Twenty-four hours after seeding the plate the seeding media was replaced with fresh media. Two hours after this the cells were exposed to a range of concentrations of drug test-compound(s) dissolved in 100% tissue culture grade dimethyl sulfoxide (DMSO, SIGMA #D2650). Drug stocks were prepared in a 200 times more concentrated stock in DMSO. The final concentration of DMSO added to the cells was 0.5%. The effects of each concentration of drug were assessed in 4 wells per concentration in the 24 well plate (n=3#–4). On each plate one set of wells were assigned as drug-vehicle controls (i.e. DMSO), one test compound was assessed on one 24 well plate. The drug concentrations used for each test agent were 1, 10 and 30 µM and are indicated in the associated figures. One hour after the drugs were added the cells were challenged with lipopolysaccharide (LPS, SIGMA, serotype 055:B5) at a final concentration of 60 ng/ml. Twenty to twenty-four hours after the cells were challenged with LPS the culture media was collected and utilized for the measurement of markers of inflammation.
5.2. Enzyme-Linked Immunosorbent Assay for TNF-α protein
Media TNF-α levels were measured by use of the BioLegend ELISA MAX™ Set Delux ELISA (#430904). The protocol used was that recommended by the manufacturer. In brief a day prior to performing the assay a 96 well plate was coated with a capture antibody directed against TNF-α. The following day the assay plate was washed and blocked with the kit blocking agent for 1 hour while being mixed on a plate shaker at 200 rpm (all incubations were mixed at 200 rpm unless stated otherwise). A TNF-α protein standard curve was prepared in the assay diluent following the kit instructions and unknown media samples were likewise diluted in the same assay diluent. After blocking, the plate was washed and then both the standards and unknown media samples were added to the plate in duplicate. The standards and unknown samples were incubated for 2 hours. After the incubation the plate was washed and then the biotin labeled detection antibody was added to each well and incubated for a further 1 hour. After this incubation the avidin-HRP conjugate complex was added to each well and incubated for 30 min. The plate was washed and the chromogenic substrate 3,3',5,5'-tetramethylbenzidine solution was added to each well. At this point the plate was covered and incubated in the dark for 15 minutes, with no mixing. After 15 minutes the chromogenic reaction was stopped by the addition of 2N H2SO4 and the absorbance was read at 450 nm and for background subtractions at 570 nm, on a SPECTRAmax PLUS plate reader. The absorbances were used to generate a TNF-α protein standard curve and the protein levels in the unknown samples were determined using SoftMax Pro V5, Molecular Devices.
5.3. Nitrite ion detection in drug treated RAW 267.4 cell culture media
To measure the levels of nitrite ion (NO2−) we utilized the Griess Reagent System (Promega, Madison, WI, Cat # G2930). The protocol followed was that recommended by the manufacturer, in brief a NO2− ion standard curve was prepared in culture media of the same composition to that used for the cell culture study. The concentration range of the standard curve was from 1.5 µM to 100 µM. Equal volumes (50 µl) of standards and unknown samples were added to clear 96 well plates in duplicate. Then 50 µl of sulfanilamide solution was added to each well and the plate was covered and incubated in the dark for 10 minutes. After the incubation period 50 µl of N-1-napthylethylenediamine dihydrochloride solution was added to each well and the plate was incubated in the dark for a further 10 minutes. After this incubation the plate was read at 550 nm on a SPECTRAmax PLUS plate reader and the absorbances were used to generate a NO2− standard curve and the NO2− ion levels of the unknown samples are determined using SoftMax Pro V5, Molecular Devices.
5.4. Cellular viability assessment of drug treated RAW 264.7 cells
RAW 264.7 cell viability was determined by use of the CellTiter 96 AQueous One Solution Cell Proliferation Assay (Promega, Madison, WI). Changes in cellular health status were determined by use of indirect measures related to the formation of a colored tetrazolium dye product that can be measured spectrophotometrically at 490 nm. An increase in absorbance at 490 nm is indicative of an increase in numbers of healthy cells, similarly a reduction in absorbance is indicative of a reduction of healthy cells. After the culture media was harvested for use in TNF-α and NO2− ion assays, the media was replaced with 0.5 ml of fresh media plus 100 µl of the cell viability reaction mixture. After a 20 to 30 minute incubation at 37 °C with 5% CO2 the absorbance at 490 nm was obtained using an infinite M200 PRO plate reader (TECAN, USA).
5.5. Statistical Analyses for RAW-derived assays
Data are expressed as a percentage change from the DMSO-vehicle control measurements. Measurements are expressed as mean ± standard errors, where the n number represents the number of wells in a 24 well plate. Due to the presence of one blank control well on each plate, for some drug concentrations the n number is 3# and not 4. Statistical comparisons were undertaken by use of a One-Way ANOVA with appropriate Bonferroni corrections for multiple comparisons, as required (GraphPad InStat Version 3.05). P values of <0.05 are considered to be of statistical significance.
5.6. Zebrafish anti-angiogenesis assays
Zebrafish experiments were performed as previously described in references 13a–b (Beedie et al., 2016, Mahony et al., 2013) and references 17a–c (Beedie et al., 2015, Therapontos et al., 2009, Beedie et al., 2017.) Briefly, fli1:EGFP zebrafish (Zebrafish International Resource Centre, Oregon, USA) were maintained in aquarium housing at 28°C. Zebrafish pairs were mated and embryos were collected. Lines transgenic for GFP were identified using a fluorescent microscope. At 24 hours post fertilization, embryos were manually dechorionated and the zebrafish moved to plates containing the compounds to be tested. Zebrafish were exposed to each compound for 24 hours, at which point they were anaesthetized with 0.1% tricaine. Microscopic imaging under blue fluorescent light was then used to assess vessel development. ImageJ was used to quantify vessel length and number excluding the posterior 5 intersegmental vessels. All animal work was licensed and carried out in accordance with UK Home office and institutional ethical and welfare guidelines.
Supplementary Material
Acknowledgments
This research was supported in part by the Intramural Research Program of the NIH, National institute on Aging. In addition, SB, NV, WDF funded by a Wellcome Trust-NIH PhD Scholarship (Grant number: 098252/Z/12/Z).
Footnotes
Publisher's Disclaimer: This is a PDF file of an unedited manuscript that has been accepted for publication. As a service to our customers we are providing this early version of the manuscript. The manuscript will undergo copyediting, typesetting, and review of the resulting proof before it is published in its final citable form. Please note that during the production process errors may be discovered which could affect the content, and all legal disclaimers that apply to the journal pertain.
Competing Interests
Authors NG, NV, WDF, DT, SB and WL have patents on these compounds. US patent application No. US2016/054430.
References
- 1.(a) For a recent review on redox signaling and oxidative stress, see: Schieber M, Chandel NS. Current Biology. 2014;24:R453–R462. doi: 10.1016/j.cub.2014.03.034.Shahani N, Sawa A. Antioxid. Redox Signal. 2011;14(8):1493. doi: 10.1089/ars.2010.3580.Chung KK, David KK. Nitric Oxide. 2010;22(4):290. doi: 10.1016/j.niox.2010.02.002.
- 2.(a) Moncada S, Palmer RMJ, Higgs EA. Biochemical Pharmacology. 1989;38(11):1709. doi: 10.1016/0006-2952(89)90403-6. [DOI] [PubMed] [Google Scholar]; (b) Aldskogius H, Liu L, Syensson M. J. Neurosci. Res. 1999;58:33. [PubMed] [Google Scholar]
- 3.(a) Saxena S, Caroni P. Neuron. 2001;71:35. doi: 10.1016/j.neuron.2011.06.031. [DOI] [PubMed] [Google Scholar]; (b) Bredesen DE. Mol Neurodegener. 2009;4:27. doi: 10.1186/1750-1326-4-27. [DOI] [PMC free article] [PubMed] [Google Scholar]
- 4.(a) Swardfager W, Lanctot K, Rothenburg L, Wong A, Cappell J, Herrmann N. Biol Psychiatry. 2010;68(10):930. doi: 10.1016/j.biopsych.2010.06.012. [DOI] [PubMed] [Google Scholar]; (b) Locksley RM, Killeen N, Lenardo MJ. Cell. 2001;104(4):487. doi: 10.1016/s0092-8674(01)00237-9. [DOI] [PubMed] [Google Scholar]; (c) Dowlati Y, Herrmann N, Swardfager W, Liu H, Sham L, Reim EK. Biol Psychiatry. 2010;67(5):446. doi: 10.1016/j.biopsych.2009.09.033. [DOI] [PubMed] [Google Scholar]; (d) Brynskov J, Foegh P, Pedersen G, Ellervik C, Kirkegaard T, Bingham A. Gut. 2002;51(1):37. doi: 10.1136/gut.51.1.37. [DOI] [PMC free article] [PubMed] [Google Scholar]; (e) Frankola KA, Greig NH, Luo W, Tweedie D. CNS & Neurological Disorders - Drug Targets. 2011;10:391. doi: 10.2174/187152711794653751. [DOI] [PMC free article] [PubMed] [Google Scholar]; (f) Tweedie D, Luo W, Short RG, Brossi A, Holloway HW, Li Y, Yu Q, Greig NH. J. Neumeth. 2009;183:182. doi: 10.1016/j.jneumeth.2009.06.034. [DOI] [PMC free article] [PubMed] [Google Scholar]; (g) Carmeliet P, Jain RK. Nature. 2000;407:249. doi: 10.1038/35025220. [DOI] [PubMed] [Google Scholar]; (h) Coussens LM, Werb Z. Nature. 2002;420:860. doi: 10.1038/nature01322. [DOI] [PMC free article] [PubMed] [Google Scholar]; (i) Balkwill F, Coussens LM. Nature. 2004;431:405. doi: 10.1038/431405a. [DOI] [PubMed] [Google Scholar]
- 5.Tarkowski E, Blennow K, Wallin A, Tarkowski A. J. Clin. Immunol. 1999;19:223. doi: 10.1023/a:1020568013953. [DOI] [PubMed] [Google Scholar]
- 6.Tarkowski E, Andreasen N, Tarkowski A, Blennow K. J. Neurol. Neurosurg. Psychiatry. 2003;74:1200. doi: 10.1136/jnnp.74.9.1200. [DOI] [PMC free article] [PubMed] [Google Scholar]
- 7.(a) Ohkuma S, Katsura M. Progress in Neurobiology. 2001;64:97. doi: 10.1016/s0301-0082(00)00041-1. [DOI] [PubMed] [Google Scholar]; (b) Bloodsworth A, O’Donnell VB, Freeman BA. Arterioscler Thromb Vasc Biol. 2000;20:1707. doi: 10.1161/01.atv.20.7.1707. [DOI] [PubMed] [Google Scholar]
- 8.(a) Knowles RG, Palacios M, Palmer RM, Moncada S. Proc Natl Acad Sci USA. 1989;86:5119. doi: 10.1073/pnas.86.13.5159. [DOI] [PMC free article] [PubMed] [Google Scholar]; (b) Snyder SH, Bredt DS. Trends Pharmacol Sci. 1991;12:125. doi: 10.1016/0165-6147(91)90526-x. [DOI] [PubMed] [Google Scholar]; (c) Law A, Gauthier S, Quirion R. Brain Research Reviews. 2001;35:73. doi: 10.1016/s0165-0173(00)00051-5. [DOI] [PubMed] [Google Scholar]; (d) Hoffman MA. Science. 1991;252:1788. doi: 10.1126/science.1712121. [DOI] [PubMed] [Google Scholar]; (e) Lancaster FE. Alcohol Clin Exp Res. 1992;16:539. doi: 10.1111/j.1530-0277.1992.tb01413.x. [DOI] [PubMed] [Google Scholar]; (f) Nowicki JP, Duval D, Poignet H, Scatton B. Eur J Pharmacol. 1991;204:339. doi: 10.1016/0014-2999(91)90862-k. [DOI] [PubMed] [Google Scholar]; (g) Eliasson MJ, Huang Z, Ferrante RJ, Sasamata M, Molliver ME, Snyder SH, Moskowitz MA. J. Neurosci. 1999;19:5910. doi: 10.1523/JNEUROSCI.19-14-05910.1999. [DOI] [PMC free article] [PubMed] [Google Scholar]
- 9.Goodwin JL, Uemura E, Cunnick JE. Brain Research. 1995;692:207. doi: 10.1016/0006-8993(95)00646-8. [DOI] [PubMed] [Google Scholar]
- 10.Jenkins DC, Charles IG, Thomsen LL, Moss DW, Homes LS, Baylis SA, Rhodes P, Westmore K, Emson PC, Moncada S. Proc. Natl. Acad. Sci. USA. 1995;92:4392. doi: 10.1073/pnas.92.10.4392. [DOI] [PMC free article] [PubMed] [Google Scholar]
- 11.Greig NH, Luo W, Tweedie D, Holloway HW, Yu Q, Goetzl EJ. 8,927,725 B2. US. 2015
- 12.(a) Petit A, Bihel F, Costa CA, Pourquié O, Checler F, Kraus J. Nature cell Biology. 2001;3:507. doi: 10.1038/35074581. [DOI] [PubMed] [Google Scholar]; (b) Christie G, Markwell RE, Gray CW, Smith L, Godfrey F, Mansfield F, Wadsworth H, King R, McLaughlin M, Cooper DG, Ward RV, Howlett DR, Hartmann T, Lichtenthaler SF, Beyreuther K, Underwood J, Gribble SK, Cappai R, Masters CL, Tamaoka A, Gardner RL, Rivett AJ, Karran EH, Allsop D. J. Neurochem. 1999;73:195. doi: 10.1046/j.1471-4159.1999.0730195.x. [DOI] [PubMed] [Google Scholar]; (c) Citron M, Diehl TS, Capell A, Haass C, Teplow DB, Selkoe DJ. Neuron. 1996;17:171. doi: 10.1016/s0896-6273(00)80290-1. [DOI] [PubMed] [Google Scholar]; (d) Joubert J, Dyk S, Green IR, Malan SF. Bioorg. Med. Chem. 2011;19:3935. doi: 10.1016/j.bmc.2011.05.034. [DOI] [PubMed] [Google Scholar]; (e) Mizoguchi K, Yokoo H, Yoshida M, Tanaka T, Tanaka M. Brain Research. 1994;662:255. doi: 10.1016/0006-8993(94)90821-4. [DOI] [PubMed] [Google Scholar]; (f) Danysz W, Parsons CG, Kornhuber J, Schmidt WJ, Quack G. Neuroscience and Biobehavioral Reviews. 1997;21(4):455. doi: 10.1016/s0149-7634(96)00037-1. [DOI] [PubMed] [Google Scholar]; (g) Parsons CG, Danysz W, Quack G. Neuropharmacology. 1999;38:735. doi: 10.1016/s0028-3908(99)00019-2. [DOI] [PubMed] [Google Scholar]; (h) Zou JY, Crews FT. Brain Research. 2005;1034:11. doi: 10.1016/j.brainres.2004.11.014. [DOI] [PubMed] [Google Scholar]; (i) Joubert J, Dyk S, Malan SF. Bioorg. Med. Chem. 2008;16:8952. doi: 10.1016/j.bmc.2008.08.049. [DOI] [PubMed] [Google Scholar]; (j) Neuraxon Inc. WO20007118314. 2007 [Google Scholar]
- 13.(a) Paci C, Thomas A, Onofrj M. Nerol Sci. 2001;22:75. doi: 10.1007/s100720170054. [DOI] [PubMed] [Google Scholar]; (b) Pinna A, Chiara GD, Wardas J, Morelli M. Eur. J. Neurosci. 1996;8:1176. doi: 10.1111/j.1460-9568.1996.tb01285.x. [DOI] [PubMed] [Google Scholar]; (c) Ferré S, O’Connor WT, Fuxe K, Ungerstedt U. The Journal of Neuroscience. 1993;13(12):5402. doi: 10.1523/JNEUROSCI.13-12-05402.1993. [DOI] [PMC free article] [PubMed] [Google Scholar]; (d) Baldessarini RJ, Lipinski JF, Chace KV. Biochemical Pharmacology. 1972;21:77. doi: 10.1016/0006-2952(72)90252-3. [DOI] [PubMed] [Google Scholar]; (e) Merello M, Nouzeilles MI, Cammarota A, Leiguarda R. Clinical Neuropharmacology. 1999;22(5):273. [PubMed] [Google Scholar]; (f) Standaert DG, Young AB. The Pharmacological Basis of Therapeutics. McGraw-Hill; New York: 2001. p. 549. [Google Scholar]; (g) Moryl E, Danysz W, Quack G. Pharmacology & Toxicology. 1993;72:394. doi: 10.1111/j.1600-0773.1993.tb01351.x. [DOI] [PubMed] [Google Scholar]
- 14.(a) Beedie SL, Rore HM, Barnett S, Chau CH, Luo W, Greig NH, Figg WD, Vargesson N. Oncotarget. 2016;7(22):33237. doi: 10.18632/oncotarget.8909. [DOI] [PMC free article] [PubMed] [Google Scholar]; (b) Mahony C, Erskine L, Niven J, Greig NH, Figg WD, Vargesson N. Proc. Natl. Acad. Sci. USA. 2013;110:12703. doi: 10.1073/pnas.1307684110. [DOI] [PMC free article] [PubMed] [Google Scholar]; (c) Horvat M, Uzelac L, Marjanovic M, Cindro N, Frankovic O, Mlinaric-Majerski K, Kralj M, Basaric N. Chem. Biol. Drug Des. 2012;79:497. doi: 10.1111/j.1747-0285.2011.01305.x. [DOI] [PubMed] [Google Scholar]; (d) Aragon-Ching JB, Li H, Gardner ER, Figg WD. Recent Pat. Anticancer Drug Discov. 2007;2:167. doi: 10.2174/157489207780832478. [DOI] [PMC free article] [PubMed] [Google Scholar]
- 15.Mateo A, Pilar S, Carmen L, Angel A. J. Org. Chem. 2005;70:7617. [Google Scholar]
- 16.Hay JV. 4,678,500 A. US. 1987
- 17.Tweedie D, Frankola KA, Luo W, Li Y, Greig NH. The Open Biochemistry Journal. 2011;5:37. doi: 10.2174/1874091X01105010037. [DOI] [PMC free article] [PubMed] [Google Scholar]
- 18.We have previously studied the effects of known TNF-α inhibitor Lenalidomide, a phthalimidine-based analog of Thalidomide that is marketed under the name Revlimid. Under similar assay conditions to those detailed in this manuscript, Lenalidomide demonstrates TNF activity at 109% ± 10 of the control while maintaining cell viability of 106% ± 3. The primary experiments and data can be accessed in: Luo W, Yu Q, Salcedo I, Holloway HW, Lahiri DK, Brossi A, Tweedie D, Greig NH. Bioorg. Med. Chem. 2011;19:3965. doi: 10.1016/j.bmc.2011.05.029.
- 19.(a) Beedie SL, Peer CJ, Pisle S, Gardner ER, Mahony C, Barnett S, Ambrozak A, Gutschow M, Chau CH, Vargesson N, Figg WD. Mol. Cancer Ther. 2015;14:2228. doi: 10.1158/1535-7163.MCT-15-0320. [DOI] [PMC free article] [PubMed] [Google Scholar]; (b) Therapontos C, Erskine L, Gardner ER, Figg WD, Vargesson N. Proc. Natl. Acad. Sci. USA. 2009;106:8573. doi: 10.1073/pnas.0901505106. [DOI] [PMC free article] [PubMed] [Google Scholar]; (c) Beedie SL, Diamond AJ, Fraga LR, Figg WD, Vargesson N. Reprod. Toxicol. 2017;70:49. doi: 10.1016/j.reprotox.2016.11.013. [DOI] [PMC free article] [PubMed] [Google Scholar]; (d) Lawson ND, Weinstein BM. Developmental Biology. 2002;248:307. doi: 10.1006/dbio.2002.0711. [DOI] [PubMed] [Google Scholar]; (e) Chimote G, Sreenivasan J, Pawar N, Subramanian J, Sivaramakrishnan H, Sharma S. Drug Des. Devel. Ther. 2014;8:1107. doi: 10.2147/DDDT.S55621. [DOI] [PMC free article] [PubMed] [Google Scholar]; (f) Serbedzija GN, Flynn E, Willet CE. Angiogenesis. 1999;3:353. doi: 10.1023/a:1026598300052. [DOI] [PubMed] [Google Scholar]
- 20.Snyder SH, Bredt DS. Sci Am. 1992:68. doi: 10.1038/scientificamerican0592-68. [DOI] [PubMed] [Google Scholar]
- 21.Horvat M, Görner H, Warzecha K, Neudörfl J, Griesbeck AG, Mlinaric-Majerski K, Basaric N. J. Org. Chem. 2009;74:8219. doi: 10.1021/jo901753z. [DOI] [PubMed] [Google Scholar]
- 22.Bagrii EI, Saginaev AT. Russ. Chem. Rev. 1983;52:1538. [Google Scholar]
Associated Data
This section collects any data citations, data availability statements, or supplementary materials included in this article.


