

Abstract
Autophagy begins with the formation of autophagosomes, a process that depends on the activity of the serine/threonine kinase ULK1 (hATG1). Although earlier studies indicated that ULK1 activity is regulated by dynamic polyubiquitination, the deubiquitinase involved in the regulation of ULK1 remained unknown. In this study, we demonstrate that ubiquitin‐specific protease 20 (USP20) acts as a positive regulator of autophagy initiation through stabilizing ULK1. At basal state, USP20 binds to and stabilizes ULK1 by removing the ubiquitin moiety, thereby interfering with the lysosomal degradation of ULK1. The stabilization of basal ULK1 protein levels is required for the initiation of starvation‐induced autophagy, since the depletion of USP20 by RNA interference inhibits LC3 puncta formation, a marker of autophagic flux. At later stages of autophagy, USP20 dissociates from ULK1, resulting in enhanced ULK1 degradation and apoptosis. Taken together, our findings provide the first evidence that USP20 plays a crucial role in autophagy initiation by maintaining the basal expression level of ULK1.
Keywords: autophagy, deubiquitinase, lysosomal degradation, ULK1, USP20
Subject Categories: Autophagy & Cell Death; Post-translational Modifications, Proteolysis & Proteomics
Introduction
Macroautophagy, hereafter referred as autophagy, is a cellular degradation process that recycles macromolecules or dysfunctional organelles into amino acids, sugars, and lipids 1, 2. This intrinsic function allows autophagy to be recognized as a pathway important to maintaining cellular homeostasis. Moreover, a large body of evidence indicates that autophagy can also be activated upon stress conditions, including nutrient starvation or energy depletion 3, 4.
Extensive studies have revealed the molecular mechanisms underlying the autophagy process. As autophagy is initiated, autophagy‐related (ATG) proteins are recruited into a membrane structure called the phagophore 5, 6. As the phagophore expands and fuses upon itself, a double‐membrane vesicle, called the autophagosome, is created and encloses the cargo to be degraded 7, 8. The autophagosome eventually fuses with the lysosome, which degrades the captured materials and subsequently releases the degraded products into the cytosol 9. Genetic and biochemical studies have identified the ATG gene products, which mediate all steps of autophagy flux, and non‐ATG proteins, which are involved in the regulation of autophagy 10. Among these genes, Unc51‐like kinase 1 (ULK1), the homolog of ATG1 in yeast, has serine/threonine protein kinase activity and is considered a key protein for the regulation of autophagy initiation 11. ULK1 forms a stable complex with ATG13, ATG101, and FIP200 which is the mammalian ortholog of ATG17 12, 13, 14, 15. Interestingly, post‐translational modifications of ULK1, including phosphorylation and ubiquitination, were found to be critical for autophagy induction. For example, the kinase activity of ULK1 is regulated by the non‐autophagic proteins, mammalian target of rapamycin complex 1 (mTORC1) and AMP‐activated protein kinase (AMPK) 16, 17. Under nutrient‐rich conditions, mTORC1 binds to ULK1 and maintains the inactivated state of ULK1 through phosphorylating specific residues. mTORC1 dissociates from ULK1 upon nutrient depletion and the phosphorylated residues of ULK1 are dephosphorylated. These modifications lead to the activation of ULK1, resulting in the initiation of autophagy 18, 19, 20. The AMPK pathway, acting as a cellular energy sensor, has been known to be important in regulating autophagy initiation. AMPK directly activates the ULK1 kinase through phosphorylating ULK1 on specific serine residues, which eventually leads to autophagy induction 21, 22.
ULK1 ubiquitination has also recently garnered much interest. The AMBRA1–TRAF6 axis was found to facilitate Lys63 (K63)‐linked ubiquitination of ULK1 to support the stabilization and activity of ULK1 23. In addition, depletion of p32, a chaperon‐like protein, was reported to potentiate Lys48 (K48)‐linked ubiquitination of ULK1 and impair K63‐linked ubiquitination of ULK1, suggesting that p32 functions as a key regulator of ULK1 stability 24. Although these findings emphasize the importance of ubiquitination‐mediated modifications of ULK1 in autophagic initiation, much is still unknown regarding the overall mechanisms of ULK1 regulation through modulating ubiquitination. In particular, the deubiquitinases (DUBs) that remove ubiquitin moieties from ULK1 are incompletely understood, compared to the E3 ligases that act on ULK1. Experiments using the DUB inhibitor WP1130 have raised speculation that specific DUBs may regulate autophagy 25. That is, WP1130 treatment led to increased ULK1 ubiquitination, inhibited ULK1 activity, and subsequently blocked the autophagic flux. These experiments suggest the possibility that ULK1 may be regulated by the reciprocal modulation of deubiquitination and ubiquitination. Therefore, identification of specific DUBs regulating ULK1 should help demonstrate the mechanisms of autophagy initiation through deubiquitination as well as ubiquitination of ULK1.
In this study, we screened for DUBs which specifically regulate ULK1 expression by using siRNA libraries targeting 99 human DUBs. We finally identified ubiquitin‐specific peptidase 20 (USP20) as a participant in autophagy initiation through stabilizing and maintaining ULK1 at basal levels. Furthermore, we provide experimental evidence that dissociation of USP20 from ULK1 is an important step that induces the shift from autophagy to apoptosis when external stress is continuously prolonged.
Results
USP20 is required for the regulation of ULK1 stability
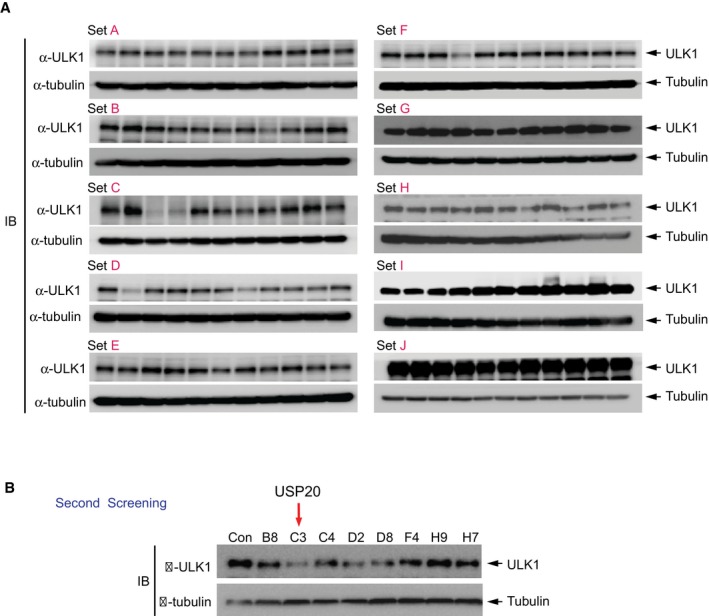
To identify DUBs involved in the regulation of ULK1 expression, we performed a loss‐of‐function screen of DUBs in HeLa cells using siRNA libraries targeting 99 DUBs. Consecutive screenings identified the deubiquitinating enzyme USP20 as a candidate protein (Figs 1A and EV1). Because USP20 depletion significantly decreased the basal expression levels of ULK1 in HeLa cells, we next examined the expression levels of ULK1 in different cell lines such as HEK293T, HeLa, HCT116, and HT29 cells, in the presence or absence of USP20 (Fig 1B). Following knockdown of USP20 expression by two independent USP20‐specific siRNAs in each cell line, the basal levels of ULK1 expression were examined by immunoblot analysis. Silencing of USP20 expression significantly reduced ULK1 expression levels in all examined cell lines (Fig 1B). However, USP20 depletion did not affect the expression levels of ATG13 and FIP200, which are essential components of the ULK1 complex in autophagy (Fig 1B). In addition, ectopic expression of siRNA‐resistant wild‐type USP20 restored the expression levels of ULK1, whereas the catalytically inactive (CI) mutant of USP20 with impaired deubiquitinase activity did not (Fig 1C). The cysteine 154 and histidine 643 residues responsible for the deubiquitinase activity of a wild‐type USP20 were, respectively, substituted with serine and glutamine in the catalytically inactive (CI) mutant of USP20 26. These results suggest that USP20 may specifically target ULK1.
Figure 1. USP20 stabilizes ULK1 in multiple cell lines.
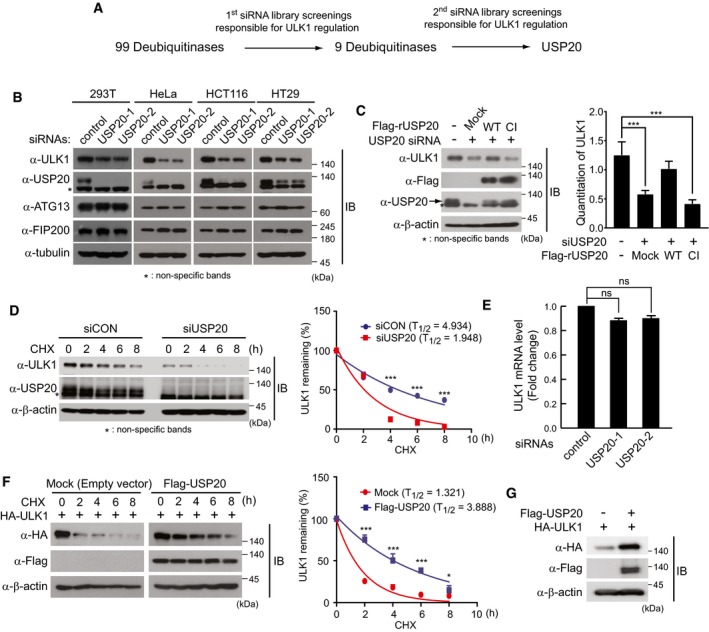
- The scheme of the screen to identify deubiquitinating enzymes (DUBs) regulating ULK1 stability.
- Multiple cell lines (293T, HeLa, HCT116, and HT29) were reverse‐transfected with 20 nM control siRNA (siCON) or two independent USP20‐specific siRNAs (siUSP20‐1 and siUSP20‐2). After 24 h, total cell lysates were immunoblotted with indicated antibodies.
- USP20‐knockdown HeLa cells were transfected with a plasmid encoding a USP20‐specific siRNA‐resistant wild‐type USP20 gene (Flag‐rUSP20‐WT), catalytically inactive (CI) mutant of USP20 (Flag‐rUSP20‐CI), or empty vector (Mock), respectively. Total cell lysates (TCL) were immunoblotted with anti‐ULK1 and anti‐USP20 antibodies. Control siRNA (siCON) was used as a negative control for USP20 depletion. ULK1 levels were quantified using ImageJ software (right). For normalization, β‐actin expression was used as a control. The data were statistically analyzed by one‐way ANOVA followed by Dunnett's multiple comparison test (***P < 0.001 compared to control, n = 3). The bars represent the mean ± SD.
- HeLa cells were reverse‐transfected with 20 nM control siRNA (siCON) or USP20‐specific siRNA (siUSP20‐1). After 24 h, cells were subsequently treated with 10 μM cycloheximide (CHX) at the indicated time points. Endogenous levels of ULK1 and USP20 protein were measured by immunoblotting with the indicated antibodies (left). ULK1 levels were quantified using ImageJ software (right). For normalization, β‐actin expression was used as a control. The data were statistically analyzed by two‐way ANOVA followed by Bonferroni's multiple comparison test (***P < 0.001 compared to siUSP20, n = 3). The bars represent the mean ± SD.
- ULK1 mRNA levels were measured using quantitative real‐time RT–PCR (qRT–PCR) with ULK1‐specific primers in USP20‐knockdown HeLa cells. ULK1 mRNA levels were normalized to β‐actin mRNA. The data were statistically analyzed by one‐way ANOVA followed by Dunnett's multiple comparison test (n = 3; ns, not significant). The bars represent the mean ± SD.
- A plasmid encoding HA‐ULK1 was co‐transfected into HeLa cells with an empty vector or Flag‐USP20. Cells were treated with 10 μM CHX for the indicated time points. Total cell lysates were immunoblotted with the indicated antibodies (left). The levels of HA‐ULK1 were quantified using ImageJ software (right). For normalization, β‐actin expression was used as a control. The data were statistically analyzed by two‐way ANOVA followed by Bonferroni's multiple comparison test (*P < 0.05, ***P < 0.001 compared to mock, n = 3). The bars represent the mean ± SD.
- HeLa cells were transfected with HA‐ULK1 alone or co‐transfected with HA‐ULK1 and Flag‐USP20. After 24 h, the protein levels of overexpressed ULK1 and USP20 were measured by immunoblotting.
Figure EV1. Screening of the deubiquitinases (DUBs) involved in the regulation of ULK1 expression by siRNA libraries targeting 99 human DUBs in HeLa cells.
-
A, BHeLa cells were reverse‐transfected by siRNAs, and the expression of ULK1 was monitored by immunoblot analysis through the first screening (A) and the second screening (B). Expression of α‐tubulin was used as a loading control.
Next, we examined whether USP20 directly regulates ULK1 protein levels by measuring the stability of ULK1 protein in USP20‐knockdown and control HeLa cells upon treatment of the protein synthesis inhibitor cycloheximide (CHX). The half‐life of ULK1 protein, together with the basal level of ULK1, was markedly reduced in USP20‐depleted cells, compared to control HeLa cells (Figs 1D and EV2). When we tested whether USP20 regulates the expression of ULK1 mRNA at the transcriptional level, quantitative real‐time RT–PCR analysis indicated that ULK1 mRNA level was unchanged in USP20‐knockdown HeLa cells compared to control cells expressing scrambled siRNAs (siCON; Fig 1E). These results indicate that USP20 is involved in the regulation of ULK1 protein stability, but not ULK1 mRNA levels. Consistently, USP20 overexpression in HeLa cells increased the half‐life of ULK1 protein in the presence of CHX (Fig 1F). Furthermore, immunoblot analysis indicated that ectopic expression of USP20 further increased the expression of ULK1, compared to cells lacking USP20 expression (Fig 1G). Based on these findings, our present results strongly suggest that USP20 is a DUB involved in the regulation of ULK1 protein stability.
Figure EV2. USP20 depletion reduces the stability of ULK1 protein.
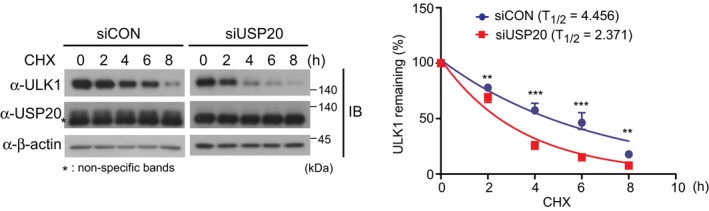
HeLa cells were reverse‐transfected with 20 nM control siRNA (siCON) or USP20‐specific siRNA (siUSP20‐1). After 24 h, cells were subsequently treated with 10 μM cycloheximide (CHX) for the indicated time points. To address the decreased stability of ULK1 in USP20‐depleted cells, we adjusted the amount of starting materials and endogenous levels of ULK1 and USP20 protein were measured by immunoblotting with the indicated antibodies (left). ULK1 levels were quantified using ImageJ software (right). For normalization, expression of non‐specific bands below the USP20 was used as a control. The data were statistically analyzed by two‐way ANOVA followed by Bonferroni's multiple comparison test (**P < 0.01, ***P < 0.001 compared to siUSP20, n = 3). The bars represent the mean ± SD. The result in this figure is representative of three independent experiments.Source data are available online for this figure.
USP20 specifically binds to ULK1
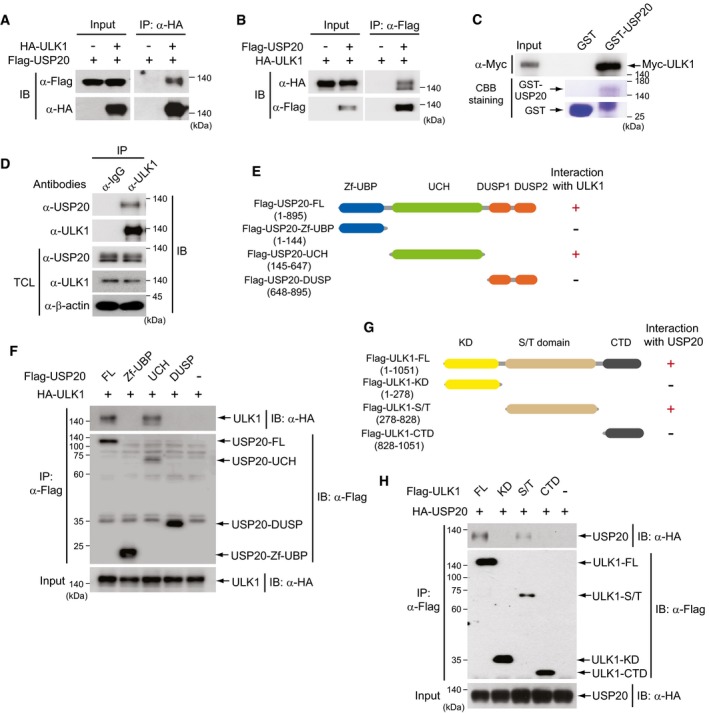
Since USP20 is required for ULK1 stability, we examined whether USP20 directly interacts with ULK1. Plasmids encoding Flag‐USP20 or HA‐ULK1 were transfected into HeLa cells in the indicated combinations, and a co‐immunoprecipitation assay using antibodies against HA or Flag was performed. The results in this overexpression system indicated that USP20 binds to the ULK1 (Fig 2A and B). In vitro GST pull‐down assay also provided support that USP20 directly binds to ULK1 (Fig 2C). In addition, an immunoprecipitation assay using antibody against endogenous ULK1 showed the endogenous interactions between USP20 and ULK1 (Fig 2D).
Figure 2. USP20 interacts with ULK1.
-
A, BPlasmids encoding Flag‐USP20 were co‐transfected into HeLa cells with HA‐tagged ULK1 plasmid. Cell lysates were immunoprecipitated (IP) with anti‐HA or anti‐Flag antibodies and subsequently immunoblotted (IB) with anti‐Flag or anti‐HA antibodies.
-
CGST pull‐down assay was performed with in vitro translated Myc‐ULK1, GST, and GST‐USP20 proteins. Immunoblot analysis was performed with anti‐Myc antibody. Expressions of GST and GST‐USP20 proteins were confirmed by Coomassie Brilliant Blue (CBB) staining.
-
DCell lysates of HeLa cells were immunoprecipitated (IP) with anti‐ULK1 antibody and subsequently immunoblotted (IB) with anti‐USP20 antibody. Expression of β‐actin was used as a loading control. TCL, total cell lysates.
-
ESchematic representation of USP20 deletion mutants.
-
FA plasmid encoding full‐length HA‐ULK1 was co‐transfected into HeLa cells with full‐length (FL) Flag‐USP20 or USP20 deletion mutant plasmids (Zf‐UBP, UCH, and DUSP). Cell lysates were immunoprecipitated using anti‐Flag antibody and subsequently immunoblotted with anti‐HA antibody.
-
GSchematic representation of ULK1 deletion mutants.
-
HA plasmid encoding full‐length HA‐USP20 was co‐transfected into HeLa cells with full‐length (FL) Flag‐ULK1 or ULK1 deletion mutant plasmids (KD, S/T, and CTD). Cell lysates were immunoprecipitated using anti‐Flag antibody and subsequently immunoblotted with HA antibody.
We next investigated which domains of USP20 participate in the interaction with ULK1. USP20 contains three important domains: the Zf‐UBP, UCH, and DUSP domains. Three truncated mutants of USP20, Flag‐USP20‐Zf‐UBP, Flag‐USP20‐UCH, and Flag‐USP20‐DUSP (Fig 2E), were transiently transfected into HeLa cells with full‐length ULK1 (HA‐ULK1‐FL). Co‐immunoprecipitation assays revealed that the USP20‐UCH domain (amino acids 145–647) binds to ULK1 (Fig 2F). Also, co‐immunoprecipitation assays using three truncated mutants of ULK1 and full‐length USP20 indicated that the S/T domain of ULK1 is required for the interaction with USP20 (Fig 2G and H). These results indicate that USP20 directly binds to ULK1 through interaction between distinct domains.
USP20 is essential for autophagy induction
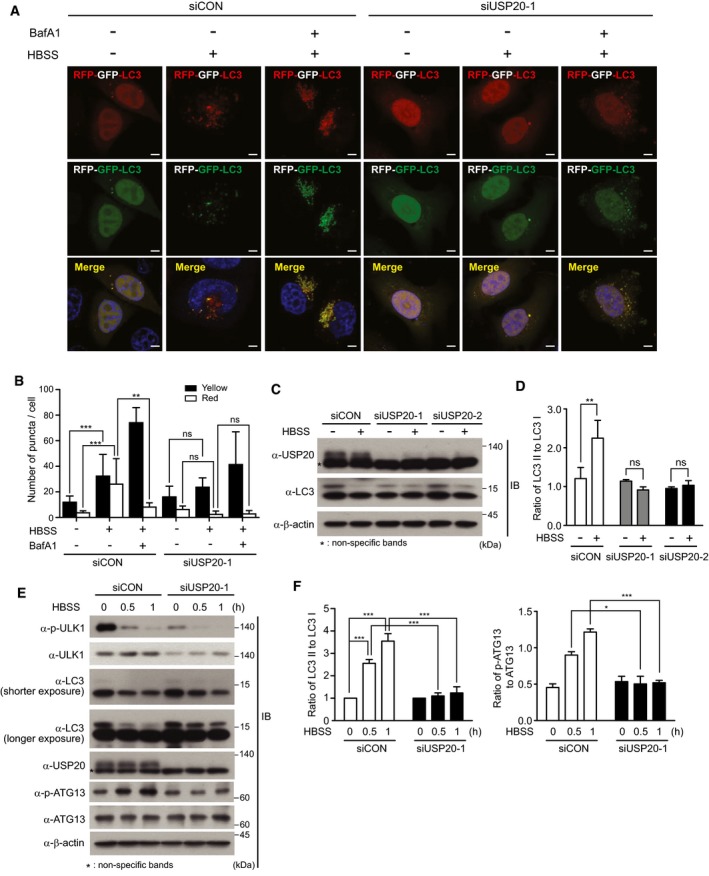
Because USP20 regulates the stability of ULK1 through direct interaction, we next examined whether USP20 is involved in the autophagy pathway. To this end, we examined autophagic flux using a GFP‐RFP‐LC3 expression strategy 27. GFP‐RFP‐LC3‐expressing HeLa cells under starvation with Hank's balanced salt solution (HBSS) increased the number of yellow and red puncta per cell, while most of the LC3 puncta emitted yellow (red and green) fluorescence in cells treated with bafilomycin A1 (BafA1), an inhibitor of autolysosomal fusion (Figs 3A and B, and EV3). USP20 depletion significantly reduced formation of yellow and red LC3 puncta under nutrient starvation condition (Fig 3A and B), indicating that USP20 is a positive regulator of starvation‐induced autophagy at an early step and is not involved in blocking degradation of autophagosomes at later steps.
Figure 3. USP20 is important for autophagy induction.
-
AEither control HeLa cells or USP20‐depleted cells expressing a GFP‐RFP‐LC3 plasmid were incubated with HBSS alone for 8 h or in combination with bafilomycin A1 (BafA1). Images of LC3 puncta containing green and red fluorescence were obtained with a confocal fluorescent microscope at an excitation wavelength of 488 nm and 543 nm, respectively. Scale bar, 5 μm.
-
BThe number of LC3 puncta was counted in five different arbitrary areas from three independent experiments. Data are presented as the mean ± SEM. Data were analyzed by two‐way analysis of variance (ANOVA) followed by Bonferroni's multiple comparison test (**P < 0.01, ***P < 0.001 compared to the indicated points; ns, not significant; n = 3).
-
C, DHeLa cells were reverse‐transfected with two independent USP20‐specific siRNAs or control siRNA for 24 h. Cells were starved with HBSS medium for 1 h. LC3 and USP20 proteins were observed by immunoblotting with the indicated antibodies (C). The ratio of LC3II to LC3I was quantified using ImageJ software (D). For normalization, β‐actin expression was used as a control. The data were statistically analyzed by two‐way ANOVA followed by Sidak's multiple comparison test (**P < 0.01 compared to the indicated points; ns, not significant; n = 3). The bars represent the mean ± SD.
-
E, FHeLa cells were reverse‐transfected with USP20‐specific siRNA or control siRNA for 24 h. After transfection, cells were starved with HBSS medium for the indicated times. Cell lysates were immunoblotted with the indicated antibodies (E). The ratios of LC3II to LC3I and phospho‐ATG13 to total ATG13 were quantified using ImageJ software (F). For normalization, β‐actin expression was used as a control. The data were statistically analyzed by two‐way ANOVA followed by Sidak's multiple comparison test (*P < 0.05, ***P < 0.001 compared to the indicated points, n = 3). The bars represent the mean ± SD.
Figure EV3. USP20 is required for autophagy induction.
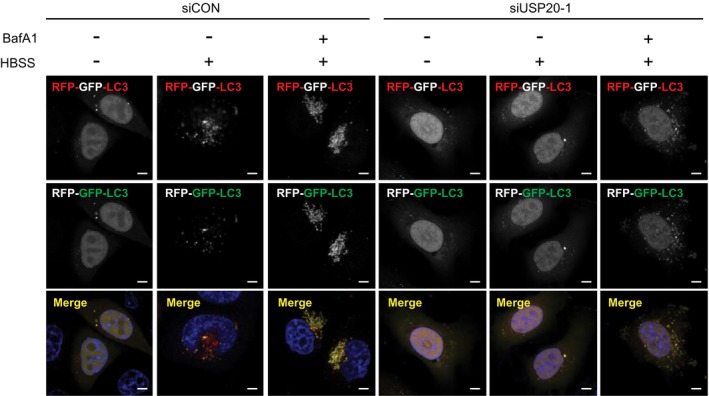
Either control HeLa cells or USP20‐depleted cells expressing a GFP‐RFP‐LC3 plasmid were incubated with HBSS alone for 8 h or in combination with bafilomycin A1 (BafA1). Individual channels of LC3 puncta containing green and red fluorescence shown in Fig 3A were converted to images in grayscale. Scale bar, 5 μm.
To further understand the role of USP20 in autophagy induction, we next examined the LC3II‐to‐LC3I ratio during starvation in USP20‐depleted HeLa cells. Whereas the LC3II‐to‐LC3I ratio in control HeLa cells was significantly increased for the indicated times under nutrient starvation, HBSS‐induced augmentation of the LC3II‐to‐LC3I ratio was not observed in USP20‐depleted cells (Fig 3C–F), suggesting that USP20 is required for autophagy induction. Furthermore, we investigated the phosphorylation of ULK1 and ATG13 proteins during starvation in USP20‐depleted HeLa cells. In nutrient‐rich conditions, mTORC1 constitutively inhibits ULK1 activity through phosphorylating the serine 758 residue of ULK1 19. In contrast, mTORC1 dissociates from ULK1 upon starvation, and thus, the inhibitory phosphorylation of the serine 758 residue is decreased. The ULK1 protein dissociated from mTORC1 phosphorylates itself as well as its substrate ATG13 during autophagy induction 15, 18. Immunoblot analysis indicated that ULK1 phosphorylation and its stability are markedly decreased in USP20‐depleted cells and ATG13 phosphorylation is not augmented in USP20‐depleted cells during starvation, compared to control HeLa cells (Fig 3E and F). The decreased phosphorylation of ULK1 and ATG13 seems to be due to the intrinsic instability of ULK1 by USP20 depletion. Therefore, our present results demonstrate that USP20 acts as a positive regulator of autophagy process through regulating the stability of ULK1.
However, the expression of p62 protein, an autophagic adaptor 28, was slightly decreased at the basal level without chloroquine (CQ) in USP20‐depleted HeLa cells, compared to control cells (Fig EV4A and B). Whereas p62 expression was significantly decreased in control HeLa cells under nutrient starvation, the decreased expression of p62 was not augmented in USP20‐depleted cells under starvation (Fig EV4C and D), considering to the decreased ratio of LC3II to LC3I (Fig 3C). Although we do not know the exact mechanism for the slight decrease in p62 at the basal state and unexpected p62 expression under starvation in USP20‐depleted HeLa cells, it may be worth investigating a role of USP20 in the regulation of p62 expression.
Figure EV4. Decreased expression of p62 protein in USP20‐knockdown cells under nutrient starvation.
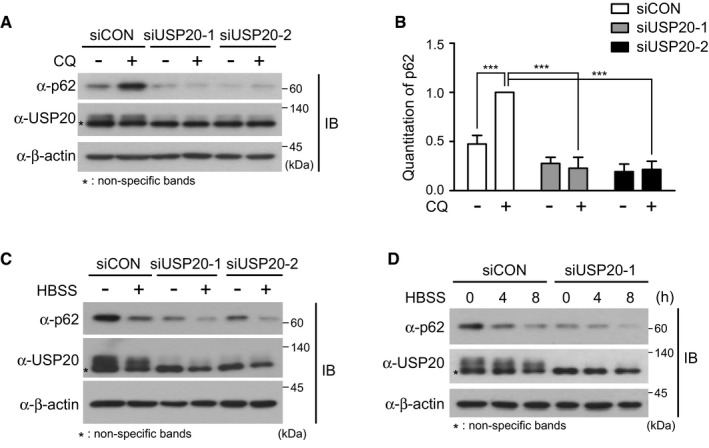
- HeLa cells were reverse‐transfected with two independent USP20‐specific siRNAs or control siRNA for 24 h. After cells were treated with 50 μM chloroquine (CQ) for 1 h, expressions of p62 and USP20 proteins were observed by immunoblotting with the indicated antibodies. β‐actin expression was used as a loading control.
- p62 levels were quantified using ImageJ software. For normalization, β‐actin expression was used as a control. The data were statistically analyzed by two‐way ANOVA followed by Sidak's multiple comparison test (***P < 0.001 compared to the indicated points, n = 3). The bars represent the mean ± SD.
- HeLa cells were reverse‐transfected with two independent USP20‐specific siRNAs or control siRNA for 24 h. Cells were starved with HBSS medium for 8 h. p62 and USP20 expressions were observed by immunoblotting with the indicated antibodies. β‐actin expression was used as a loading control.
- HeLa cells were reverse‐transfected with USP20‐specific siRNA or control siRNA for 24 h. After transfection, cells were starved with HBSS medium for the indicated times. Cell lysates were immunoblotted with the indicated antibodies. β‐actin expression was used as a loading control. All results in this figure are representative of three independent experiments.
Source data are available online for this figure.
USP20 regulates the ULK1 stability through deubiquitination of ULK1
Next, we further examined the importance of USP20 deubiquitinase activity in regulating ULK1 stability. After plasmids encoding Myc‐ULK1 and HA‐ubiquitin (HA‐Ub) were co‐transfected into HeLa cells together with wild‐type (WT) Flag‐USP20 or catalytically inactive mutant USP20 (Flag‐USP20‐CI) plasmids, immunoprecipitation and immunoblot analysis were performed with the indicated antibodies (Fig 4A). Wild‐type USP20 profoundly decreased the ubiquitination of ULK1, whereas the catalytically inactive mutant USP20 did not (Fig 4A). An in vitro deubiquitination assay also showed similar results (Fig 4B). To further understand the role of USP20‐mediated ULK1 deubiquitination in physiological conditions, we examined whether USP20 regulates the ubiquitination of endogenous ULK1 protein at the basal level. USP20‐depleted and control HeLa cells were immunoprecipitated with anti‐ULK1 antibody against endogenous ULK1 protein under 1% SDS denaturing conditions and immunoblotted with anti‐ubiquitin (Ub). USP20 depletion significantly increased the polyubiquitination of endogenous ULK1 protein (Fig 4C). Furthermore, overexpression of wild‐type USP20 increased the expression of ULK1, whereas expression of the catalytically inactive (CI) mutant form of USP20 did not (Fig 4D). These findings indicate that ULK1 is a target of the USP20 deubiquitinating enzyme and its stability is regulated by USP20.
Figure 4. Deubiquitinating activity of USP20 is important for preventing lysosomal degradation of ULK1.
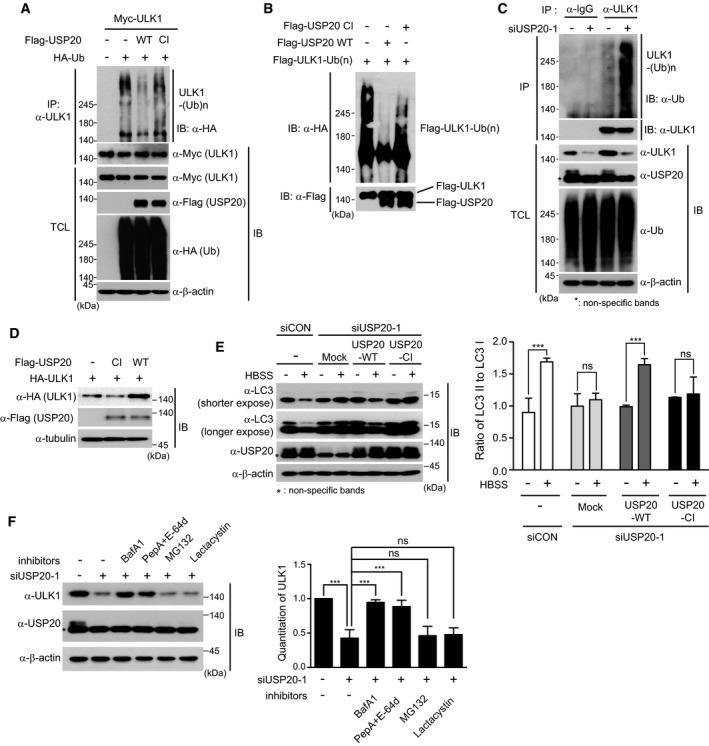
- Plasmids encoding a HA‐Ub plasmid were co‐transfected into HeLa cells together with a plasmid encoding wild‐type USP20 (Flag‐USP20‐WT) or a catalytically inactive mutant USP20 (Flag‐USP20‐CI). ULK1 ubiquitination was examined by immunoprecipitation (IP) using anti‐ULK1 antibody under denaturing conditions and immunoblotting (IB) with anti‐HA. Total cell lysates (TCL) were immunoblotted by the indicated antibodies. Expression of β‐actin was used as a loading control.
- For an in vitro deubiquitination assay, HA‐ubiquitin‐conjugated Flag‐ULK1 proteins were incubated with the eluted wild‐type Flag‐USP20 protein or catalytically inactive Flag‐USP20‐CI protein in the presence of ATP for 6 h. ULK1 ubiquitination was detected by using the anti‐HA antibody.
- For the ubiquitination assay of endogenous ULK1 protein, cell lysates obtained from USP20‐knockdown and control HeLa cells were immunoprecipitated with anti‐ULK1 antibody under 1% SDS denaturing conditions and subsequently immunoblotted with anti‐ubiquitin antibody. Total cell lysates were immunoblotted by the indicated antibodies. As a negative control, cell lysates were immunoprecipitated with anti‐IgG antibody. Expression of β‐actin was used as a loading control.
- A plasmid encoding HA‐ULK1 was co‐transfected into HeLa cells with wild‐type USP20 (Flag‐USP20‐WT) or the catalytically inactive form of USP20 (Flag‐USP20‐CI). After 24 h, expression of ULK1 and USP20 was detected by immunoblotting with the indicated antibodies. Expression of α‐tubulin was used as a loading control.
- HeLa cells were reverse‐transfected with control siRNA or USP20‐specific siRNA for 24 h. After USP20‐knockdown or control cells were transfected with a plasmid encoding a USP20‐specific siRNA‐resistant wild‐type USP20 gene (Flag‐USP20‐WT) or catalytically inactive (CI) mutant of USP20 (Flag‐USP20‐CI), cells were starved with HBSS for 1 h. Cell lysates were immunoblotted with the indicated antibodies. Expression of β‐actin was used as a loading control. The ratio of LC3II to LC3I was quantified using ImageJ software (right). For normalization, β‐actin expression was used as a control. The data were statistically analyzed by two‐way ANOVA followed by Sidak's multiple comparison test (***P < 0.001 compared to cells not incubated with HBSS; ns, not significant; n = 3). Mock, empty vector. The bars represent the mean ± SD.
- HeLa cells were reverse‐transfected with control siRNA or USP20‐specific siRNA for 24 h. Subsequently, cells were treated with 100 nM BafA1, 10 μg/ml PepA + 10 μg/ml E‐64d, 10 μM MG132, or 1 μM lactacystin for 12 h. Expressions of ULK1 and USP20 proteins were observed by immunoblotting with the indicated antibodies. Expression of β‐actin was used as a loading control. ULK1 levels were quantified using ImageJ software (right). For normalization, β‐actin expression was used as a control. The data were statistically analyzed by one‐way ANOVA followed by Dunnett's multiple comparison test (***P < 0.001 compared to control cells not treated with inhibitors, n = 3). The bars represent the mean ± SD.
Next, we performed rescue experiments to confirm whether the autophagy defect in USP20‐depleted HeLa cells under starvation can be restored by expression of siRNA‐resistant wild‐type (WT) USP20 or the catalytically inactive (CI) mutant of USP20. Expression of wild‐type USP20 restored the ratio of LC3II to LC3I in USP20‐depleted HeLa cells under starvation to that of HBSS‐treated control cells, whereas expression of the catalytically inactive (CI) form of USP20 did not (Fig 4E). These results indicate that the deubiquitinase activity of USP20 is required for starvation‐induced autophagy.
Since it is generally accepted that there are two pathways that control the degradation of cellular proteins in eukaryotes, proteasomal and lysosomal degradation, we next questioned which pathway is responsible for the degradation of ULK1. USP20 depletion caused reduced expression of ULK1 (Fig 4F), which was consistent with our previous finding (Fig 1C and D). Interestingly, this reduced expression of ULK1 upon USP20 depletion was rescued by treatment with the lysosomal inhibitors bafilomycin A1 and pepstatin A plus E‐64D, but not the proteasomal inhibitors MG132 and lactacystin (Fig 4F). Considering our present findings, it is likely that USP20 prevents lysosome‐dependent ULK1 degradation through ULK1 deubiquitination, and thus, the deubiquitinating activity of USP20 is critical for regulation of ULK1 stability.
USP20 dissociates from ULK1 at a later time after autophagy induction
To clearly demonstrate the molecular mechanisms of USP20 in autophagy induction, we first examined the expression of ULK1 under nutrient starvation. ULK1 expression decreased in a time‐dependent manner after HBSS‐mediated autophagy initiation, and this decrease was significantly blocked by the lysosomal inhibitor bafilomycin A1 (Fig 5A), indicating that ULK1 stability is gradually reduced after autophagy initiation. However, ULK1 degradation was still observed in ATG5 knockout (KO) mouse embryonic fibroblasts (MEFs), similar to wild‐type ATG5 MEFs (Fig 5B). To further clarify our observation that ULK1 is degraded in ATG5 KO MEFs, we examined the expression of ULK1 at 8‐h post‐starvation in the absence or presence of BafA1 and MG132 in wild‐type ATG5 and ATG5 KO MEFs. In wild‐type ATG5 MEFs, ULK1 degradation at 8 h was inhibited by the lysosomal inhibitor BafA1, but not the proteasome inhibitor MG132 (Fig 5C, lanes 2 and 4). In contrast, the decreased level of ULK1 observed at 8 h in ATG5 KO MEFs was restored by MG132, but not BafA1 (Fig 5C, lanes 6 and 7). These results indicate that ULK1 degradation is largely mediated by the lysosome‐dependent pathway in normal MEFs, whereas ULK1 degradation is mainly mediated by the proteasome‐dependent pathway in autophagy‐deficient contexts such as ATG5 KO MEFs. That is, under autophagy‐deficient condition, ULK1 is likely to be degraded through proteasome pathway to decrease ULK1 levels.
Figure 5. Starvation induces dissociation of USP20–ULK1 interaction.
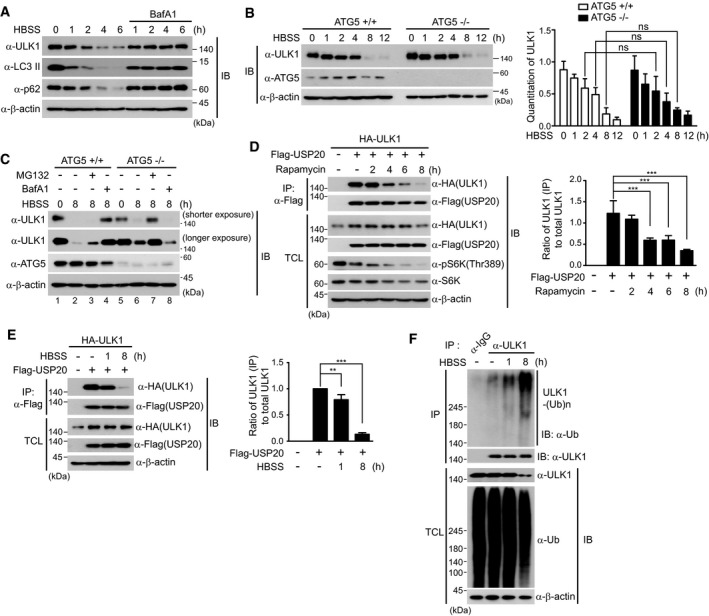
- HeLa cells were incubated in HBSS medium for the indicated times in the presence or absence of BafA1 (100 nM). Total cell lysates (TCL) were immunoblotted by the indicated antibodies.
- ATG5 KO (−/−) and WT (+/+) MEFs were incubated in HBSS medium for the indicated times. Total cell lysates (TCL) were immunoblotted by the indicated antibodies. ULK1 levels were quantified using ImageJ software (right). For normalization, β‐actin expression was used as a control. The data were statistically analyzed by two‐way ANOVA followed by Sidak's multiple comparison test (ns, not significant; n = 3). The bars represent the mean ± SD.
- ATG5 KO (−/−) and WT (+/+) MEFs were initially incubated in HBSS medium for 4 h and subsequently treated with 100 nM BafA1 and 10 μM MG132, respectively. After cells were further incubated in HBSS for 4 h, total cell lysates were immunoblotted by the indicated antibodies. The data are representative of three independent experiments.
- HeLa cells were co‐transfected with HA‐ULK1 and wild‐type Flag‐USP20. Cells were treated with rapamycin (200 nM) for the indicated times. Cell lysates were immunoprecipitated with anti‐Flag antibody and subsequently immunoblotted with the indicated antibodies. The ratio of immunoprecipitated (IP) ULK1 to total ULK1 levels was quantified using ImageJ software (right). For normalization, β‐actin expression was used as a control. The data were statistically analyzed by one‐way ANOVA followed by Dunnett's multiple comparisons test (***P < 0.001 compared to control cells not treated with rapamycin, n = 3). The bars represent the mean ± SD.
- After the plasmid encoding HA‐ULK1 was co‐transfected into HeLa cells with wild‐type Flag‐USP20, cells were starved in HBSS medium for the indicated times. Cell lysates were immunoprecipitated with anti‐Flag antibody and subsequently immunoblotted with the indicated antibodies. The ratio of immunoprecipitated (IP) ULK1 to total ULK1 levels was quantified using ImageJ software (right). For normalization, β‐actin expression was used as a control. The data were statistically analyzed by one‐way ANOVA followed by Dunnett's multiple comparisons test (**P < 0.01, ***P < 0.001 compared to control cells not incubated with HBSS, n = 3). The bars represent the mean ± SD.
- For the ubiquitination assay of endogenous ULK1 protein under starvation condition, cells were starved in HBSS medium for the indicated times and cell lysates were immunoprecipitated with anti‐ULK1 antibody under 1% SDS denaturing conditions and subsequently immunoblotted with anti‐ubiquitin antibody. Total cell lysates were immunoblotted by the indicated antibodies. As a negative control, cell lysates were immunoprecipitated with anti‐IgG antibody. Expression of β‐actin was used as a loading control in all immunoblot assays.
These findings led us to investigate the dynamics of ULK1–USP20 interaction during autophagy induction. Therefore, we examined time‐dependent formation of the USP20–ULK1 complex. After HeLa cells were co‐transfected with Flag‐USP20 and HA‐ULK1 and subsequently treated with the mTOR inhibitor rapamycin during the indicated time, we performed co‐immunoprecipitation assays to detect the USP20–ULK1 complex (Fig 5D). USP20 bound to ULK1 at steady state before autophagy initiation, and dissociation of USP20–ULK1 complex was detected starting from 4 h post‐rapamycin treatment, nearly disappearing at 8 h post‐treatment (Fig 5D). Furthermore, co‐immunoprecipitation assays at 8 h after HBSS‐mediated starvation indicated that USP20 dissociates from ULK1 at a later time after autophagy initiation (Fig 5E). Consistent with the dissociation of USP20 from ULK1 at 8 h post‐starvation, ubiquitination of endogenous ULK1 protein was significantly increased at 8 h, resulting in the degradation of ULK1 (Fig 5F). These findings imply that USP20 stabilizes the ULK1 protein through binding to ULK1 at the basal level and thus prevents degradation of ULK1. Thus, it is likely that maintenance of the stable ULK1–USP20 complex may be crucial for maintaining the ULK1 protein at a basal level, and the dissociation of this complex following initiation of autophagy may contribute to the transition toward the next steps of autophagy.
ULK1 is localized to lysosomes through the ubiquitination of its carboxy terminal domain
The present finding that USP20 prevented the lysosomal degradation of ULK1 (Fig 4F) prompted us to clarify the association of ULK1 with lysosomes, because recent papers reported that ULK1 is degraded by the proteasome‐dependent pathway 29, 30. To this end, we initially examined the ubiquitination of the ULK1 domains shown in Fig 2G. Ni‐NTA pull‐down assays indicated that the ULK1 CTD (carboxy terminal domain) is mainly ubiquitinated (Fig 6A), consistent with the previous finding that NEDD4L, a HECT domain‐containing E3 ubiquitin ligase, ubiquitinates two lysine residues within the CTD of ULK1 29.
Figure 6. ULK1 is localized into lysosomes under nutrient starvation condition.
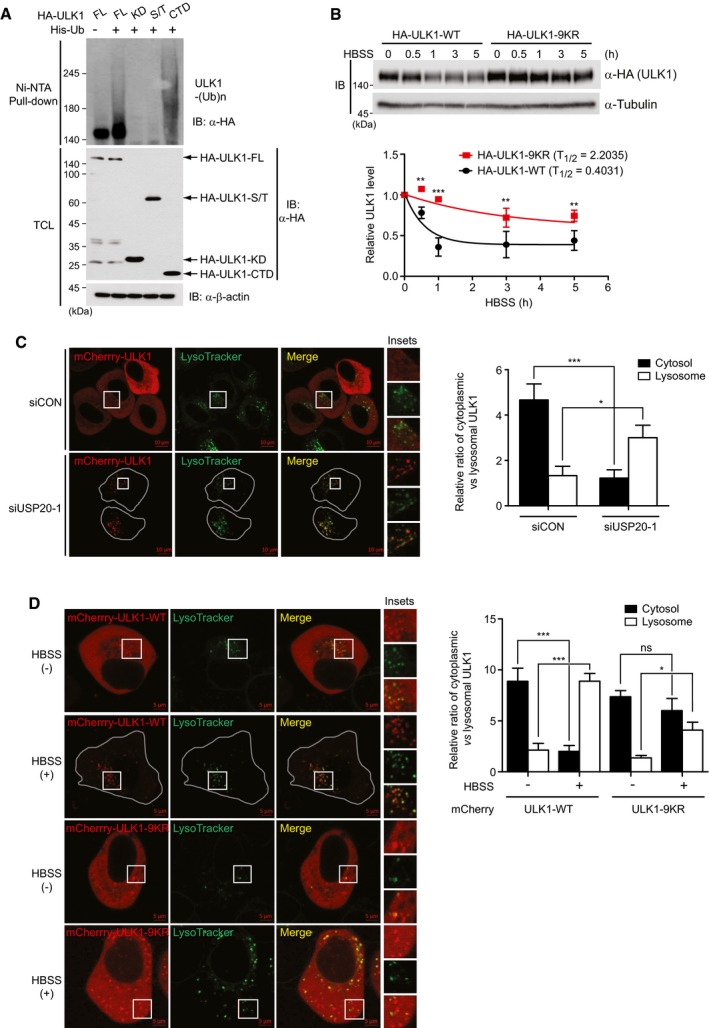
- Domain analysis for ULK1 ubiquitination. After wild‐type HA‐ULK1 and its deletion mutants were respectively transfected into HEK293T cells together with HA‐tagged ubiquitin (HA‐Ub), ubiquitinated ULK1 proteins were pulled down with Ni‐NTA column, followed by immunoblotting with anti‐HA antibody. Expression of β‐actin was used as a loading control.
- After either wild‐type HA‐ULK1‐WT or HA‐ULK1‐9KR mutant was transfected into HeLa cells, cells were left untreated or incubated with HBSS. Cells were harvested at the indicated time points, and immunoblot analysis was performed by anti‐HA antibody. The levels of HA‐ULK1 protein were quantified using ImageJ software (bottom). For normalization, α‐tubulin expression was used as a control. The data were statistically analyzed by two‐way ANOVA followed by Bonferroni's multiple comparison test (**P < 0.01, ***P < 0.001 compared to HA‐ULK1‐WT, n = 3).
- mCherry‐ULK1 was transfected into either siCON‐expressing or USP20‐specific siRNA‐expressing HeLa cells, and LysoTracker Green probe was incubated for 5 min before taking fluorescence images. Scale bar, 10 μm.
- Either wild‐type mCherry‐ULK1‐WT or mCherry‐ULK1‐9KR plasmid was transfected into HeLa cells, and cells were either untreated or incubated with HBSS for 8 h. LysoTracker probe was incubated for 5 min before taking fluorescence images. Scale bar, 5 μm.
To confirm whether ubiquitination of the CTD of ULK1 affects the stabilization of ULK1 and the localization of ULK1 into lysosomes, we generated a ULK1‐9KR mutant in which all nine lysine residues within the CTD of ULK1 were substituted with arginines. Immunoblot analysis indicated that wild‐type HA‐ULK1 gradually decreased under nutrient starvation, whereas degradation of the ubiquitination‐defective HA‐ULK1‐9KR mutant was markedly impaired (Fig 6B).
Next, to demonstrate whether ULK1 localization into lysosomes is associated with its ubiquitination, we first examined the localization of wild‐type mCherry‐ULK1 together with LysoTracker Green probe under USP20 depletion. mCherry‐ULK1 was localized to the cytoplasm and lysosomes under normal condition (Fig 6C). Upon USP20 depletion, however, mCherry‐ULK1 localization shifted to the lysosomes where mCherry‐ULK1 colocalized with LysoTracker, suggesting that dissociation of ULK1 from USP20 induces the lysosomal localization of ULK1 (Fig 6C). Consistently, wild‐type mCherry‐ULK1 localization also shifted to the lysosomes under nutrient starvation condition (Fig 6D). On the other hand, the cytoplasmic localization of the mCherry‐ULK1‐9KR mutant was not changed, and mCherry‐ULK1‐9KR puncta did not colocalize with LysoTracker (Fig 6D). These results indicate that ubiquitination within the CTD of ULK1 protein is directly associated with lysosomal localization and involved in subsequent degradation of ULK1 under nutrient starvation condition.
USP20 is critical for cell survival under starvation
Autophagy prevents cell death by enhancing nutrient availability to cells during starvation. However, if starvation persists for a long time, autophagy cannot afford to maintain cell survival and cells thereby enter the death phase 31. Thus, blocking the autophagy process decreases resistance to starvation and lethal programs are rapidly activated. In this process, it is known that ULK1 is important for cell survival and ULK1 depletion promotes cell death under starvation conditions 24.
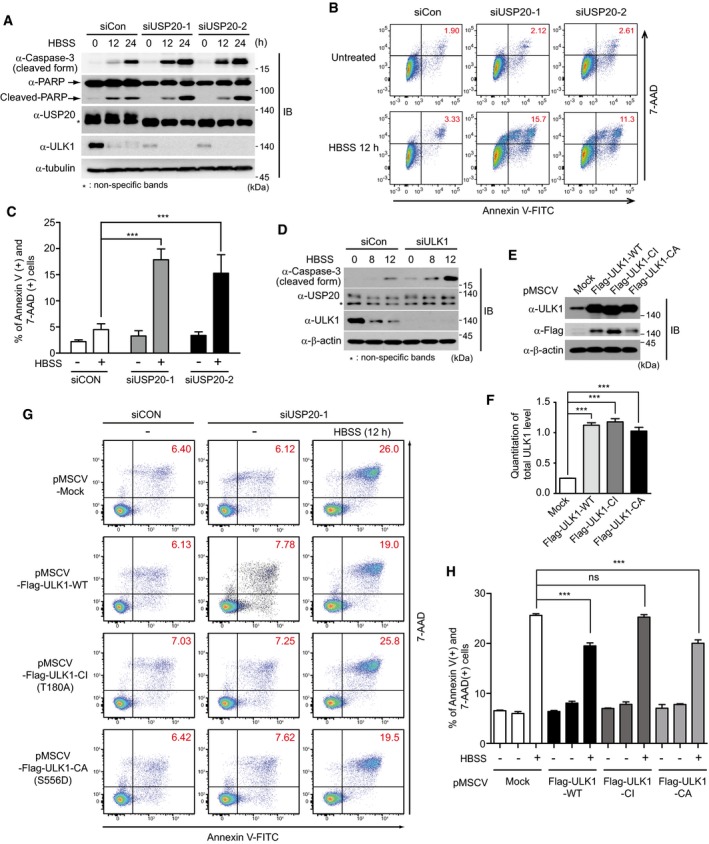
To confirm whether USP20 is required for autophagy‐mediated cell survival under prolonged starvation, we examined the levels of cleaved caspase‐3 and cleaved PARP, which are markers of apoptosis and cell death, in HBSS‐induced starvation conditions. Expressions of cleaved caspase‐3 and cleaved PARP were significantly increased in USP20‐depleted HeLa cells, compared to control cells during starvation with HBSS (Fig 7A). To further validate these phenomena, FACS analysis was performed by Annexin V and 7‐AAD staining in HeLa cells. As expected, apoptotic cell death under starvation was higher in USP20‐knockdown cells than in control cells (Fig 7B and C). These results indicate that USP20 is involved in starvation‐induced cell death through positively regulating the autophagic process.
Figure 7. USP20 depletion enhances starvation‐induced cell death.
-
AHeLa cells were reverse‐transfected with control siRNA or with two independent USP20‐specific siRNAs (USP20‐1 and USP20‐2). After cells were starved with HBSS medium for the indicated times, expression of caspase‐3, PARP, USP20, and ULK1 proteins were observed by immunoblotting with the indicated antibodies. Expression of α‐tubulin was used as a loading control.
-
B, CHeLa cells were reverse‐transfected with control siRNA or with USP20‐specific siRNAs for 24 h. Subsequently, cells were starved with HBSS medium for 12 h. Cells were immediately stained with Annexin V and 7‐AAD, followed by FACS analysis (B). The percentage of Annexin V‐positive/7‐AAD‐positive fraction was summarized in a bar graph (C). The data were statistically analyzed by two‐way ANOVA followed by Sidak's multiple comparison test (***P < 0.001 compared to control cells not incubated with HBSS, n = 3). The bars represent the mean ± SD.
-
DHeLa cells were reverse‐transfected with control siRNA or with ULK1‐specific siRNA for 24 h. Cells were subsequently starved with HBSS medium for the indicated time. Expression of caspase‐3, USP20, and ULK1 proteins was observed by immunoblotting with the indicated antibodies. Expression of β‐actin was used as a loading control.
-
E, FEstablishment of wild‐type Flag‐ULK1‐, catalytically inactive (CI) ULK1‐, and catalytically active (CA) ULK1‐overexpressing HeLa cell lines. HeLa cells stably expressing Flag‐ULK1‐WT, Flag‐ULK1‐CI, or Flag‐ULK1‐CA plasmids were immunoblotted by anti‐ULK1 and anti‐Flag antibodies, respectively (E). The ULK1 levels in these stable cells were quantified using ImageJ software (F). For normalization, β‐actin expression was used as a control. The data were statistically analyzed by one‐way ANOVA followed by Dunnett's multiple comparison test (***P < 0.001 compared to control cells expressing empty vector, n = 3). The bars represent the mean ± SD. Expression of β‐actin was used as a loading control. Mock, empty pMSCV vector.
-
G, HHeLa cells stably expressing Flag‐ULK1‐WT, Flag‐ULK1‐CI, or Flag‐ULK1‐CA were reverse‐transfected with control siRNA or with USP20‐specific siRNA for 24 h. Sequentially, cells were starved with HBSS medium for 12 h. Cells were immediately stained with Annexin V and 7‐AAD, followed by FACS analysis (G). The percentage of Annexin V‐positive and 7‐AAD‐positive fraction was summarized in a bar graph (H). The data were statistically analyzed by two‐way ANOVA followed by Sidak's multiple comparison test (***P < 0.001 compared to control cells incubated with HBSS; ns, not significant; n = 3). The bars represent the mean ± SD. Control cells stably express the empty vector, pMSCV‐Mock.
Next, we examined the interconnection between ULK1 and USP20 in starvation‐induced cell death. Cleaved caspase‐3 was increased in ULK1‐depleted HeLa cells in HBSS‐mediated starvation conditions, compared with control cell lines (Fig 7D). These results were similar to those of USP20‐depleted cells (Fig 7A). To confirm whether the increased cell death of HeLa cells upon USP20 depletion is caused by decrease in ULK1 stability, we established HeLa cell lines stably expressing wild‐type (WT), catalytically inactive (CI mutant; ULK1‐CI‐T180A), or reportedly catalytically active (CA mutant; ULK1‐CA‐S556D) ULK1 protein, respectively 32, 33, and their overexpressions were confirmed by immunoblot analysis (Fig 7E and F). Although it has been reported that overexpression of ULK1 can block autophagy 34, ULK1 overexpression in this study did not affect autophagy flux under nutrient starvation (Fig EV5). The reason is likely to be due to the difference in the expression level of ULK1. In contrast, the level of cell death upon USP20 depletion was partially rescued by overexpression of wild‐type ULK1 and ULK1‐CA‐S556D mutant (Fig 7G and H). These data imply that USP20 depletion increases starvation‐induced cell death through downregulation of ULK1 stability. Although a recent paper has reported that ULK1 can induce apoptosis independently of autophagy 35, these results were restricted to cell death induced by oxidative stress and thus should be distinguished from our findings which showed a role of the ULK1–USP20 axis at an early step of autophagy induction under prolonged starvation.
Figure EV5. Autophagy flux in wild‐type ULK1‐, catalytically inactive (CI) ULK1‐, or catalytically active (CA) ULK1‐expressing HeLa cells under nutrient starvation.
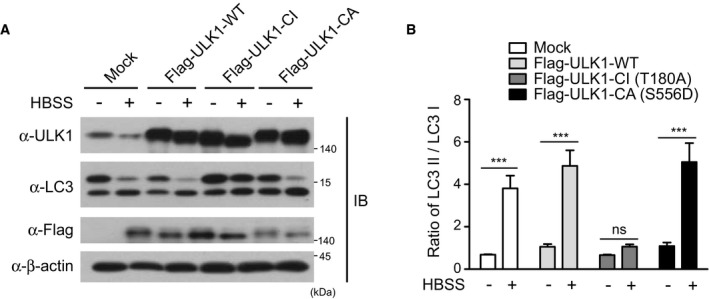
- HeLa cells stably expressing Flag‐ULK1‐WT, Flag‐ULK1‐CI, or Flag‐ULK1‐CA were starved with HBSS medium for 1 h, respectively. Expressions of ULK1 and LC3 proteins were observed by immunoblotting with the indicated antibodies. β‐actin expression was used as a loading control.
- The ratio of LC3II to LC3I was quantified using ImageJ software. For normalization, β‐actin expression was used as a control. The data were statistically analyzed by two‐way ANOVA followed by Sidak's multiple comparison test (***P < 0.001 compared to the indicated points; ns, not significant; n = 3). The bars represent the mean ± SD.
Discussion
Ever since USP20 was identified as a substrate of the cullin‐RING ligase family member CRLVHL 36, 37, several signaling molecules, including hypoxia‐inducible factor 1α, Rad17, Claspin, TRAF6, and ERK3, have been reported as substrates of USP20 regarding hypoxia, DNA damage responses, and TLR4‐ and mitogen‐signaling pathways 38, 39, 40, 41, 42. In this study, we demonstrate that the deubiquitinating enzyme USP20 stabilizes ULK1 through deubiquitinating ULK1 at the basal level and is thus a critical factor in inducing autophagy initiation. Until now, the DUBs involved in the stability of ULK1 were unknown. The only implication that DUBs are involved was a report that treatment of the DUB inhibitor WP1130 leads to inhibition of ULK1 activity 25. Depletion of DUBs such as USP5, USP9X, USP14, UCHL1, and UCHL5, which are known to be targeted by WP1130, did not influence ULK1 expression 25. Thus, our study is the first report to identify a deubiquitinating enzyme involved in autophagy initiation and its underlying mechanism. However, we do not claim that ULK1 is the only substrate of the USP20 protein in autophagy process. Because p62 expression was decreased at the basal state in USP20‐depleted cells and the decreased expression of p62 shown in starvation‐induced autophagy was not restored in USP20‐depleted cells under nutrient starvation, it is possible that p62 may be another target of USP20 regarding autophagy.
While much attention has been given to the regulation of ULK1 activity, the molecular mechanism responsible for ULK1 stability has not been clearly addressed. USP20 depletion profoundly reduced the basal level expression of ULK1 without autophagy induction, although the expression levels of ULK1 mRNA were unchanged. Our present findings indicate that ULK1 is localized into lysosomes and USP20 prevents lysosome‐dependent ULK1 degradation. That is, dissociation of USP20 from ULK1 during autophagy initiation may cause the transition of ULK1 localization into lysosome, resulting in ULK1 degradation. Our finding that dissociation of USP20 from its substrate causes the localization of the substrate into autophagosomes, which fuse with lysosomes to form autolysosomes, may be supported by a recent report that USP20 dissociation from the activated β2 adrenergic receptors (β2AR) facilitates trafficking of ubiquitinated β2AR to autophagosomes 43. Therefore, it is possible that ULK1 is degraded in autophagosomes during autophagy, and turnover of ULK1 in wild‐type cells during autophagy and turnover of ULK1 in USP20‐depleted cells may be two independent processes. Furthermore, our results also indicate that ULK1 degradation in autophagy‐deficient cellular contexts such as ATG5 KO MEFs under nutrient starvation is mediated through the proteasome pathway. This is likely because autophagy‐deficient cells need maintain the physiological ULK1 levels under starvation and thus use the proteasome pathway, and not the lysosome‐dependent pathway. However, we do not emphasize that ULK1 degradation is only dependent on lysosomes because several studies have reported proteasome‐dependent degradation of ULK1 24, 29, 30, 44. In certain aspects, it is possible that there are other deubiquitinases regulating proteasome‐mediated ULK1 degradation, and thus, it is likely that the fate of the ULK1 protein may be dependent on cell contexts depending on the availability of deubiquitinating enzymes.
Furthermore, the results that USP20 is dissociated from ULK1 at a late time after nutrient starvation are conceptually important for understanding the dynamics of the ULK1 complex at early and late times in the autophagy process. Regulation of ULK1 stability by USP20 might be a crucial requirement for autophagy initiation, and dissociation may promote the following steps in autophagy. However, we still do not understand the mechanism of which signal causes the dissociation of USP20 from ULK1 during the autophagy process. Therefore, it is worth investigating the molecular signals regarding the dissociation of ULK1 and USP20 in autophagy. Moreover, the previous report that USP20 is localized into the endoplasmic reticulum (ER) may lead to reveal a novel function of USP20 regarding ER stress and autophagy 45, because ER stress has been widely recognized to be closely related to autophagy activation 46.
In conclusion, our results demonstrate a role of the USP20 deubiquitinating enzyme in acting as a critical regulator of ULK1 and show a novel mechanism of the autophagy process in terms of ULK1 stability. Thus, this USP20–ULK1 axis may be a promising target to artificially modulate and inhibit autophagy in certain human diseases.
Materials and Methods
Cell culture and reagents
HEK293T (human embryonic kidney), HeLa (human cervix adenocarcinoma), HCT116 (human colon cancer), and HT29 (human colorectal adenocarcinoma) cells were purchased from the American Type Culture Collection (ATCC), and ATG5 KO MEFs were kindly provided by Dr. Heesun Cheong (National Cancer Center, Korea). ATG5 KO MEFs, HEK293, and HeLa cells were cultured in DMEM supplemented with 10% FBS (HyClone). HCT116 cells were cultured in RPMI 1640 supplemented with 10% FBS. HT29 cells were maintained in McCoy's 5A supplemented with 10% FBS. All cell lines were incubated at 37°C in the presence of 5% CO2. All cell lines were routinely tested for mycoplasma contamination by PCR. For starvation, HeLa cells were washed twice with PBS and incubated in HBSS (WelGENE). Bafilomycin A1 (B1793), E‐64d (E8640), pepstatin A (P5318), rapamycin (R0395), lactacystin (L6785), and chloroquine (C6628) were purchased from Sigma. Z‐Leu‐Leu‐Leu‐CHO (MG132, cat# M‐1157) was purchased from A.G. Scientific, Inc.
Plasmids
Full‐length mouse HA‐ULK1 plasmid was provided by Dr. Joung‐Mok Kim (Kyung Hee University, Korea). Full‐length ULK1 and deletion mutants of ULK1 (Flag‐ULK1‐KD, Flag‐ULK1‐S/T, and Flag‐ULK1‐CTD) were amplified from the full‐length HA‐ULK1 plasmid by PCR and cloned into the EcoRI and NotI sites of the pcDNA3‐Flag vector (Invitrogen). A catalytically inactive (CI) mutant of ULK1 (T180A) and a catalytically active (CA) mutant of ULK1 (S556D) were generated from the full‐length Flag‐ULK1 using the QuikChange Mutagenesis kit (Stratagene). The wild‐type Flag‐ULK1, Flag‐ULK1‐CI, and Flag‐ULK1‐CA mutants were also cloned into the BglII and HpaI sites of pMSCV‐puro. The full‐length human ULK1 cDNA was purchased from Addgene (plasmid, #31961). Full‐length human HA‐Flag‐USP20 plasmid was kindly provided by Dr. Jaewhan Song (Yonsei University, Korea). Full‐length USP20 was amplified from HA‐Flag‐USP20 by PCR and subcloned into the EcoRI and NotI sites of three vectors (pcDNA3‐Flag, pcDNA3‐HA vector, and pGEX‐5x‐1). Deletion mutants of USP20 (Flag‐USP20‐Zf‐UBP, Flag‐USP20‐UCH, and Flag‐USP20‐DUSP) were amplified from the full‐length Flag‐USP20 plasmid by PCR and cloned into the EcoRI and NotI sites of the pcDNA3‐Flag vector. The USP20‐specific siRNA‐resistant catalytically inactive (CI) mutant of USP20 (C154S, H643Q) and wild‐type Flag‐rUSP20 were generated using the QuikChange Mutagenesis kit. The plasmid encoding HA‐tagged ubiquitin (HA‐Ub) was previously described 47. For the construction of Flag‐mCherry‐ULK1, PCR‐amplified DNA fragment encoding mCherry and ULK1 was inserted into HindIII and EcoRI/BglII site of p3XFlag‐CMV‐7.1 (Addgene, #E4026), respectively. The plasmid encoding GFP‐RFP‐LC3 was previously described 48. A ubiquitination‐defective 9KR mutant of ULK1 (K865R, K906R, K926R, K934R, K945R, K965R, K1010R, K1033R, K1035R) was generated using the Muta‐Direct™ Site‐Directed Mutagenesis Kit (iNtRON, #15071). PCR‐generated portions of all constructs in this study were verified by sequencing. Primer sequences for PCR and site‐directed mutagenesis are described in Appendix Table S1.
Antibodies, immunoblot, and immunoprecipitation
Company names, catalog numbers, clone numbers, species, and dilution ratio of the antibodies used in this study are described in Appendix Table S2. For immunoblot analysis, cells were lysed with lysis buffer (1% Triton X‐100, 50 mM Tris–HCl at pH 7.5, 150 mM NaCl, 0.1% SDS, 0.5% sodium deoxycholate, 2 mM EDTA, 10 mM NaF, 1 mM Na3VO4, protein inhibitor cocktail). Protein extracts were separated by SDS–PAGE and transferred onto PVDF membranes. Membranes were immunoblotted with the indicated antibodies. For immunoprecipitation, cell lysates were lysed in lysis buffer (0.4% NP‐40, 20 mM Tris–HCl at pH 7.5, 150 mM NaCl, 10% glycerol, 2 mM EDTA, 10 mM NaF, 1 mM Na3VO4, protein inhibitor cocktail) and incubated with specific antibodies at 4°C for 12 h followed by 1‐h incubation with protein G agarose beads (GenDEPOT). Immunocomplexes were washed three times with lysis buffer and boiled with 2× sample buffer. Immunoblot analysis was performed with the indicated antibodies.
Stable cell line
To generate retroviruses, HEK293FT cells were transfected with pMSCV‐puro‐based Flag‐ULK1 or its mutant expression plasmid in combination with the retroviral packaging system (Invitrogen) using Lipofectamine 2000 (Invitrogen). The retrovirus particle‐containing culture medium was harvested after 48 h. HeLa cells were incubated with retrovirus‐containing medium together with Polybrene (8 μg/ml). After 24‐h incubation, the culture medium was removed and replaced with complete DMEM. After 1 day, recombinant retrovirus‐infected cells were selected with puromycin (2 μg/ml)‐containing culture medium.
In vitro deubiquitination assay
The in vitro deubiquitination assay was performed as described previously 49. Briefly, ubiquitinated Flag‐ULK1, Flag‐USP20 wild‐type (WT), and Flag‐USP20 catalytically inactive (CI) proteins were isolated from HEK293 cells transiently expressing Flag‐ULK1 and HA‐Ub, the plasmid encoding Flag‐USP20 wild‐type (WT) alone, and plasmid encoding the Flag‐USP20 catalytically inactive (CI) form alone, respectively. The ubiquitinated ULK1, Flag‐USP20 wild‐type, and Flag‐USP20 catalytically inactive proteins were purified from cell extracts with anti‐FLAG M2 Affinity Gel (A2220, Sigma) and sequentially processed through competitive elution with FLAG peptide (F3290, Sigma) according to the manufacturer's protocol. For the in vitro deubiquitination assay for ULK1 protein, purified Flag‐ULK1 was incubated with purified USP20 wild‐type (WT) or its catalytically inactive (CI) protein in deubiquitination buffer (40 mM Tris, 50 mM NaCl, 5 mM MgCl2, 5 mM dithiothreitol, 2 mM ATP, pH 7.6) for 6 h at 37°C.
RNA interference
To screen for deubiquitinases (DUBs) regulating ULK1 stability, siRNA pools of 99 human DUBs and scrambled siRNA (control siRNA) were purchased from Dharmacon. Human USP20, ULK1, and control siRNA oligonucleotides were synthesized by Genolution (Seoul, Korea). Target sequences of siRNAs are described in Appendix Table S3. siRNAs were reverse‐transfected using Lipofectamine RNAiMAX™ reagent (Invitrogen).
Ubiquitination assay for endogenous ULK1 and Ni‐NTA pull‐down assay
Ubiquitination assay for endogenous ULK1 protein was performed as described previously 47. HeLa cells were reverse‐transfected with USP20‐specific siRNA or control siRNA. Briefly, cell lysates were suspended with PBS containing 5 mM NEM (N‐ethylmaleimide) and 1% SDS was added and the sample boiled for 10 min to dissociate non‐covalent protein interactions. Samples were diluted 10‐fold with lysis buffer used for immunoprecipitation and suspended using a 1‐ml syringe. After centrifugation of samples at 16,000 g for 10 min at 4°C, immunoprecipitation was performed by anti‐ULK1 antibody (sc‐33182, Santa Cruz) and an immunoblot assay for the ubiquitination of endogenous ULK1 was performed by anti‐ubiquitin and other indicated antibodies according to the protocol previously described 43. Alternatively, Ni‐NTA pull‐down assay was performed with His‐ubiquitin as described previously 50. Briefly, HEK293 cells expressing HA‐ULK1 and His‐ubiquitin were lysed in 6 M guanidine–HCl buffer (pH 8.0). His‐ubiquitin‐conjugated proteins were purified by incubation with Ni2+‐NTA agarose beads (Qiagen), washed with 25 mM Tris and 20 mM imidazole washing buffer, eluted in sample buffer, and then analyzed by immunoblotting.
RNA extraction and real‐time RT–PCR
Total RNA was isolated using the TRIzol (Invitrogen). Reverse transcriptase M‐MLV (Takara) and oligo (dT) were used for single‐stranded cDNA synthesis. Real‐time PCR was performed using the iQ SYBR Green Supermix (Bio‐Rad) with the following primer sets: Human‐specific ULK1 primers were purchased from IDT, Inc. (Coralville, IA, USA). β‐actin primers are 5′‐ACC GAG CGC GGC TAC AG‐3′ and 5′‐CTT AAT GTC ACG CAC GAT TCC C‐3′. Data were normalized to expression of β‐actin mRNA. All reactions were independently performed at least three times.
In vitro pull‐down assay
Transformed BL21 (DE3) cells expressing GST or GST‐USP20 were grown in the presence of 1 mM isopropyl‐1‐thio‐β‐D‐galactopyranoside (IPTG) for 3 h at 37°C. Cell lysates were prepared by sonication using a probe tip sonicator ten times for 5 s. The supernatant was obtained from the lysates and loaded onto a glutathione column. After washing the column five times, GST or GST‐USP20 fusion proteins were eluted with glutathione buffer. Myc‐ULK1 was prepared by using an in vitro translation kit (TNT‐coupled SP6 reticulocyte lysate system, Promega). Pull‐down assays were performed as described previously 50. Briefly, equal amounts of GST or GST‐USP20 fusion proteins were immobilized onto glutathione‐Sepharose beads (GE Healthcare Bio‐sciences), and the beads were incubated with in vitro translated Myc‐ULK1. The mixture was placed on ice for 1 h and washed three times with washing buffer (20 mM Tris–HCl, pH 8.0, 150 mM NaCl, 0.5% Nonidet P‐40), and bound proteins were eluted, separated by 12% SDS–polyacrylamide gel electrophoresis, and Myc‐ULK1 was detected by immunoblotting using anti‐Myc antibody.
Live cell imaging assay
To visualize GFP‐RFP‐LC3 puncta, HeLa cells or USP20‐depleted HeLa cells were transiently transfected with a GFP‐RFP‐LC3 expression plasmid. Cells were grown on 35‐mm glass‐bottom dishes and left untreated or incubated with HBSS medium in combination with BafA1. After 8‐h starvation, images of LC3 puncta containing green and red fluorescence were captured at an excitation wavelength of 488 nm and 543 nm, respectively, with a Zeiss LSM 700 confocal microscope and ZEN software. For lysosomal localization of ULK1, a plasmid encoding wild‐type mCherry‐ULK1 was transfected into control or USP20‐knockdown HeLa cells. In addition, wild‐type mCherry‐ULK1 or mCherry‐ULK1‐9KR was transfected into HeLa cells. Cells were left untreated or incubated with HBSS for 8 h. Then, LysoTracker® Green DND‐26 (Invitrogen, Carlsbad, USA) was incubated in pre‐warmed Opti‐MEM™ media for 5 min and mounted on glass slides. Cells were examined with a laser‐scanning confocal microscope Zeiss LSM 700 and ZEN software (Carl Zeiss, Oberkochen, Germany). The number of LC3 puncta or lysosomal localization of ULK1 was counted in five different arbitrary areas from three independent experiments.
Apoptosis analysis
Cells were gathered using trypsin and then resuspended in Annexin V binding buffer. 1 × 10⁵ cells in 100 μl volume were incubated with Annexin V‐FITC and 7‐AAD (BD Biosciences) for 15 min at RT in the dark. 400 μl of 1× binding buffer was added, and fluorescence was detected using FACSCanto II (BD Biosciences).
Statistical analyses
Quantitation of immunoblotted proteins was performed using ImageJ software 51. Data are expressed as mean ± SD or mean ± SEM. Statistical significance was calculated by one‐way or two‐way ANOVA using GraphPad Prism 5 software. P < 0.05 was considered statistically significant. All results shown in figures are representative of at least three independent experiments.
Author contributions
JHK, DS, S‐JK, and DWC designed the research, did the experimental work, analyzed data, and wrote the manuscript. JSP, JH, JC, J‐HL, SMJ, K‐WS, and E‐WL did the experimental work, analyzed data, and provided technical assistance. YSL and HC participated in the study design and coordinated the study. CYC and SHP designed and conceptualized the research, supervised the experimental work, analyzed data, and wrote the manuscript.
Conflict of interest
The authors declare that they have no conflict of interest.
Supporting information
Appendix
Expanded View Figures PDF
Source Data for Expanded View
Review Process File
Source Data for Figure 1
Source Data for Figure 3
Source Data for Figure 4
Source Data for Figure 5
Source Data for Figure 6
Source Data for Figure 7
Acknowledgements
We thank Dr. Min Sung Choi for critical reading of the manuscript. This work was supported by the National Research Foundation grant of Korea (2015R1A2A2A05001344 to S.H.P., 2017R1A2B2009818 to C.Y.C., and SRC 2017R1A5A1014560) funded by the Ministry of Science and ICT and in part by a grant from the National R&D Program for Cancer Control, Ministry for Health and Welfare, Republic of Korea (1520120 to S.H.P).
EMBO Reports (2018) 19: e44378 29487085
Contributor Information
Cheol Yong Choi, Email: choicy@skku.ac.kr.
Seok Hee Park, Email: parks@skku.edu.
References
- 1. He C, Klionsky DJ (2009) Regulation mechanisms and signaling pathways of autophagy. Annu Rev Genet 43: 67–93 [DOI] [PMC free article] [PubMed] [Google Scholar]
- 2. Choi AM, Ryter SW, Levine B (2013) Autophagy in human health and disease. N Engl J Med 368: 651–662 [DOI] [PubMed] [Google Scholar]
- 3. Wang RC, Levine B (2010) Autophagy in cellular growth control. FEBS Lett 584: 1417–1426 [DOI] [PMC free article] [PubMed] [Google Scholar]
- 4. Kim KH, Lee MS (2014) Autophagy‐a key player in cellular and body metabolism. Nat Rev Endocrinol 10: 322–337 [DOI] [PubMed] [Google Scholar]
- 5. Mizushima N, Komatsu M (2011) Autophagy: renovation of cells and tissues. Cell 147: 728–741 [DOI] [PubMed] [Google Scholar]
- 6. Huo HZ, Wang B, Qin J, Guo SY, Liu WY, Gu Y (2013) AMP‐activated protein kinase (AMPK)/Ulk1‐dependent autophagic pathway contributes to C6 ceramide‐induced cytotoxic effects in cultured colorectal cancer HT‐29 cells. Mol Cell Biochem 378: 171–181 [DOI] [PubMed] [Google Scholar]
- 7. Yang Z, Klionsky DJ (2010) Mammalian autophagy: core molecular machinery and signaling regulation. Curr Opin Cell Biol 22: 124–131 [DOI] [PMC free article] [PubMed] [Google Scholar]
- 8. Xie Z, Klionsky DJ (2007) Autophagosome formation: core machinery and adaptations. Nat Cell Biol 9: 1102–1109 [DOI] [PubMed] [Google Scholar]
- 9. Mizushima N, Levine B, Cuervo AM, Klionsky DJ (2008) Autophagy fights disease through cellular self‐digestion. Nature 451: 1069–1075 [DOI] [PMC free article] [PubMed] [Google Scholar]
- 10. Mizushima N, Yoshimori T, Ohsumi Y (2011) The role of Atg proteins in autophagosome formation. Annu Rev Cell Dev Biol 27: 107–132 [DOI] [PubMed] [Google Scholar]
- 11. Chan EY, Tooze SA (2009) Evolution of Atg1 function and regulation. Autophagy 5: 758–765 [DOI] [PubMed] [Google Scholar]
- 12. Hara T, Takamura A, Kishi C, Iemura S, Natsume T, Guan JL, Mizushima N (2008) FIP200, a ULK‐interacting protein, is required for autophagosome formation in mammalian cells. J Cell Biol 181: 497–510 [DOI] [PMC free article] [PubMed] [Google Scholar]
- 13. Chan EY, Longatti A, McKnight NC, Tooze SA (2009) Kinase‐inactivated ULK proteins inhibit autophagy via their conserved C‐terminal domains using an Atg13‐independent mechanism. Mol Cell Biol 29: 157–171 [DOI] [PMC free article] [PubMed] [Google Scholar]
- 14. Ganley IG, du Lam H, Wang J, Ding X, Chen S, Jiang X (2009) ULK1.ATG13.FIP200 complex mediates mTOR signaling and is essential for autophagy. J Biol Chem 284: 12297–12305 [DOI] [PMC free article] [PubMed] [Google Scholar]
- 15. Jung CH, Jun CB, Ro SH, Kim YM, Otto NM, Cao J, Kundu M, Kim DH (2009) ULK‐Atg13‐FIP200 complexes mediate mTOR signaling to the autophagy machinery. Mol Biol Cell 20: 1992–2003 [DOI] [PMC free article] [PubMed] [Google Scholar]
- 16. Shimobayashi M, Hall MN (2014) Making new contacts: the mTOR network in metabolism and signalling crosstalk. Nat Rev Mol Cell Biol 15: 155–162 [DOI] [PubMed] [Google Scholar]
- 17. Mihaylova MM, Shaw RJ (2011) The AMPK signalling pathway coordinates cell growth, autophagy and metabolism. Nat Cell Biol 13: 1016–1023 [DOI] [PMC free article] [PubMed] [Google Scholar]
- 18. Hosokawa N, Hara T, Kaizuka T, Kishi C, Takamura A, Miura Y, Iemura S, Natsume T, Takehana K, Yamada N et al (2009) Nutrient‐dependent mTORC1 association with the ULK1‐Atg13‐FIP200 complex required for autophagy. Mol Biol Cell 20: 1981–1991 [DOI] [PMC free article] [PubMed] [Google Scholar]
- 19. Kim J, Kundu M, Viollet B, Guan KL (2011) AMPK and mTOR regulate autophagy through direct phosphorylation of Ulk1. Nat Cell Biol 13: 132–141 [DOI] [PMC free article] [PubMed] [Google Scholar]
- 20. Chan EY (2009) mTORC1 phosphorylates the ULK1‐mAtg13‐FIP200 autophagy regulatory complex. Sci Signal 2: pe51 [DOI] [PubMed] [Google Scholar]
- 21. Hardie DG (2011) AMPK and autophagy get connected. EMBO J 30: 634–635 [DOI] [PMC free article] [PubMed] [Google Scholar]
- 22. Egan DF, Shackelford DB, Mihaylova MM, Gelino S, Kohnz RA, Mair W, Vasquez DS, Joshi A, Gwinn DM, Taylor R et al (2011) Phosphorylation of ULK1 (hATG1) by AMP‐activated protein kinase connects energy sensing to mitophagy. Science 331: 456–461 [DOI] [PMC free article] [PubMed] [Google Scholar]
- 23. Nazio F, Strappazzon F, Antonioli M, Bielli P, Cianfanelli V, Bordi M, Gretzmeier C, Dengjel J, Piacentini M, Fimia GM et al (2013) mTOR inhibits autophagy by controlling ULK1 ubiquitylation, self‐association and function through AMBRA1 and TRAF6. Nat Cell Biol 15: 406–416 [DOI] [PubMed] [Google Scholar]
- 24. Jiao H, Su GQ, Dong W, Zhang L, Xie W, Yao LM, Chen P, Wang ZX, Liou YC, You H (2015) Chaperone‐like protein p32 regulates ULK1 stability and autophagy. Cell Death Differ 22: 1812–1823 [DOI] [PMC free article] [PubMed] [Google Scholar]
- 25. Driessen S, Berleth N, Friesen O, Loffler AS, Bohler P, Hieke N, Stuhldreier F, Peter C, Schink KO, Schultz SW et al (2015) Deubiquitinase inhibition by WP1130 leads to ULK1 aggregation and blockade of autophagy. Autophagy 11: 1458–1470 [DOI] [PMC free article] [PubMed] [Google Scholar]
- 26. Berthouze M, Venkataramanan V, Li Y, Shenoy SK (2009) The deubiquitinases USP33 and USP20 coordinate beta2 adrenergic receptor recycling and resensitization. EMBO J 28: 1684–1696 [DOI] [PMC free article] [PubMed] [Google Scholar]
- 27. Zhang XJ, Chen S, Huang KX, Le WD (2013) Why should autophagic flux be accessed? Acta Pharmacol Sin 34: 595–599 [DOI] [PMC free article] [PubMed] [Google Scholar]
- 28. Moscat J, Karin M, Diaz‐Meco MT (2016) p62 in cancer: signaling adaptor beyond autophagy. Cell 167: 606–609 [DOI] [PMC free article] [PubMed] [Google Scholar]
- 29. Nazio F, Carinci M, Valacca C, Bielli P, Strappazzon F, Antoniali M, Ciccosanti F, Rodolfo C, Campello S, Fimia GM et al (2015) Fine‐tuning of ULK1 mRNA and protein level is required for autophagy oscillation. J Cell Biol 215: 841–856 [DOI] [PMC free article] [PubMed] [Google Scholar]
- 30. Liu CC, Lin YC, Chen YH, Chen CM, Pang LY, Chen HA, Wu PR, Lin MY, Jiang ST, Tsai TF et al (2016) Cul3‐KLH20 ubiquitin ligase governs the turnover of ULK1 and VPS34 complexes to control autophagy termination. Mol Cell 61: 84–97 [DOI] [PubMed] [Google Scholar]
- 31. Marino G, Niso‐Santano M, Baehrecke EH, Kroemer G (2014) Self‐consumption: the interplay of autophagy and apoptosis. Nat Rev Mol Cell Biol 15: 81–94 [DOI] [PMC free article] [PubMed] [Google Scholar]
- 32. Bach M, Larance M, James DE, Ramm G (2011) The serine/threonine kinase ULK1 is a target of multiple phosphorylation events. Biochem J 440: 283–291 [DOI] [PubMed] [Google Scholar]
- 33. Konno H, Konno K, Barber GN (2013) Cyclic dinucleotides trigger ULK1 (ATG1) phosphorylation of STING to prevent sustained innate immune signaling. Cell 155: 688–698 [DOI] [PMC free article] [PubMed] [Google Scholar]
- 34. Chan EYW, Kir S, Tooze SA (2007) siRNA screening of the kinome identifies ULK1 as a multidomain modulator of autophagy. J Biol Chem 282: 25464–25474 [DOI] [PubMed] [Google Scholar]
- 35. Joshi A, Lyengar R, Joo JH, Li‐Harms XJ, Marion R, Winborn BJ, Phillips A, Temirov J, Sciarretta S, Kriwacki R et al (2016) Nuclear ULK1 promotes cell death in response to oxidative stress through PARP1. Cell Death Diiffer 23: 216–230 [DOI] [PMC free article] [PubMed] [Google Scholar]
- 36. Li Z, Na X, Wang D, Schoen SR, Messing EM, Wu G (2002) Ubiquitination of a novel deubiquitinating enzyme requires direct binding to von Hippel‐Lindau tumor suppressor protein. J Biol Chem 277: 4656–4662 [DOI] [PubMed] [Google Scholar]
- 37. Li Z, Wang D, Na X, Schoen SR, Messing EM, Wu G (2002) Identification of a deubiquitinating enzyme subfamily as substrates of the von Hippel‐Lindau tumor suppressor. Biochem Biophys Res Commun 294: 700–709 [DOI] [PubMed] [Google Scholar]
- 38. Li Z, Wang D, Messing EM, Wu G (2005) VHL protein‐interacting deubiquitinating enzyme 2 deubiquitinates and stabilizes HIF‐1alpha. EMBO Rep 6: 373–378 [DOI] [PMC free article] [PubMed] [Google Scholar]
- 39. Shanmugam I, Abbas M, Ayoub F, Mirabai S, Bsaili M, Caulder EK, Weinstock DM, Tomkinson AE, Hromas R, Shaheen M (2014) Ubiquitin‐specific protease 20 regulates Rad17 stability, checkpoint kinase 1 phosphorylation and DNA repair by homologous recombination. J Biol Chem 289: 22739–22748 [DOI] [PMC free article] [PubMed] [Google Scholar]
- 40. Yuan J, Luo K, Deng M, Li Y, Yin P, Gao B, Fang Y, Wu P, Liu T, Lou Z (2014) HERC2‐USP20 axis regulates DNA damage checkpoint through Claspin. Nucleic Acids Res 42: 13110–13121 [DOI] [PMC free article] [PubMed] [Google Scholar]
- 41. Jean‐Charles PY, Zhang L, Wu JH, Han SO, Brian L, Feedman NJ, Shenoy SK (2016) Ubiquitin‐specific protease 20 regulates the reciprocal functions of β‐Arrestin2 in Toll‐like Receptor 4‐promoted nuclear factor κB (NFκB) activation. J Biol Chem 291: 7450–7464 [DOI] [PMC free article] [PubMed] [Google Scholar]
- 42. Mathien S, Déléris P, Soulez M, Voisin L, Meloche S (2017) Deubiquitinating enzyme USP20 regulates extracellular signal‐regulated kinase 3 stability and biological activity. Mol Cell Biol 37: e00432‐16 [DOI] [PMC free article] [PubMed] [Google Scholar]
- 43. Kommaddi RP, Jean‐Charles PY, Shenoy SK (2016) Phosphorylation of the deubiquitinase USP20 by protein kinase A regulates post‐endocytic trafficking of β2 adrenergic receptors to autophagosomes during physiological stress. J Biol Chem 290: 8888–8903 [DOI] [PMC free article] [PubMed] [Google Scholar]
- 44. Joo JH, Dorsey FC, Joshi A, Hennessy‐Walters KM, Rose KL, McCastlain K, Zhang J, Iyengar R, Jung CH, Suen DF et al (2011) Hsp90‐Cdc37 chaperone complex regulates Ulk1‐ and Atg13‐mediated mitophagy. Mol Cell 43: 572–585 [DOI] [PMC free article] [PubMed] [Google Scholar]
- 45. Curcio‐Morelli C, Zavacki AM, Christofollete M, Gereben B, de Freitas BC, Harney JW, Li Z, Wu G, Bianco AC (2003) Deubiquitination of type 2 iodothyronine deiodinase by von Hippel‐Lindau protein‐interacting deubiquitinating enzymes regulates thyroid hormone activation. J Clin Invest 112: 189–196 [DOI] [PMC free article] [PubMed] [Google Scholar]
- 46. Senft D, Ronai ZA (2015) UPR, autophagy, and mitochondrial crosstalk underlies the ER stress response. Trends Biochem Sci 40: 141–148 [DOI] [PMC free article] [PubMed] [Google Scholar]
- 47. Jung SM, Lee JH, Park J, Oh YS, Lee SK, Park JS, Lee YS, Kim JH, Lee JY, Bae YS et al (2013) Smad6 inhibits non‐canonical TGF‐beta1 signalling by recruiting the deubiquitinase A20 to TRAF6. Nat Commun 4: 2562 [DOI] [PubMed] [Google Scholar]
- 48. Cho SW, Na W, Choi M, Kang SJ, Lee SG, Choi CY (2017) Autophagy inhibits cell death induced by the anti‐cancer drug morusin. Am J Cancer Res 7: 518–530 [PMC free article] [PubMed] [Google Scholar]
- 49. Lee EW, Seong D, Seo J, Jeong M, Lee HK, Song J (2015) USP11‐dependent selective cIAP2 deubiquitylation and stabilization determine sensitivity to Smac mimetics. Cell Death Differ 22: 1463–1476 [DOI] [PMC free article] [PubMed] [Google Scholar]
- 50. Choi DW, Na W, Kabir MH, Yi E, Kwon S, Yeom J, Ahn JW, Choi HH, Lee Y, Seo KW et al (2013) WIP1, a homeostatic regulator of the DNA damage response, is targeted by HIPK2 for phosphorylation and degradation. Mol Cell 51: 374–385 [DOI] [PubMed] [Google Scholar]
- 51. Schneider CA, Rasband WS, Eliceiri KW (2012) NIH Image to ImageJ: 25 years of image analysis. Nat Methods 9: 671–675 [DOI] [PMC free article] [PubMed] [Google Scholar]
Associated Data
This section collects any data citations, data availability statements, or supplementary materials included in this article.
Supplementary Materials
Appendix
Expanded View Figures PDF
Source Data for Expanded View
Review Process File
Source Data for Figure 1
Source Data for Figure 3
Source Data for Figure 4
Source Data for Figure 5
Source Data for Figure 6
Source Data for Figure 7