

Abstract
Mutations in PINK1 cause autosomal recessive Parkinson's disease (PD), a neurodegenerative movement disorder. PINK1 is a kinase that acts as a sensor of mitochondrial damage and initiates Parkin‐mediated clearance of the damaged organelle. PINK1 phosphorylates Ser65 in both ubiquitin and the ubiquitin‐like (Ubl) domain of Parkin, which stimulates its E3 ligase activity. Autophosphorylation of PINK1 is required for Parkin activation, but how this modulates the ubiquitin kinase activity is unclear. Here, we show that autophosphorylation of Tribolium castaneum PINK1 is required for substrate recognition. Using enzyme kinetics and NMR spectroscopy, we reveal that PINK1 binds the Parkin Ubl with a 10‐fold higher affinity than ubiquitin via a conserved interface that is also implicated in RING1 and SH3 binding. The interaction requires phosphorylation at Ser205, an invariant PINK1 residue (Ser228 in human). Using mass spectrometry, we demonstrate that PINK1 rapidly autophosphorylates in trans at Ser205. Small‐angle X‐ray scattering and hydrogen–deuterium exchange experiments provide insights into the structure of the PINK1 catalytic domain. Our findings suggest that multiple PINK1 molecules autophosphorylate first prior to binding and phosphorylating ubiquitin and Parkin.
Keywords: Parkin, Parkinson, phosphorylation, PINK1, ubiquitin
Subject Categories: Post-translational Modifications, Proteolysis & Proteomics; Structural Biology
Introduction
Mutations in PINK1 (PARK6 gene) and Parkin (PARK2 gene) cause autosomal recessive early‐onset forms of Parkinson's disease 1, 2. PINK1 is a mitochondrially targeted serine–threonine kinase 1, 3, and Parkin is a RING‐between‐RING (RBR)‐type E3 ubiquitin ligase, and they are both involved in a mitochondrial quality control pathway 4. The pathway comes into play when mitochondria undergo damage, which triggers the stabilization of PINK1 on the outer mitochondrial membrane (OMM) as an active kinase 5. There, it phosphorylates ubiquitin (Ub) 6, 7, 8 and cytosolic Parkin on its N‐terminal ubiquitin‐like domain (Ubl) specifically at Ser65 9—a residue conserved in both Ub and Ubl. The phosphorylation of Parkin and its binding to phospho‐Ub results in the activation of its E3 ligase activity and localization to the mitochondria, allowing it to ubiquitinate OMM proteins 10, 11. Build‐up of ubiquitin chains on mitochondrial proteins recruits cargo receptors, including optineurin and NDP52, and subsequently autophagy machinery to the mitochondria to initiate mitophagy 12, 13. In healthy mitochondria, PINK1 is imported, cleaved by the mitochondrial processing peptidase (MPP), presenilin‐associated rhomboid‐like (PARL) protease, and AFG3L2 14, 15, and then degraded through the ubiquitin–proteasome pathway 16. Hence, PINK1 is kept at low levels under basal condition, and its accumulation on mitochondria is a specific cellular response to mitochondrial damage.
In recent years, the role of phosphorylation of Ub and Ubl at Ser65 by PINK1 has been discovered in terms of the molecular mechanism for the activation of Parkin 17, 18, 19, 20, 21. While some proteomics studies in yeast have found multiple sites of phosphorylation on cellular Ub including Ser57, phosphorylation at Ser65 is so far the best characterized 22. PINK1 is also the only known ubiquitin kinase to date. Despite this well‐characterized phosphorylation of Ub and Ubl at Ser65 by PINK1 and its consequences for Parkin activation and localization on mitochondria, the molecular mechanisms governing the recognition and phosphorylation of Ub and Ubl by PINK1 upstream of Parkin activation are not well understood.
Human PINK1 (hPINK1) is a 581 amino acid protein with an N‐terminal mitochondrial targeting sequence (MTS) followed by a putative transmembrane helix, a linker region (here on referred to as NT linker), a kinase domain, and a C‐terminal segment (Fig EV1A). The kinase domain is reported to be a canonical bilobular domain weakly homologous (~20–25% sequence identity) to the calmodulin‐dependent kinase (CamK) and DMPK families 23. The N‐lobe of the kinase domain of hPINK1 harbors three insertions relative to homologous Ser/Thr kinases. The NT linker and C‐terminal segment do not have homology to known proteins and hence are unique features of PINK1 as well 24. Some studies suggest that the C‐terminal segment might play a role in regulating the kinase activity of PINK1 25. The exact functions of these unique features remain to be understood. Owing to the poor expression of hPINK1 in bacterial expression systems and low levels of activity in vitro, most recent studies have made use of PINK1 orthologs from insect species Tribolium castaneum (red flour beetle) and Pediculus humanus corporis (louse) for in vitro functional assays 6, 7, 8, 26, 27. PINK1 displays a high degree of conservation across species, with about 40–45% sequence identity in the cytosolic domain between human and insect orthologs (Fig EV1B).
Figure EV1. Domain structure and sequence alignment of PINK1.
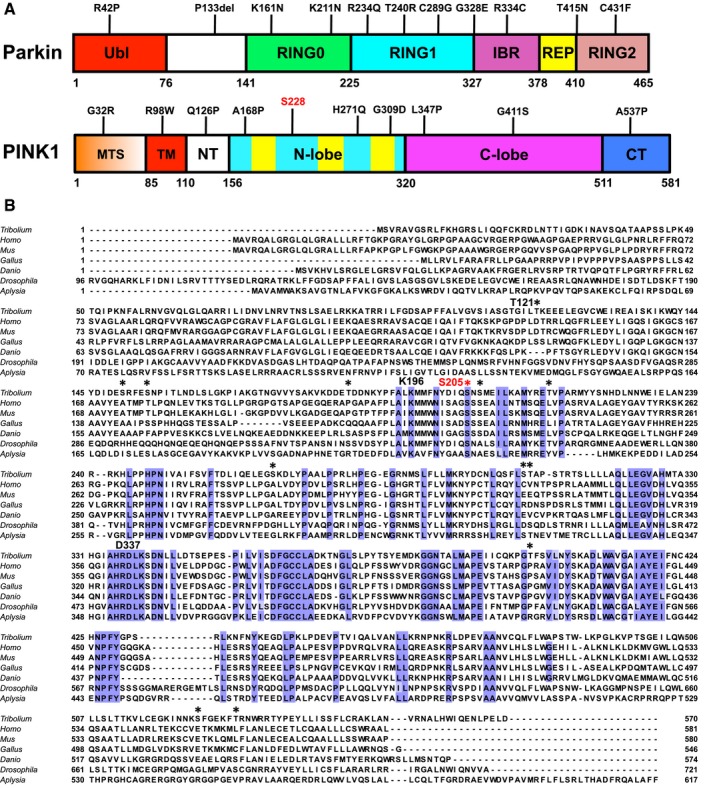
- Domain structure of human Parkin and PINK1. Selected PD mutations are shown on top, and residue numbers are shown below. The phosphorylation site Ser228 is highlighted in red.
- Multiple sequence alignment of PINK1 orthologs; Tribolium castaneum (Tc, red beetle), Homo sapiens (human), Mus musculus (mouse), Gallus gallus (chicken), Danio rerio (zebra fish), Drosophila melanogaster (fruit fly), and Aplysia californica (sea slug). The alignment shows residues conserved across all species (blue), sites of autophosphorylation found in purified TcPINK1 are indicated with *. Ser205 is colored in red, and active site residues Lys196 and Asp337 are indicated. The alignment was performed using the MUSCLE server (https://www.ebi.ac.uk/Tools/msa/muscle/) for the segment corresponding to TcPINK1121–570. The N‐terminal segments (corresponding to TcPINK11–120) have low conservation and were not aligned for better visual display of their lengths.
Multiple studies have indicated that PINK1 is autophosphorylated in its activated form on the mitochondria 3, 9, 28, 29. Three different phosphorylation sites have been found in different studies: Ser228 (located just upstream of the putative regulatory helix in the N‐lobe), Thr257 (located in the second insertion of the N‐lobe), and Ser402 (located in the putative kinase activation segment). Thr257 was not found to be required for PINK1 activity in terms of Parkin recruitment 9. Ser228 and Ser402 were found to be required for Parkin recruitment as serine‐to‐alanine mutations at these positions abolished Parkin recruitment to mitochondria under conditions of CCCP‐induced damage 29. Later, it was shown in another study that S402A rendered PINK1 temperature sensitive and phosphorylation at this position was not required for PINK1 activity 30. Nonetheless, the precise role of autophosphorylation at other sites on PINK1's kinase activity or substrate recognition is not understood.
Herein, we present our findings about the recognition and phosphorylation of Ub and Ubl by PINK1 using the Tribolium castaneum ortholog (TcPINK1). Using enzyme kinetic assays, we show that Ubl is a more favored phosphorylation substrate for PINK1 compared to Ub. Using two‐dimensional NMR and phosphorylation assays, we establish the binding site of PINK1 on Ubl. Furthermore, we show that TcPINK1 autophosphorylates in trans specifically at Ser205 (Ser228 in hPINK1) and that phospho‐Ser205 is required for substrate recognition and phosphorylation. Finally, hydrogen–deuterium exchange (HDX) mass spectrometry reveals that phosphorylation of Ser205 changes the conformation and dynamics of the C‐helix region and activation loop in the kinase domain.
Results
Parkin Ubl is the preferred substrate of PINK1
While multiple studies have examined the phosphorylation of Ub and Ubl by PINK1, the relative affinities of both substrates to PINK1 and preference as phosphorylation targets are poorly characterized. Despite the high protein fold conservation, and the conservation of many key residues and features such as Ser65 and the Ile44 hydrophobic patch, Ub and Parkin Ubl only share 32% sequence identity 31, which could result in a difference in affinity and phosphorylation kinetics. In order to achieve a better understanding of Ubl and Ub phosphorylation, we performed kinetic analyses of the phosphorylation of both substrates by TcPINK1. As opposed to its human ortholog, the kinase domain from TcPINK1 is soluble, can be expressed in an active form in E. coli 26, and can phosphorylate mammalian Parkin Ubl and Ub (Appendix Fig S1A). Moreover, we found that PD‐like mutations in TcPINK1, for the most part, abolish the Ub kinase activity (Appendix Fig S1C), as observed in hPINK1 for Parkin 32. Phosphorylated Ubl and Ub were loaded on phos‐tag gels to perform densitometry analysis (Appendix Fig S1A and B). The results show that Ub phosphorylation has a 10‐fold higher K m than Ubl phosphorylation (Fig 1A). This indicates that the Ubl may have a higher affinity for TcPINK1, assuming that k cat is greater than k off. While the k cat for Ub is twofold higher than for the Ubl, the overall catalytic efficiency (k cat/K m ratio) for Ubl is more than fourfold higher than Ub (0.22 versus 0.05). This marked preference for Ubl was also maintained in full‐length TcPINK1, suggesting that residues upstream of the kinase domain do not contribute significantly to substrate selectivity (Appendix Fig S1D). Overall, the results of the kinetics indicate that the Ubl domain of Parkin is a preferred substrate for TcPINK1 compared to Ub.
Figure 1. Parkin Ubl is the preferred substrate for PINK1.
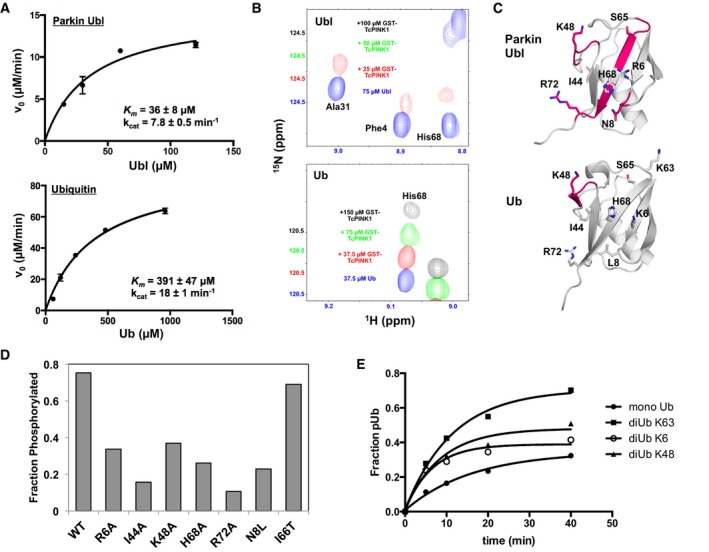
- Enzyme kinetics of Ub and Ubl phosphorylation by TcPINK1. 5‐min phosphorylation assays were conducted with different concentrations of Ub or Ubl with GST‐TcPINK1(143–570), visualized on phos‐tag gels and modeled to the Michaelis–Menten equation. The given graphs represent global fits to data collected from two sets of reactions for both Ub and Ubl performed independently. Bars represent the mean ± SD (n = 2).
- 1H‐15N TROSY‐HSQC NMR spectra of 2H,15N‐labeled Ubl or Ub alone (blue), or titrated with different concentrations of GST‐TcPINK1 (red, green, and black). The spectra are shifted on the y‐axis to better visualize the decrease in the peak intensity (there is no chemical shift displacement).
- Structure of Parkin Ubl (PDB 4ZYN) and Ub (PDB 1UBQ) showing regions (pink) with backbone amides experiencing greatest loss of signal upon addition of 25 μM and 150 μM GST‐TcPINK1, respectively.
- Fractional levels of phosphorylation of WT and point mutants of Ubl. The phosphorylation assays were performed with 30 μM GST‐Ubl and 2 μM GST‐TcPINK1 and loaded on phos‐tag gels followed by densitometry (n = 1). Original gels and similar experiments performed under different conditions can be found in Fig EV3.
- Phosphorylation time course of Ub or Ub2 (K6‐, K48‐, or K63‐linked). Experiments were performed with 30 μM substrate and 2.5 μM GST‐TcPINK1 and analyzed by intact mass spectrometry (n = 1). Original data shown in Appendix Fig S3.
NMR studies reveal how PINK1 engages its substrates
To determine how PINK1 engages its substrates, we titrated 2H,15N‐labeled Ub or Ubl with GST‐TcPINK1 and recorded 1H‐15N TROSY‐HSQC spectra. Upon binding, the fully protonated PINK1 should induce line‐broadening in the Ubl resonances that are in proximity to PINK1, while other resonances should remain sharp in spite of the decreased rotational tumbling via TROSY selection. We indeed observe a selective loss of signal with increasing GST‐TcPINK1 concentrations (Figs 1B and EV2A) and not with free GST (Appendix Fig S2A). Consistent with our observations that Ubl is a preferred substrate of PINK1 compared to Ub, loss of signals is observed at a TcPINK1/Ubl concentration ratio of 1:3 whereas signal loss is registered at much higher TcPINK1/Ub ratio, indicating a weaker binding to Ub.
Figure EV2. TROSY NMR analysis of TcPINK1 binding to Ubl and Ub.
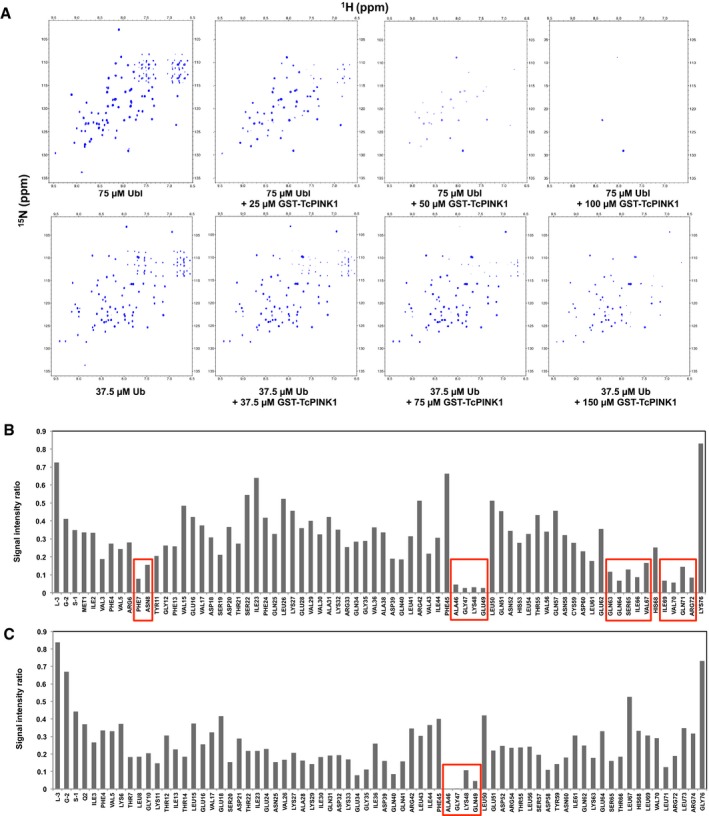
- Full 1H‐15N TROSY NMR spectra of 2H,15N‐labeled Ubl or Ub with different concentrations of GST‐TcPINK1121–570 (corresponding to Fig 1B).
- Bar graph of peak height ratios between the 75 μM Ubl + 25 μM GST TcPINK1121–570 titration point and 75 μM Ubl for all the backbone amides from the H1‐N15 TROSY experiment shown in (A). Amides with the lowest value of peak height ratio are marked by red boxes.
- Bar graph of peak height ratios between the 37.5 μM Ub + 150 μM GST‐TcPINK1121–570 and 37.5 μM Ub for all the backbone amides from the H1‐N15 TROSY experiment shown in (A). Amides with the lowest value of peak height ratio are marked by red boxes.
Site‐specific analysis of signal loss for the titrations with Ubl revealed that the fastest signal loss occurs at the backbone amides in four distinct regions: residues 7–8, 45–49, 62–66, and 69–72 (Figs 1C and EV2B). This implies that the binding site of PINK1 is located on the β‐sheet face of Ubl and involves the solvent‐exposed side chains of Asn8, Ile44, Ser65, His68, Val70, and Arg72. With the exception of Asn8—a leucine in Ub—these residues are conserved between Ub and Ubl. We observed a more widespread broadening in the titration with 2H,15N‐labeled Ub (Fig EV2C). We attribute this primarily to relaxation broadening from residual 1H in Ub, combined with the slower tumbling induced by oligomerization that takes place in TcPINK1 at high concentrations (required to saturate the weaker binding), or to chemical exchange broadening arising from widespread structural changes in Ub in the PINK1‐bound form [33; see Discussion]. Nevertheless, we could unambiguously identify the amides of residues 46–49 in Ub as undergoing the fastest signal loss upon TcPINK1 binding (Fig 1C), which also show selective broadening in the Ubl.
To confirm the binding site derived from the NMR experiments, we mutated residues in these regions of the Ubl to alanine and found that they display decreased phosphorylation by both GST‐TcPINK1121–570 and GST‐TcPINK1143–570 compared to WT Ubl (Figs 1D and EV3A and B). In particular, I44A and H68A displayed the most robust reduction in phosphorylation, followed by R72A, R6A, and K48A. These mutations did not unfold the Ubl, since 1H NMR spectra of all the mutants show a characteristic peak at −0.2 ppm, corresponding to the side‐chain methyl Cδ2 of Leu61 (Fig EV3C). This residue is in the hydrophobic core of the Ubl domain and located “above” the aromatic ring of Phe45, conferring a shielded chemical shift 34. To investigate the determinants of a more favorable binding for Ubl compared to Ub, we mutated residues in the Ubl‐binding site corresponding to different residues in Ub and performed phosphorylation assays. While only a minor decrease in phosphorylation was seen for the I66T Ubl, N8L underwent a robust decrease in phosphorylation compared to WT Ubl (Fig 1D). To confirm the role of Asn8 in increasing its interaction with PINK1, we mutated ubiquitin to the corresponding residues in the Ubl of Parkin. Phosphorylation assays show that the L8N mutation modestly increases activity compared to Ub WT (Fig EV3D). Moreover, mutations K63Q and E64Q, adjacent to the phosphorylation site, also increased phosphorylation.
Figure EV3. Phosphorylation assays with Ubl and Ub mutants confirm the PINK1 binding site.
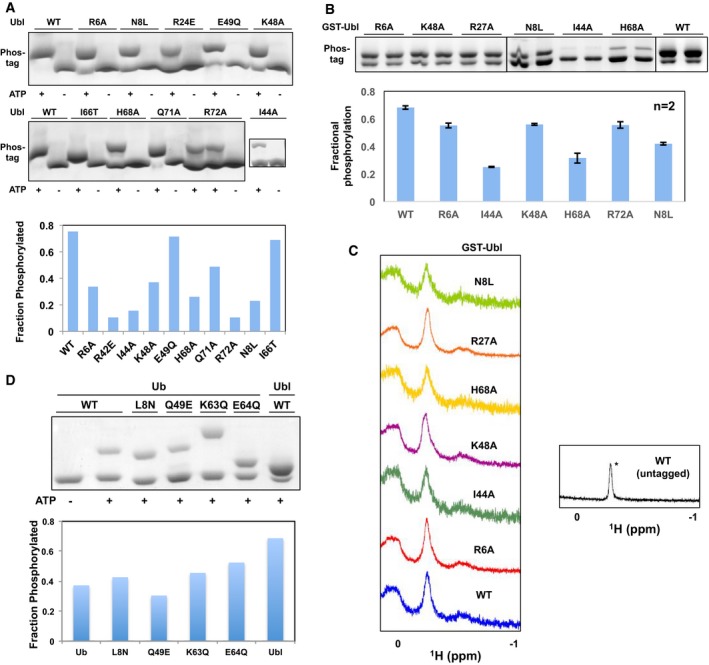
- (Left) Phos‐tag gels of phosphorylation assays shown in Fig 1D. (Right) Fractional levels of phosphorylation of WT and point mutants of Ubl (left). The phosphorylation assays were performed with 30 μM of GST‐Ubl and 2 μM GST‐TcPINK1143–570 and loaded on phos‐tag gels followed by densitometry (n = 1).
- (Top) Phos‐tag gels of phosphorylation assays and (bottom) fractional levels of phosphorylation of WT and point mutants of Ubl. The phosphorylation assays were performed with 12.5 μM of GST‐Ubl and 2 μM GST‐TcPINK1121–570 and loaded on phos‐tag gels followed by densitometry (n = 2). Error bars represent mean ± range of two independent phosphorylation experiments, loaded on the same gel.
- 1D proton NMR spectra of 30 μM GST‐Ubl WT or mutants, or untagged Ubl showing the characteristic Leu61 peak at −0.2 ppm (*) observed in all the mutants shown.
- (Top) Phos‐tag gels of phosphorylation assays and (bottom) fractional levels of phosphorylation of mutants of point of Ub made by mutating residues in Ub to corresponding residues in Ubl. The assays were conducted with 30 μM of GST‐Ubl and 0.5 μM GST‐TcPINK1121–570 for 30 min (n = 1).
We also noticed that three lysine acceptor sites for polyubiquitin chains are located at the PINK1‐binding site (Lys6, Lys48, and Lys63). We thus performed a phosphorylation time course with K6‐, K48‐, and K63‐linked diubiquitin (Ub2). All Ub2 chains were singly phosphorylated at rates slightly faster than Ub (Fig 1E and Appendix Fig S3). However, the chains differed in their ability to be doubly phosphorylated. Notably, only a single phosphorylation site could be observed in K6‐Ub2, suggesting K6 linkage interferes with PINK1 binding, as well as K48 to a lesser degree. This is consistent with both Arg6 and Lys48 in the Ubl being important for PINK1 binding. In conclusion, our results show that PINK1 engages its substrates through a common interface that comprises Ile44, Lys48, His68, and Arg72, while Asn8, Gln63, and Gln64 in the Ubl mediate interactions that make it a preferred substrate for PINK1.
PINK1 competes with Parkin RING1 and SH3 for Ubl binding
In the structure of full‐length Parkin, the Ubl domain binds to the RING1 domain via the Ile44‐centered site 18, 35. The Parkin Ubl also interacts with the SH3 domain of endophilin‐A1 (referred to as SH3 from here onwards) via the same Ile44 surface 34. Comparing our Parkin Ubl NMR and mutagenesis results to these previous studies, we find that the Ubl:RING1 and Ubl:SH3 interactions involve the same residues implicated in binding PINK1 (Fig 2A). Hence, we hypothesized that Parkin RING1 and SH3 would compete with PINK1 for binding Ubl. To test this hypothesis for Parkin, we conducted enzyme kinetics assays with full‐length WT or L266K Parkin. We have previously shown that mutation of Leu266 disrupts the interface of RING1 for Ubl at the Ile44 patch 18. Consistent with this, our enzyme kinetics experiments reveal that L266K Parkin is phosphorylated by TcPINK1 with a K m of 31 ± 7 μM, similar to the value obtained for the Ubl domain alone (Fig 2B). Phosphorylation of WT Parkin was slower than L266K, and the concentration range did not enable a reliable estimation of K m. This result reinforces our previous observation that the Ubl is not accessible to PINK1 due to its engagement with RING1 18.
Figure 2. PINK1 shares binding site on Ubl with Parkin RING1 and endophilin‐A1 SH3.
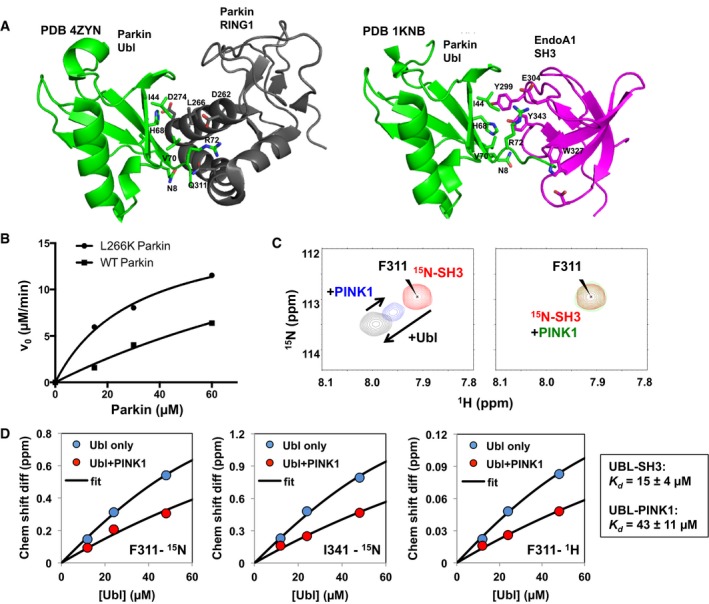
- Binding interface of Parkin Ubl (green) and RING1 domain (black; PDB 4ZYN), and Parkin Ubl (green) and endophilin‐A1 SH3 (magenta; PDB 1KNB).
- Enzyme kinetics of the phosphorylation of full‐length Parkin WT or L266K. 5‐min assays were performed with different concentrations of Parkin WT or L266K with GST‐TcPINK1 (143‐570) and visualized using phos‐tag gels.
- 1H‐15N HSQC NMR spectra of competition assays between 15N‐labeled endophilin‐A1 SH3 domain and GST‐TcPINK1 for Ubl binding. The peaks represent backbone amide signals from the spectra of 62 μM SH3 alone (red), following the addition of 48 μM Ubl (black), 200 μM GST‐TcPINK1 WT (green), or 48 μM Ubl and 200 μM GST‐TcPINK1 WT (blue).
- Chemical shift differences for different 1H‐15N SH3 cross peaks plotted as a function of Ubl concentrations (12, 24, 48 μM), with and without 200 μM GST‐TcPINK1. Data from 10 peaks were fitted to an exact competition model, with the affinity constants displayed in the boxed area (average ± SD).
The competition hypothesis with SH3 was tested by performing NMR titrations of 15N‐labeled SH3 domain with Ubl and TcPINK1 as a competitor (Fig 2C). As reported previously, addition of Ubl to 15N‐SH3 induces chemical shifts perturbations that reflect complex formation 34. Addition of WT TcPINK1 to 15N‐SH3 and Ubl caused a decrease in the peak shift indicating that it competes with SH3 for Ubl binding. The chemical shift changes from these titrations points were fitted to an exact binding competition model 36, to calculate a K d of 15 ± 4 μM for the Ubl–SH3 interaction and 43 ± 11 μM for the Ubl–PINK1 interaction (Fig 2D). The K d for the Ubl–SH3 interaction is similar to the one reported previously 34. Moreover, the equilibrium dissociation constant of the Ubl–PINK1 interaction is similar to the K m value from the kinetics experiment reported above (Fig 1A). Thus, the interaction of the Parkin Ubl with endophilin‐A1 SH3 domain and PINK1 are mutually exclusive, and the competitive nature of these interactions allows us to estimate the K d for the Ubl:TcPINK1 interaction.
TcPINK1 autophosphorylates in trans at Ser205
The ability of kinases to interact with their substrates is often modulated by autophosphorylation 37, and thus, we sought to better characterize PINK1 autophosphorylation. Multiple sites of phosphorylation for PINK1 have indeed been reported in the literature 26, 29. Mass spectrometry analysis of intact WT TcPINK1 revealed multiple peaks of different intensities greater than the theoretical mass of WT TcPINK1 and 80 Da apart from each other, implying that there were at least eight different phosphorylation sites (Fig EV4A). No autophosphorylation was detected for the TcPINK1 D337N kinase‐dead mutant, confirming that the observed phosphorylation results from autocatalytic reactions. LC‐MS/MS analysis of a tryptic digest from WT TcPINK1 revealed major phosphorylation sites (with high identification scores) at S‐1 (linker), Ser154, Thr186, Ser205, Thr218, Ser267, and Thr530, as well as a number of other minor sites (Fig 3A and Table EV1).
Figure EV4. Mass spectrometry analysis of TcPINK1 autophosphorylation.
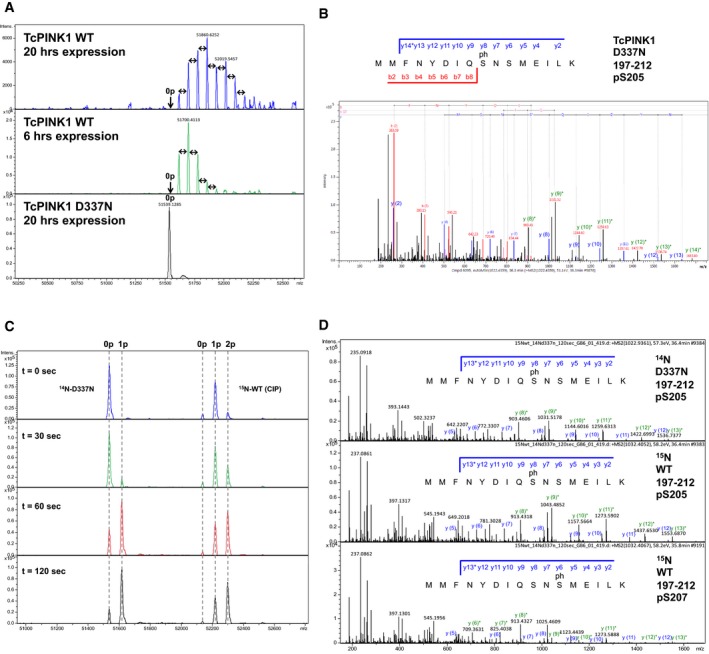
- Intact mass spectra of TcPINK1121–570 WT or D337N expressed for different times in E. coli. The double‐edged arrows on the spectra are used to indicate a difference of 80 Da (1 phosphorylation) between peaks. “0p” indicates the theoretical mass of the unphosphorylated protein.
- MS/MS spectrum for the peptide 197‐212 of TcPINK1121–570 D337N, phosphorylated by GST‐TcPINK1121–570 WT (see Fig 3C). The b and y series indicate that phosphorylation takes place at Ser205. The y* series (green) show neutral loss of a phosphate group (H3PO4, −97.7 amu).
- Intact mass spectra of the time course phosphorylation assay of TcPINK1 D337N with CIP‐treated 15N‐TcPINK1 WT (corresponding to the plot in Fig 3D).
- MS/MS spectrum for the peptide 197–212 of TcPINK1121–570 14N‐D337N and 15N‐WT, after 2‐min phosphorylation (see Fig 3E). The b and y series indicate that phosphorylation takes place at Ser205 for the 14N and 15N‐labeled peptides eluting at 36.5 min, and Ser207 for the 15N‐labeled peptide eluting earlier at 35.8 min. The y* series (green) show neutral loss of a phosphate group (H3PO4, −97.7 amu). The different phosphorylation sites give rise to y(6) and y(7) ions with different masses.
Figure 3. TcPINK1 autophosphorylates in trans at Ser205.
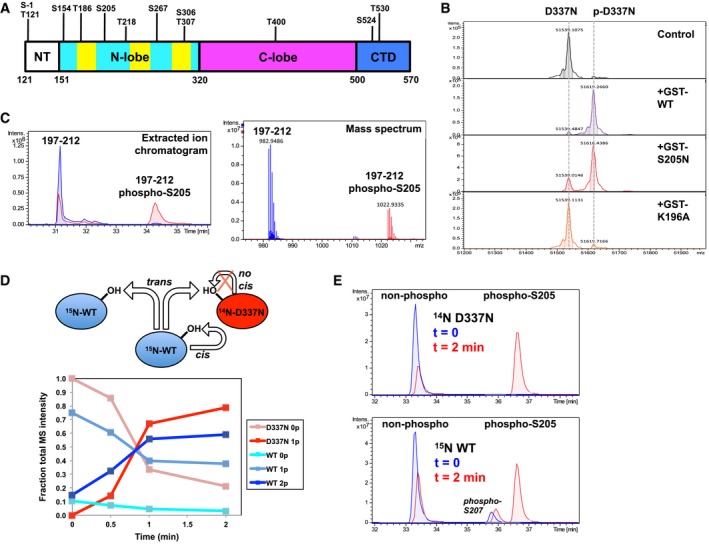
- Schematic diagram of TcPINK1 WT (121–570) showing the location of different autophosphorylation sites in the protein expressed and purified in E. coli. “S‐1” refers to the phosphorylation at the remnant serine from the 3C cleavage of the N‐terminal GST tag.
- Intact mass spectra of TcPINK1 D337N before and after phosphorylation with GST‐tagged WT, S205N or K196A. The assays were performed with 25 μM substrate and 0.5 μM enzyme for 5 min.
- Extracted ion chromatograms (top) and precursor ion spectrum (bottom) of a.a. 197–212 from TcPINK1 D337N, before (blue) and after (red) phosphorylation by GST‐TcPINK1 WT. The two peaks correspond to the elution of the non‐phosphorylated and Ser205‐phosphorylated peptide (see MS/MS, Fig EV4B).
- Time course of a 2‐min phosphorylation assay with 1 μM TcPINK1‐D337N and 1 μM CIP‐treated 15N‐labeled TcPINK1 WT. Peak intensity from intact mass spectra of different phosphorylated species (0, 1, or 2 sites) is plotted as a function of time. The diagram above displays how WT PINK1 can theoretically phosphorylate in cis or in trans, whereas kinase‐dead D337N can only be phosphorylated in trans. The rate of WT phosphorylation is the sum of cis and trans phosphorylation.
- LC‐MS/MS analysis of the digests of the 0 and 2 min time points from the time course shown in (D), demonstrating phosphorylation at Ser205. The phosphorylation sites were identified by MS/MS (see Fig EV4D).
Ser205 (Ser228 in human PINK1) is located at the base of the putative regulatory αC‐helix in the N‐lobe of the kinase domain and is the only phosphorylation site that is conserved across all PINK1 orthologs (Fig EV1B). Moreover, we found that a shorter induction time for protein expression in E. coli leads to a reduced number of phosphorylation sites (Fig EV4A). We thus hypothesized that most sites except Ser205 arise from slow non‐specific co‐translational phosphorylation by overexpressed TcPINK1 during induction and thus may not be functionally relevant. To test this, we performed short controlled autophosphorylation assays in vitro using WT GST‐TcPINK1121–570 and untagged D337N TcPINK1121–570 and analyzed the product by mass spectrometry. Strikingly, we observed rapid addition of a single phosphate on the D337N mutant (Fig 3B). LC‐MS/MS analysis of the trypsin digest of the reaction mix revealed a single phosphorylation site at Ser205 (Figs 3C and EV4B, and Table EV2). In addition to revealing the potential importance of Ser205, this experiment also uncovered that TcPINK1 phosphorylates in trans. To assess the relative contribution of intramolecular (cis) versus intermolecular (trans) autophosphorylation in TcPINK1, we prepared dephosphorylated WT TcPINK1 by incubating the recombinant protein with calf intestinal phosphatase (CIP) and then separated CIP from TcPINK1 using anion‐exchange chromatography (Appendix Fig S4). While the reaction did not completely remove every phosphorylation site, we were able to dephosphorylate Ser205, demonstrating that this site is solvent‐accessible. We then performed short (0, 0.5, 1, and 2 min) autophosphorylation assays with equimolar amounts of 15N‐labeled CIP‐treated WT TcPINK1 and unlabeled (14N) D337N TcPINK1 and analyzed the reaction mix with mass spectrometry. The unlabeled D337N mutant acts as an independent reporter of trans phosphorylation, while phosphorylation of the 15N‐labeled WT can theoretically arise from a combination of cis and trans reactions. Mass spectra of the intact proteins show rapid phosphorylation of the D337N mutant, with 70% phosphorylation at 1 min (Figs 3D and EV4C). The rate of WT phosphorylation (build‐up of the doubly phosphorylated species, stemming from the abundant monophosphorylated peak) was similar and not faster, indicating that cis phosphorylation is negligible. Trypsin digest and LC‐MS/MS analysis confirmed that the phosphorylation occurs on Ser205 on both proteins (Figs 3E and EV4D). Thus, our data demonstrate that TcPINK1 autophosphorylates in trans at Ser205.
Phosphorylation at Ser205 is required for substrate binding
Given the preeminence of Ser205 phosphorylation, we examined the role of this residue in Ub/Ubl substrate recognition. We thus generated S205A and S205N mutants of TcPINK1 and tested its autophosphorylation and ubiquitin kinase activity. The serine‐to‐asparagine mutant was generated in order to establish that the effect was indeed due to lack of phosphorylation and not due to the removal of a hydrophilic side chain that might destabilize the protein. While both recombinant S205A and S205N proteins were phosphorylated upon expression in E. coli (Appendix Fig S5A), suggesting they retained catalytic activity, they both are impaired in their ability to phosphorylate Ub and Ubl (Fig 4A). Since the Ubl substrate has a lower K m than Ub, the WT TcPINK1121–570 phosphorylates nearly all of the Ubl after 5 min, but only 50% of Ub at the same concentration after 30 min; the S205 mutations then result in partial phosphorylation of the Ubl (about 20%) and no observable Ub phosphorylation. To exclude the possibility that the catalytic activity of the S205 mutants may be impaired, we performed short transphosphorylation assays using the D337N mutant as a substrate (Fig 3B). The GST‐TcPINK1 S205N mutant (3rd panel) was able to phosphorylate the D337N mutant similarly to WT GST‐TcPINK1 (2nd panel), confirming that the S205N mutant retained catalytic activity.
Figure 4. Phosphorylation of Ser205 is required for Ubl and Ub binding.
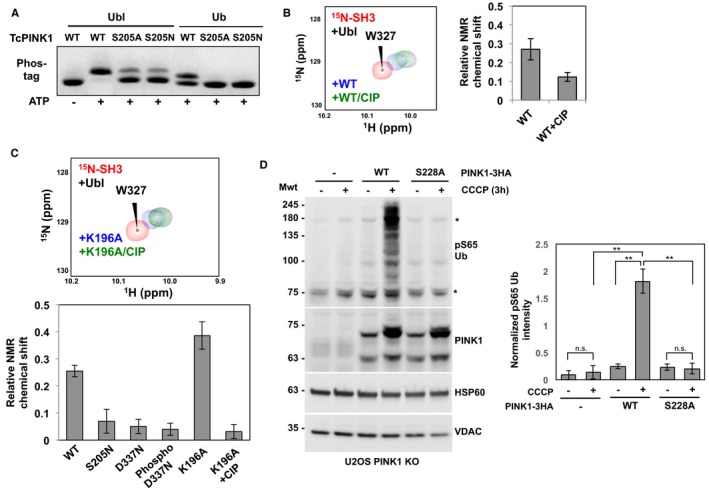
- Phosphorylation of Ub and Ubl by GST‐TcPINK1 WT, S205A, or S205N. The assays were carried out with 30 μM Ubl (for 5 min) or Ub (30 min) with 0.5 μM enzyme and visualized on phos‐tag gels.
- (Left) 1H‐15N HSQC NMR spectra of competition assays between 15N‐labeled endophilin‐A1 SH3 domain and GST‐TcPINK1 for Ubl. The peaks represent the signals from the spectra of 40 μM SH3 alone (red), following the addition of 12 μM Ubl (black), 12 μM Ubl and 100 μM GST‐TcPINK1 WT (blue), or 12 μM Ubl, 100 μM GST‐TcPINK1 WT and CIP (green). (Right) Average weighted chemical shift perturbations of nine different peaks of 15N‐SH3 in response to the addition of GST‐TcPINK1 WT with or without CIP and Ubl. The levels of these changes were calculated relative to the shift upon the addition of only Ubl to 15N‐SH3. The bars represent the mean ± SD of the nine peaks (n = 1).
- NMR competition assay similar to (B), except that 48 μM Ubl was used, with 40 μM 15N‐SH3 and 100 μM GST‐TcPINK1 carrying different mutations or treated with CIP. The bars represent the mean ± SD of the same peaks as in (B) (n = 1). The full spectra are shown in Appendix Fig S6.
- (Left) Immunoblots for phospho‐Ser65 Ub, PINK1, HSP60, and VDAC. U2OS PINK1 knock‐out cells were transfected with WT‐3HA or S228A‐3HA PINK1 and treated with 10 μM CCCP for 3 h. The lysates were analyzed by immunoblotting with the mentioned primary antibodies. (Right) Bar graphs showing the levels of phospho‐S65 Ub quantified from the immunoblots. The amounts were normalized relative to the intensity of HSP60. Bars represent the mean ± SD (n = 3). **P < 0.01; n.s., non‐significant (one‐way ANOVA with Tukey's post hoc HSD test).
The reduced ubiquitin kinase activity of the S205A and S205N mutants implies that Ser205 phosphorylation might be implicated in substrate binding. We therefore used our NMR competition assays with 15N‐SH3 to study the effect of autophosphorylation on Ubl binding. We observed that following treatment with CIP, WT TcPINK1 lost its ability to compete with 15N‐SH3 for Ubl binding implying that loss of phosphorylation reduced binding (Fig 4B). Furthermore, we observed that the TcPINK1 mutants D337N and S205N were significantly impaired in their ability to compete with 15N‐SH3 (Fig 4C and Appendix Fig S6). Conversely, we expected that the phosphorylation of the D337N mutant would rescue its ability to bind the Ubl. However, we observed that trans phosphorylated D337N could not compete with SH3 for Ubl binding. A possible explanation for this result is that Asp337 mediates a contact with the substrate; indeed, the catalytic aspartate typically mediates a hydrogen bond with the substrate's target hydroxyl group 37. We thus produced another kinase‐dead mutation by mutating Lys196, an invariant kinase residue that mediates a salt bridge in the ATP‐binding site. The K196A mutant was phosphorylated at a single site (Ser205) after purification (Appendix Fig S5A and Table EV3), but demonstrated little kinase activity toward Ub/Ubl (Appendix Fig S5B) or toward TcPINK1 D337N (Fig 3B), suggesting it is impaired in its catalytic activity. Yet, Ser205‐phosphorylated GST‐K196A was able to bind and compete with 15N‐SH3 for Ubl binding, and the interaction was abolished by CIP treatment (Figs 4C, Appendix Figs S5C and S6). To confirm that non‐phosphorylated TcPINK1 binds weakly to Ubl, we have performed TROSY NMR titrations of 2H,15N‐Ubl with GST‐TcPINK1 D337N, and a minor peak loss was observed compared to WT (Appendix Fig S2B). This result confirms that Ser205 phosphorylation is essential for Ubl binding.
Given that Ser205 is invariant across all PINK1 orthologs, we next sought to determine whether the equivalent Ser228 residue in human PINK1 would also be required for substrate recognition. We therefore monitored endogenous ubiquitin phosphorylation in U2OS PINK1−/− cells transfected with HA‐tagged wild‐type or S228A hPINK1, under the control of a partially deleted CMV promoter to emulate endogenous PINK1 expression 29. In cells, pUb appears as bands above 75 kDa in response to CCCP treatment when full‐length WT PINK1 builds up (Fig 4D, lane 4; Appendix Fig S7). Strikingly, no pUb can be detected with the S228A mutant (Fig 4D, lane 6). Thus, Ser228 in hPINK1 is required for ubiquitin phosphorylation.
Hydrogen–deuterium exchange reveals structural role played by Ser205 phosphorylation
Given the striking difference in Ubl binding induced by Ser205 phosphorylation, we sought to investigate the impact of this modification on the structure and dynamics of PINK1 by performing hydrogen–deuterium exchange experiments coupled to mass spectrometry (HDX‐MS). For a more comprehensive mapping of the HDX‐MS results, we first analyzed the 3D structure of D337N‐TcPINK1121–570 using small‐angle X‐ray scattering (SAXS). Two groups recently reported crystal structures of PINK1 from insects: (i) apo TcPINK1150–570 with a partial deletion of insert 3 and a S205E mutation 38; (ii) Pediculus humanus corporis (Ph)PINK1143–575 in complex with UbTVLN and a nanobody, with phosphorylation at site equivalent to Ser205 in TcPINK1 39. The two structures were used as templates to model the structure of TcPINK1121–570 with restraints from SAXS data for the monomer (Fig 5A and Appendix Fig S8). The two structures differ in the orientation and structure of inserts 2 & 3 and the C‐helix, which is kinked in the PhPINK1 structure (Fig 5A). The PhPINK1‐derived model fits the data well, with an average chi‐square of 2.8 ± 0.4 (Fig 5B). By contrast, the TcPINK1‐derived structure, modeled with a disordered insert 3, does not fit well. To determine the contribution of insert 3 to the scattering fit, a hybrid model was made with the TcPINK1 structure to which insert 3 from PhPINK1 was appended (Fig 5A). The hybrid model fits the SAXS data better than the original TcPINK1 model, suggesting that insert 3 adopts a compact configuration.
Figure 5. HDX reveals structural changes in TcPINK1 resulting from Ser205 phosphorylation.
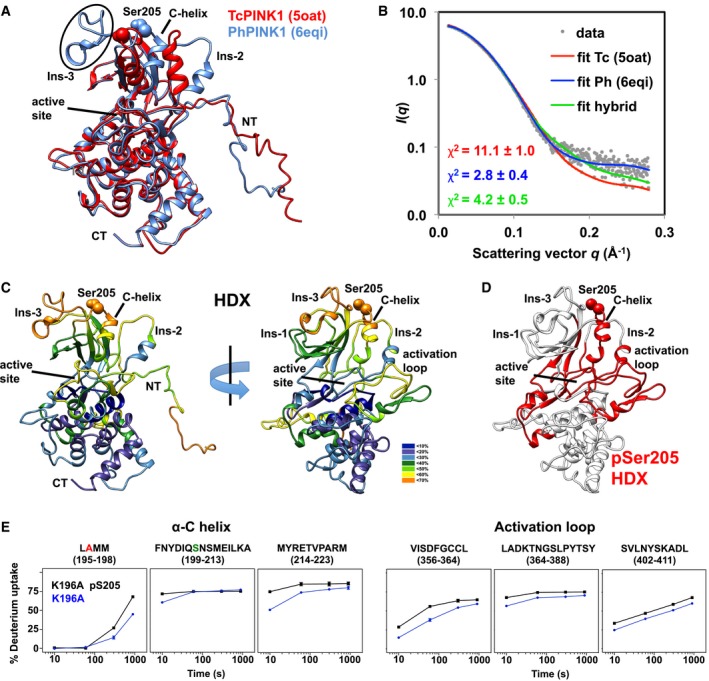
- SAXS structural model of TcPINK1121–570, derived from the TcPINK1 (pdb 5oat, red) or the PhPINK1 (pdb 6eqi, blue) crystal structures 38, 39. NT and CT indicate the N‐ and C‐terminus of the protein. The side chain of Ser205 is shown as spheres. The position of insert 3 is circled. The two structures were superposed by minimizing the Cα rmsd for a.a. 151–570 (2.65 Å).
- Experimental SAXS data (gray dots) and computed scattering profiles of the lowest energy TcPINK1121–570 models derived from the TcPINK1 and PhPINK1 structures, as well as a hybrid consisting of the TcPINK1 structure to which insert 3 from PhPINK1 was appended. The average chi‐square values for 20 models in the ensemble (± SD) are shown as an inset.
- HDX data displayed on TcPINK1151–570 structural model. The legend indicates the coloring scheme for % deuteration at 10 s.
- Regions of TcPINK1151–570 showing increased deuteration rates in the Ser205‐phosphorylated form are colored in red.
- Plots of % deuterium uptake of the αC‐helix and activation loop region of K196A (p205) (black) and K196A (blue) over a course of 1,000 s. The bars represent deviations in uptake across three independent experiments.
The wild‐type TcPINK1 being heterogeneously phosphorylated, we resorted to characterize the Ubl‐binding K196A mutant by HDX‐MS, in its dephosphorylated and Ser205‐phosphorylated forms. The proteins were deuterated for different amount of time after which online pepsin cleavage and mass spectrometry were performed, and the percentage uptake of deuterium by each peptide was analyzed. The results are shown in the form of a color‐coded heat map (Fig EV5) and are mapped on the PhPINK1‐derived TcPINK1121–570 model (Fig 5C). Overall, the exchange rates vary considerably in different regions. Notably, the N‐terminal region (a.a. 121–160) appears very dynamic, which is consistent with the SAXS ensemble that displays considerable flexibility in this region (Appendix Fig S8C). By contrast, the C‐lobe and unique C‐terminal extension (a.a. 490–570) have strongly protected areas that match predicted α‐helices. The three inserts that are unique to PINK1 also display variable dynamics, with insert 3 being very dynamic, and inserts 1 and 2 being relatively more ordered.
Figure EV5. HDX analysis of the effect of S205 phosphorylation on K196A.
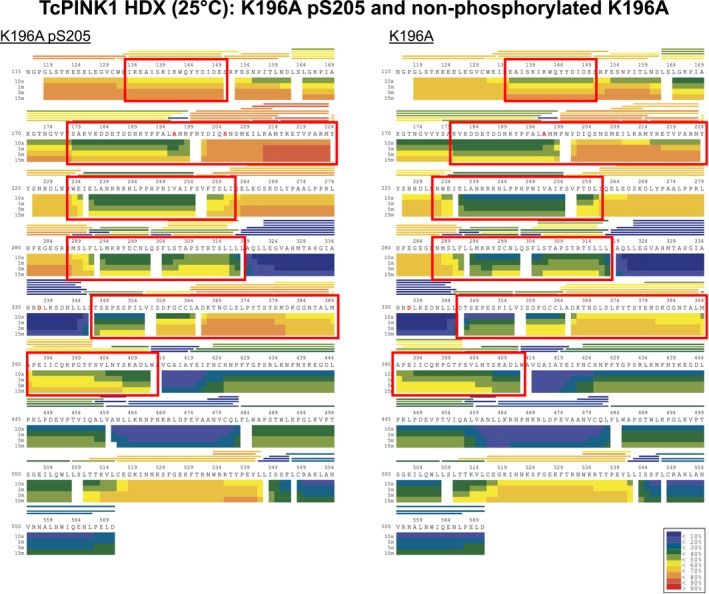
Heat maps of K196A (phosphorylated at Ser205) before and after CIP treatment, representing the level of deuterium uptake over time by different regions of the proteins. Regions of the heat maps enclosed in red boxes show significant differences in deuterium uptake between the two proteins. The small inset on the bottom right contains the color‐coding key for the heat map, with blue and red indicating low and high deuteration rates, respectively.
Comparison of HDX‐MS data between the phosphorylated and dephosphorylated K196A mutant reveals significant differences localized to five specific areas (Fig 5D and E). In particular, both the C‐helix and activation loop show higher deuteration rates in the phosphorylated form. This suggests that pSer205 changes the conformation and solvent accessibility of these two structural elements, which are involved in nucleotide binding and participate in the general catalysis of phospho‐transfer from ATP to the substrate hydroxyl group. Intriguingly, we also observe higher deuteration rates in other areas unique to PINK1, such as the flexible NT linker and insert 2. The latter is in close proximity to the C‐helix and thus might be influenced by conformational changes induced in the C‐helix. However, no differences were observed in the C‐terminal segment and most of the C‐lobe. Therefore, Ser205 phosphorylation induces specific conformational changes in PINK1, localized primarily near the active site of the enzyme.
Discussion
In this study, we have explored the basis of the ubiquitin kinase activity of PINK1 using its ortholog from Tribolium castaneum from the perspective of substrate (Ub and Ubl) and the enzyme. Using enzyme kinetics, we found that the isolated Parkin Ubl is a preferred substrate of PINK1 and that this difference is largely dictated by a stronger binding affinity toward the Ubl. The less favorable K m for Ub phosphorylation makes the phosphorylation of free monomeric Ub in the cell less likely as proteomics studies indicate that cytosolic concentrations of free Ub are below 20 μM 40. Given that the Ubl is not readily accessible to PINK1 in the full‐length Parkin, this indicates that the most likely early substrate of TcPINK1 is Ub tethered on OMM proteins that provide PINK1 with high local concentrations of Ub. This is supported by our own and others' observations that pUb appears as bands above 75 kDa in mammalian cell lines (Fig 4D) 21, 41. The phosphorylation of these mitochondrially anchored Ub serves to localize Parkin to the mitochondria and trigger an allosteric change in Parkin that enables its phosphorylation 21.
Moreover, we also show that TcPINK1 has a preference for one of the subunits in Ub2; given that the side chains of K6, K48, and K63 are likely involved in the interaction with PINK1, we can infer that PINK1 would preferentially phosphorylate the distal subunit of a polyUb chain. Indeed, we observed only a singly phosphorylated species for K6‐linked Ub2 after 40 min. The slightly faster phosphorylation of Ub2 compared to mono‐Ub could be attributed to avidity effects, but overall, the kinetics are similar. Although one study showed full phosphorylation of K6‐linked Ub4 27, their experiments were performed for 180 min with higher enzyme and ATP concentrations. A more recent study by the same group corroborates our findings by showing that K6‐Ub2 phosphorylation is biphasic, because phosphorylation of the distal moiety is favored 42. Given that different types of polyUb linkages are found on mitochondria following depolarization, including K6, K48, and K63 43, 44, we can imagine that the distal moiety of these chains could become a prime substrate for hPINK1, if the moiety is within its reach. We do not know whether pUb that appears on mitochondria prior to Parkin recruitment is on the distal end of a polyUb chain, or simply single pUb tethered to OMM proteins (also “distal”, or simply Gly76‐conjugated). Given that pUb has a high affinity for Parkin, both would be efficient in recruiting Parkin.
Our Ub‐/Ubl‐binding studies employing TROSY NMR confirmed the difference in K m from the phosphorylation kinetic assays and allowed us to show that the Ubl interacts with TcPINK1 mostly through conserved residue positions including the I44 hydrophobic patch, which also mediates interactions with most Ub‐interacting domains. Asn8 in Ubl was found to play an important role in dictating its higher affinity. The residue forms important contacts in complexes of the Ubl with RING1 and the SH3 domain of endophilin‐A1 (Fig 2A). The shared binding site on Ubl for Parkin RING1 and TcPINK1 implied that these interactions must be mutually exclusive. We established this by showing that L266K Parkin is phosphorylated with kinetics similar to free Ubl while WT Parkin is much more weakly phosphorylated. Hence for efficient phosphorylation of Parkin on mitochondria, the Ubl must dissociate from RING1 to be more accessible by PINK1. This conformational change is achieved by binding of Parkin to pUb on mitochondria 18, 21, 45.
While this was not our primary object of study, the competition between PINK1 and endophilin‐A1 for binding to Parkin Ubl could have biological significance; endophilin‐A1 could decrease PINK1‐mediated phosphorylation of Parkin by preventing binding to Parkin. Alternatively, this could recruit endophilin‐A1 to mitochondria via Parkin. Endophilin‐A1 has recently been shown to be phosphorylated by LRRK2, a process that would regulate macroautophagy in synaptic terminals 46. Moreover, the endophilin‐A1 gene has recently been identified as a risk locus for PD 47. However, exactly how endophilin‐A1 regulates Parkin remains unclear. Regardless of the biological relevance, the shared binding site with SH3 allowed us to design NMR‐based competitive binding experiments to calculate the binding affinity of Ubl for TcPINK1, which turns out to be about twofold lower than both SH3 and Parkin RING1. The common binding site of Ubl in three distinct protein–protein interactions establishes this mode of interaction as key for the interactions involving Ubl. Unlike Ub, for which multiple modes of binding exist and additional binding modes are created by chain linkages, Ubl is accessed by all its documented binding partners in very similar and overlapping ways.
One important difference between the Ubl and Ub TROSY NMR titrations is the more general, less localized, broadening observed in Ub resonances (Fig EV2C). Both 15N,2H‐Ub and Ubl were 92–94% deuterated at non‐exchangeable positions. However, since higher TcPINK1 concentrations are required for saturating Ub, it is likely that the protein oligomerized (see Appendix Fig S8A, which shows oligomerization at >5 mg/ml eluting from gel filtration column). Thus, Ub may be binding to a larger complex, where residual non‐exchangeable 1H, as well as exchangeable 1H, contribute further to 1H‐1H dipole‐induced T2 relaxation, independently of the proximity to TcPINK1. Alternatively, the group of David Komander observed that Ub is adopting an alternative conformation with a 2 a.a. shift in the last β strand 33. This low‐population conformation is proposed to be the form that binds to PINK1 for efficient Ser65 phosphorylation. In this case, the bound form may undergo chemical exchange between two conformations “catalyzed” by PINK1, which could lead to exchange broadening. Further work will be required to elucidate whether this is also the case for the Ubl.
On the PINK1 side, our most striking finding is that Ser205 phosphorylation is required specifically for Ub/Ubl binding. Critically, this phosphorylation site is not required for autophosphorylation and thus does not significantly participate in general catalysis of phospho‐transfer from ATP. Autophosphorylation of hPINK1 at multiple sites, including Ser228, Thr357, and Ser402, has been found to be associated with PINK1‐dependent activation of Parkin 29, 48. We did not detect phosphorylation of TcPINK1 Ser376 (Ser402 in hPINK1) in our mass spectrometry analysis, confirming that phosphorylation at this site is not necessary for activity, as demonstrated earlier in hPINK1 30. Thr257 in hPINK1 is not conserved in TcPINK1, and thus, it is not required for the activity of WT TcPINK1. The invariant Ser228 thus appears to be the most critical site for hPINK1 activity. However, it remained unclear through which mechanism Ser228 mediates Parkin and ubiquitin phosphorylation. In a recent study, Ub was docked onto the homology model of hPINK1, and this theoretical model revealed that phospho‐Ser228 mediates important contacts with Ub 41. Here, we used NMR to show that phospho‐Ser205 is required for Ub/Ubl binding, and HDX‐MS shows that it changes the conformation of TcPINK1 near the active site. Structural studies on kinases have shown that the regulatory αC‐helix changes conformation in different states. Since Ser205 is located at the base of the putative αC‐helix, phosphorylation at this site might result in the said effect to activate TcPINK1. Moreover, we found intriguing differences between binding of two different “kinase‐dead” mutants in their Ser205‐phosphorylated forms. It remains unclear whether the reduced binding in the D337N is due to the loss of the side‐chain carboxylate group itself, which may mediate a stronger interaction with the substrate than the asparagine amide group. Unfortunately, we were not able to prepare completely unphosphorylated wild‐type PINK1, which would enable us to test this hypothesis. Still, our results with the S205N and K196A mutants strongly support a role for Ser205 phosphorylation in Ubl binding.
Another critical observation related to Ser205 is that its rapid phosphorylation occurs primarily in trans. Our assay with isotope‐labeled TcPINK1 experimentally excludes the possibility that TcPINK1 phosphorylates in cis (Fig 3D and E). Moreover, the structures of insect PINK1 show that there is no plausible conformational change that could allow Ser205 to reach its own active site (Fig 5A) 38, 39. This has important functional implications: The first is that two PINK1 molecules must interact in a well‐defined manner to conduct that selective autophosphorylation reaction; the second is that build‐up of at least two PINK1 molecules at a given mitochondrial damage site would be required to trigger ubiquitin phosphorylation and Parkin recruitment. hPINK1 dimers were previously demonstrated to form at the translocase of the outer mitochondrial membrane (TOM) complex and occurred concurrently with autophosphorylation 49. Moreover, a recent study suggested that the G411S mutation interferes with ubiquitin phosphorylation via a dimeric complex, giving rise to a dominant‐negative phenotype 41. Overall, our data reinforce this model and suggest a sequential activation model for the initiation of Parkin/PINK1‐dependent mitochondrial quality control, with PINK1 autophosphorylation preceding phosphorylation of ubiquitin anchored in proximity to the TOM:PINK1 complex (Fig 6). Phospho‐ubiquitin then recruits Parkin through a high‐affinity interaction, which allosterically releases the Ubl from RING1, thus allowing its phosphorylation by PINK1. Our observation that PINK1 can only autophosphorylate in trans would prevent premature phosphorylation of ubiquitin and Parkin by a single PINK1 molecule, thus imparting a critical threshold to the initiation of the Parkin activation cascade.
Figure 6. Schematic of Ubl and Ub binding and phosphorylation by PINK1.
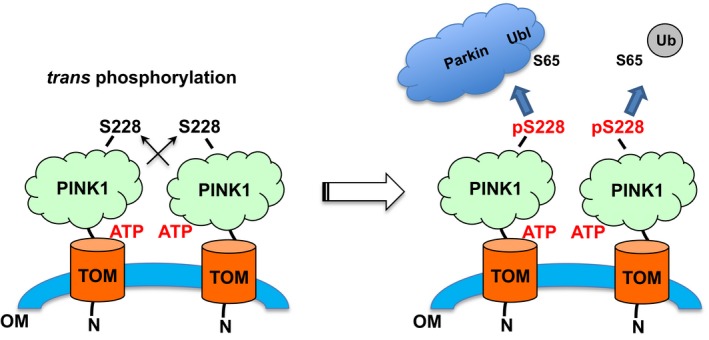
PINK1 accumulates on the mitochondria upon mitochondrial damage and autophosphorylates in trans on S228. The phosphorylation results in the creation of binding site for Ub and Parkin Ubl, which are then phosphorylated by PINK1 resulting in Parkin activation and initiation of mitophagy.
In this study, we also report the structure of TcPINK1 in solution. We notably had to use size‐exclusion chromatography (SEC) to obtain the SAXS profile of monomeric TcPINK1. Indeed, our previous attempts at solution SAXS failed because TcPINK1121–570 displayed a strong concentration‐dependent oligomerization in the 1–10 mg/ml range. The use of SEC‐SAXS combined with evolving factor analysis 50 allowed us to resolve well the dominant monomer from the overlapping minor oligomeric forms. Using these data, as well as HDX‐MS, we were able to explore the solution conformation of TcPINK1 cytosolic domain, starting from the recently determined crystal structures of two insect PINK1 38, 39. We were thus able to model the N‐terminal segment (a.a. 121–150), which does not adopt a rigid folded structure; however, there is some indication that a portion of this segment is partially ordered. Notably, the H‐D exchange rates for a.a. 135–150 are below 60% at 10 s, which implies that it is not forming a random coil (Fig EV5). Moreover, the exchange rates vary with the phosphorylation status at Ser205. The SAXS analysis also shows that insert 3 adopts a compact structure, as observed in the PhPINK1 structure bound to a Ub variant 39. While the latter structure shows that phospho‐Ser205 does not mediate a direct contact with UbTVLN, it is nevertheless mediating important contacts with insert 3, which participate in Ub binding. Likewise, the group of Miratul Muqit also found that phospho‐Ser205 and insert 3 are required for Ub/Ubl phosphorylation 38. Future work should focus on understanding how TcPINK1 self‐interacts to mediate rapid autophosphorylation specifically at Ser205 and determine the role of the N‐terminal segment.
Materials and Methods
Protein expression and purification
All rat Parkin full‐length WT and L266K, Ubl, Ub, and human endophilin‐A1 SH3 constructs were expressed as N‐terminal GST‐tagged proteins from pGEX‐6p‐1 vector and purified as previously described for unlabeled or 15N‐labeled proteins 18, 34, 35. Construct for His‐tagged Ub was provided by Noriyuki Matsuda and purified as described 8. Site‐directed mutagenesis was performed using the QuikChange site‐directed mutagenesis method (Agilent). 15N‐2H labeled Ub and Ubl were produced similarly to 15N‐labeled proteins except that all the salts and minimal media were prepared in D2O and supplemented with 1 g/l Celtone Plus Base Powder (Cambridge Isotopes) to boost expression of deuterated protein. Mass spectrometry measurements yielded % deuterium incorporation between 92 and 94% for both Ub and Ubl. TcPINK1 (codon‐optimized for E. coli expression) was ordered from Invitrogen for cloning a.a. 121–570 or 143–570 into pGEX‐6p‐1. TcPINK1 was expressed in BL21 DE3 cell lines (NEB) in Luria Broth at 37°C up to an O.D of 1.0, after which they were incubated at 16°C, induced with 100 μM IPTG, and left to express protein at 16°C for 6 or 20 h. Cells were harvested and lysed via sonication in lysis buffer (50 mM Tris, 300 mM NaCl, 3 mM DTT, 0.1 mg/ml lysozyme, 25 μg/ml DNase I, 5 mM MgSO4, 1 mM PMSF, and 0.5% Tween at pH 8.0). Glutathione‐sepharose resin was used to bind GST‐tagged protein in binding buffer (50 mM Tris, 300 mM NaCl, 3 mM DTT pH 8.0) for 60 min on a rotating platform at 4°C. After washing with the binding buffer, the protein was eluted with elution buffer (50 mM Tris, 300 mM NaCl, 20 mM glutathione, 0.1% CHAPS and 3 mM DTT pH, 8.0) and concentrated using Amicon‐Ultra concentrators (10,000 M.W. cut‐off; EMD Millipore). To cleave the GST tag, 3C protease (1:50 protease‐to‐substrate ratio) was incubated with the protein overnight at 4°C. The protein was first purified using the anion‐exchange column MonoQ (GE Healthcare) to get rid of excess GST and then further purified by size‐exclusion chromatography using Sephacryl S200 or Superdex S200 (GE Healthcare) connected in series with a GST trap 4B (GE Healthcare) to remove the GST. 15N‐labeled TcPINK1 was expressed similarly as 15N‐EndoA1 SH3.
Cell culture and immunoblotting
U2OS PINK1 KO cell lines were generated by CRISPR in the laboratory of Edward Fon at the Montreal Neurological Institute. Cells were cultured in DMEM (Dulbecco's Modified Eagle's Medium) supplemented with 10% fetal bovine serum and 1× Pen/Strep and grown at 37°C. pCMV(d1)TNT PINK1(WT)‐3HA and pCMV(d1)TNT PINK1(S228)‐3HA plasmids were obtained from Noriyuki Matsuda for attenuated PINK1 expression. U2OS PINK1 KO cells were transfected with 5 μg pCMV(d1)TNT PINK1(WT)‐3HA or pCMV(d1)TNT PINK1(S228)‐3HA in 6‐well plates for 48 h, followed by treatment with 10 μM of CCCP or equal volume of DMSO for 3 h. Non‐transfected cells were used as control. Cells were washed with cold HBS (20 mM HEPES, 100 mM NaCl, 1 mM DTT, pH 7.5) and pelleted by centrifuging for 20 min at 500 g. Cells were lysed by resuspension in HBS supplemented with 0.2% SDS, 1% Triton, 5 μg/ml E‐64 protease inhibitor cocktail (Roche), and PhosSTOP phosphatase inhibitor (Roche), and then subjecting the lysate to 5 min of water bath sonication at room temperature. The lysate was clarified by centrifugation at 16,000 g for 40 min at 4°C. The protein concentration of the supernatant was measured using the BCA assay kit (Pierce) according to manufacturer's protocol. The samples were boiled for 10 min in SDS–PAGE loading dye, and equal amounts of samples were loaded on 8% Tris–glycine or 4–20% PROTEAN gels (Bio‐Rad) followed by transfer to nitrocellulose membranes. Membranes were blocked in 5% BSA in TBS with 0.1% Tween (for PINK1 and phospho‐ubiquitin blots) or 5% skimmed milk in PBS with 0.1% Tween (for VDAC and HSP60 blots) followed by overnight incubation at 4°C in primary antibodies: PINK1 (D8G3; Cell Signaling, 1:2,000 dilution), HSP60 (D307; Cell Signaling, 1:2,000 dilution), VDAC (4866S; Cell Signaling, 1:5,000 dilution), and phospho‐S65 ubiquitin (ABS 1513; Millipore EMD, 1:2,000 dilution). Detection was performed using HRP‐conjugated secondary antibody and Clarity™‐enhanced chemiluminescence (Bio‐Rad).
Kinase assays
All phosphorylation assays were conducted at 30°C. Phosphorylation assays of Ub and Ubl were carried out with 30 μM GST‐tagged or untagged WT or mutant forms of Ub (for 30 min) and Ubl (for 5 min) with 2 μM GST‐TcPINK1 WT (a.a. 121–570 or a.a. 143–570) or mutant forms to make up a total reaction volume of 25 μl (unless indicated otherwise). The kinase buffer constituted 50 mM Tris–HCl, 100 mM NaCl, 1 mM DTT, and 2 mM MgSO4 at pH 7.5. The reactions were loaded onto 15% Tris–tricine gels with 30 μM Phos‐tag and 60 μM ZnSO4, or 10 or 12% Tris–glycine gels with 20 μM Phos‐tag and 40 μM MnCl2. The gels were stained with Coomassie brilliant blue stain, band intensities were quantified by densitometry using the ImageJ software, and the ratio of phosphorylated to total was calculated.
For Michaelis–Menten kinetic analysis, time course experiments were performed with 120 μM His‐Ub with 2.5 μM M GST‐TcPINK1 (143–570) or 120 μM Ubl with 1.25 μM GST‐TcPINK1 (143–570) for 2, 5, 10, and 20 min, and the phosphorylation intensities were plotted against time to find the time point to be used for the determination of initial rate (V o). This time point turned out to be 5 min. Experiments were then performed to obtain K m and V max parameters for Ub phosphorylation by performing phosphorylation reactions for 5 min at different substrate concentrations for both His‐Ub and Ubl. These experiments were performed at 2.5 and 5 μM enzyme for His‐Ub. For Ubl phosphorylation, two replicates of the experiment were performed at 2 μM enzyme concentration. Following gel runs and densitometry, the intensities (vo) were plotted as a function of concentration and the values for K m and k cat were obtained from the global fit to the two datasets using the data analysis software Prism. For either substrate, the intensities were normalized with respect to the substrate concentration and time (in units of μM/min) and scaled according to the enzyme concentration before performing the analysis. Control samples of His‐ubiquitin and Ubl were loaded on gel at different concentrations to demonstrate a linear relationship between concentration and intensity measurement by densitometry. Phosphorylation time course experiments with Ub or Ub2 (K6‐, K48‐, or K63‐linked) (purchased from Boston Biochem) were performed using 2.5 μM GST‐TcPINK (121–570) and 30 μM substrate and analyzed using intact mass spectrometry. Phosphorylation time course experiments with GST‐TcPINK1 (1–570) were performed with 0.2 μM enzyme and 30 μM Ubl or Ub and analyzed using phos‐tag gels.
Phosphorylation assays of TcPINK1 D337N were conducted for 5 min with 25 μM TcPINK1 D337N as substrate and 0.5 μM GST‐TcPINK1 WT or mutants. The kinase buffer constituted 50 mM Tris–HCl, 100 mM NaCl, 1 mM DTT, and 2 mM MgSO4 and 0.1% CHAPS at pH 7.5. The samples were analyzed using intact or tandem mass spectrometry. For time course experiments of phosphorylation to determine whether autophosphorylation occurs in cis or trans 15N‐labeled WT TcPINK1121–570 (10 mg) was treated with 100 U of CIP (calf intestinal phosphatase, NEB) for 30 min at 30°C. Anion exchange with MonoQ (GE Healthcare) was used to separate CIP from TcPINK1 (Appendix Fig S2). CIP‐treated 15N‐labeled WT TcPINK1 was used in a 50 μl reaction with 14N‐TcPINK1 D337N both at 5 μM. At different times, 5 μl samples (2.5 μg) were aliquoted and stored on ice for intact or tandem mass spectrometry analyses.
NMR experiments
15N‐labeled SH3, 15N‐2H labeled Ubl and Ub, unlabeled Ubl, GST‐TcPINK1 (WT, S205N, K196A, and K196A treated with CIP) were exchanged into NMR buffer (20 mM HEPES, 100 mM NaCl, 1 mM DTT, pH 7.5). 0.1% CHAPS was added to the buffer in all competition experiments shown in Fig 5 to improve solubility of the S205N, D337N, and K196A proteins. CHAPS did not significantly affect the UBL:SH3 interaction. 10% D2O was added to all NMR samples for locking. 1H‐15N HSQC or TROSY‐HSQC (gradient, sensitivity‐enhanced) spectra were collected at 298 K on a 600‐MHz Bruker Avance spectrometer equipped with a triple resonance (15N/13C/1H) cryoprobe. For the titrations shown in Fig 2B, a solution was first prepared with the highest GST‐TcPINK1 concentration and the indicated concentration of 15N‐2H labeled Ubl or Ub, and diluted with additional 15N‐2H labeled protein to dilute GST or GST‐TcPINK1 at the desired concentration and maintain the Ubl or Ub concentration constant. For competition assays, titrations were performed by keeping 15N‐labeled SH3 and GST‐TcPINK1 constant and lowering Ubl concentration by diluting samples with additional 15N‐labeled SH3 and GST‐TcPINK1 to obtain the desired concentration. The volume of NMR samples was kept constant at 350 μl. Spectra were processed with NMRpipe and analyzed with Sparky, and difference in acquisition time and concentration were used to adjust intensities. K d for Ubl and TcPINK1 were estimated on the basis of an exact mathematical model to calculate the fraction of two ligands competing for binding to a single binding receptor 36. One‐dimensional 1H NMR experiments with WATERGATE 90°‐shaped pulses on water were acquired using 30 μM GST‐Ubl (WT, R6A, I44A, K48A, H68A, R72A, and N8L) to assess the folding of Ubl mutants.
Mass spectrometry
For intact protein mass spectrometry, samples were diluted at 0.1 mg/ml in 0.05% TFA/2% acetonitrile and 20 μl (2 μg) was injected on a Waters C4 BEH 1.0/10 mm column, washed 5 min with 4% acetonitrile, followed by a 10‐min 4–50% gradient of acetonitrile in 0.1% formic acid, with a flow rate of 40 μl/min. The eluate was analyzed on a Bruker Impact II Q‐TOF mass spectrometer equipped with an Apollo II ion funnel ESI source. Data were acquired in positive‐ion profile mode, with a capillary voltage of 4,500 V and dry nitrogen heated at 200°C. Spectra were analyzed using the software DataAnalysis (Bruker). The total ion chromatogram was used to determine where the protein eluted, and spectra were summed over the entire elution peak. The multiply charged ion species were deconvoluted at 10,000 resolution using the maximum entropy method.
For tandem mass spectrometry of protein digests, 2–10 μg of samples was denatured in 6 M urea, 1 mM EDTA, 50 mM TEAB pH 8.5. For the time course of trans phosphorylation, samples were diluted to a final concentration of 1 M urea, 10 mM EDTA and 50 mM TEAB pH 8.5 to stop the reaction. Cysteine residues were then reduced with TCEP (2 mM pH 7.0) and alkylated with iodoacetamide (10 mM solution in H2O freshly prepared, Sigma). Protein samples were diluted to 1 M urea with 50 mM TEAB buffer and digested with 1:100 trypsin (Sigma) 2 h at 37°C. Digested peptides were purified using ZipTip C18 pipettes (Millipore). Peptides were diluted in loading buffer (2% acetonitrile, 0.05% trifluoroacetic acid), and 0.5–1 μg of peptides was captured and eluted from an Acclaim PepMap100 C18 column (75 μm × 25 cm) with a 30‐min 5–40% gradient of acetonitrile in 0.1% formic acid at 300 nl/min. The eluted peptides were analyzed with an Impact II Q‐TOF spectrometer equipped with a Captive Spray nano electrospray source (Bruker). Data were acquired using data‐dependent auto‐MS/MS with a range 150–2,200 m/z range, a fixed cycle time of 3 s, a dynamic exclusion of 1 min, m/z dependent isolation window (1.5–5 Th), and collision energy 25–75 eV 51. MS/MS data were analyzed using MASCOT using a search procedure against the sequence of the PINK1 mutant to be analyzed, with fixed carbamidomethylation and variable phosphorylation and methionine oxidation. Extracted ion chromatograms were produced using the Data Analysis software from Bruker.
Hydrogen–deuterium exchange mass spectrometry (HDX‐MS)
HDX was initiated by diluting 50 μM stock solution of TcPINK1 (K196A) or TcPINK1(K196A)‐pS205 using 1:9 dilution ratio into the D2O‐based buffer. The HDX incubation period and temperature were set to 10, 60, 300, 900 s, and 25°C, respectively. HDX was quenched with chilled quenching buffer (300 mM glycine, 8 M urea in H2O, pH 2.4) using 1:2 dilution ratio. Quenched solutions were flash frozen in MeOH containing dry ice, and samples were stored at −80°C until use. For the undeuterated control, initial dilution was made in H2O buffer.
Prior to ultra‐high‐performance liquid chromatography (UHPLC)‐MS analysis, the deuterated TcPINK1 was digested in an online immobilized pepsin column prepared in‐house. Resulting peptides were loaded onto a C18 analytical column (1 mm inner diameter, 50 mm length; Thermo Fisher Scientific) equipped to an Agilent 1290 Infinity II UHPLC system. Peptides for each sample were separated using a 5–40% linear gradient of acetonitrile containing 0.1% formic acid for 8 min at a 65 μl/min flow rate. To minimize back‐exchange, the columns, solvent delivery lines, injector, and other accessories were placed in an ice bath. The C18 column was directly connected to the electrospray ionization source of the LTQ Orbitrap XL (Thermo Fisher Scientific), and mass spectra of peptides were acquired in positive‐ion mode for m/z 200–2,000. Duplicate measurements were performed for each time point. Identification of peptides was carried out in separate experiments by tandem MS (MS/MS) analysis in data‐dependent acquisition mode, using collision‐induced dissociation. All MS/MS spectra were analyzed using Proteome Discoverer 1.4 (Thermo Fisher Scientific). Peptide searching results were further manually inspected, and only those verifiable were used in HDX analysis. The deuteration (%) as a function of incubation time was determined using HDExaminer 2.2 (Sierra Analytics, Modesto, CA). The first two amino acid residues in peptides were excluded from the analysis.
Homology modeling
TcPINK1151–570 was modeled from the structure of PhPINK1 (pdb 6eqi, chain C, a.a. 148–575) using the software PyMod 2.0 52. The two sequences were aligned on the basis of the PhPINK1 structure, and MODELLER was used to generate five models, which were energy‐minimized. The lowest energy model was selected for SAXS modeling. Likewise, TcPINK1151–570 was also modeled from the crystal structure of TcPINK1 (pdb 5oat, chain A, a.a. 151–570), in order to build segments missing from the electron density maps. Finally, a hybrid model was built by superposing the N‐lobes from the two models, such that the two strands upstream and downstream of insert 3 (a.a. 263–286) align perfectly; the coordinates of insert 3 from the PhPINK1 model were then copied to the TcPINK1 model.
Small‐angle X‐ray scattering
SAXS data were collected at the CHESS BioSAXS beamline (G1), using in‐line size‐exclusion chromatography 53. TcPINK1 121–570 D337N was concentrated to 18 mg/ml, and 50 μl was injected on a Superdex 200 Increase 5/150 GL column (GE Healthcare) equilibrated in SAXS buffer (50 mM Tris–HCl, 100 mM NaCl, 3 mM DTT, 5% glycerol, pH 7.5) at 4°C. The protein was eluted at 0.15 ml/min to a flow cell for exposure to X‐ray (λ = 1.246 Å), with data collection at 1 frame per second using a Pilatus 100‐K dual SAXS/WAXS detector. Primary data processing (radial averaging, buffer subtraction, merging) was performed using the BioXTAS RAW software 54, modified to include evolving factor analysis (EFA) to resolve overlapping chromatographic peaks as described 50. Three singular value decomposition (SVD) components were required to adequately fit the chromatography profile, with the main and most intense component corresponding to the monomer, and the 2nd and 3rd components corresponding to dimers and oligomers, respectively (Appendix Fig S8A). Molecular weights were estimated using the V c invariant method (Appendix Fig S8A), as described 55. The extracted scattering profile of the monomer was analyzed using software included in the ATSAS package, which are summarized hereafter 56. Pair‐distance distribution and Guinier plot were calculated using GNOM (Appendix Fig S8B). Rigid‐body modeling with flexible linkers was performed using the program CORAL, using the three TcPINK1151–570 homology models as template. Each was modeled using four rigid components that were fixed: a.a. 151–182, 191–262, 287–515, and 536–570. The models comprised three flexible linkers: a.a. 121–150 (N‐terminal linker), 183–190 (insert 1), and 516–535 (C‐terminal extension loop). In addition, insert 3 (a.a. 263–286) was either kept rigid (PhPINK1 and hybrid) or flexible (TcPINK1‐derived model). Twenty models were generated for all three templates, and the chi‐square values calculated with CRYSOL with no background subtraction.
Author contributions
SR performed protein purification, phosphorylation assays, NMR and mass spectrometry experiments, cell culture work, and drafted the manuscript. NS performed the HDX‐MS experiments and analysis. LT performed protein purification, full‐length TcPINK1, and isotope‐labeled trans phosphorylation assays. NC performed protein purification. GLL edited the manuscript. J‐FT coordinated the project, performed and analyzed the mass spectrometry and SAXS experiments, and drafted the manuscript. All authors participated to the study design.
Conflict of interest
The authors declare that they have no conflict of interest.
Supporting information
Appendix
Expanded View Figures PDF
Table EV1
Table EV2
Table EV3
Review Process File
Acknowledgements
We would like to thank Marie Ménade, Véronique Sauvé and Kalle Gehring for valuable discussions and use of their 600‐MHz NMR spectrometer; Richard Gillilan and Jesse Hopkins at the CHESS BioSAXS beamline for help with SEC‐SAXS data collection and analysis; Andrew Bayne and Marta Vranas for assistance with SAXS data collection and useful discussions; Mark Hancock for interaction studies; Tony Mittermaier for helpful suggestions regarding NMR experiments; Wei Yi, Gian‐Luca McLelland, and Edward Fon at the Montreal Neurological Institute (MNI) for providing U2OS PINK1 KO cells. All cell lines generated by the MNI IPSC/CRISPR Platform are available without restriction upon request through the Platform under the Open Science Policy of the MNI. The Cornell High Energy Synchrotron Source (CHESS) is supported by the National Science Foundation and the National Institutes of Health/National Institute of General Medical Sciences under NSF award DMR‐0936384, using the Macromolecular Diffraction at CHESS (MacCHESS) facility, which is supported by award GM‐103485 from the National Institutes of Health, through its National Institute of General Medical Sciences. We acknowledge support from Parkinson Canada, the Michael J. Fox Foundation, the Natural Science & Engineering Research Council of Canada (JFT), the Canadian Fund for Innovation and the Canada Research Chair Program (JFT and GL), as well as the Canadian Institute of Health Research (GL).
EMBO Reports (2018) 19: e44981 29475881
References
- 1. Valente EM, Abou‐Sleiman PM, Caputo V, Muqit MM, Harvey K, Gispert S, Ali Z, Del Turco D, Bentivoglio AR, Healy DG et al (2004) Hereditary early‐onset Parkinson's disease caused by mutations in PINK1. Science 304: 1158–1160 [DOI] [PubMed] [Google Scholar]
- 2. Kitada T, Asakawa S, Hattori N, Matsumine H, Yamamura Y, Minoshima S, Yokochi M, Mizuno Y, Shimizu N (1998) Mutations in the parkin gene cause autosomal recessive juvenile parkinsonism. Nature 392: 605–608 [DOI] [PubMed] [Google Scholar]
- 3. Beilina A, Van Der Brug M, Ahmad R, Kesavapany S, Miller DW, Petsko GA, Cookson MR (2005) Mutations in PTEN‐induced putative kinase 1 associated with recessive parkinsonism have differential effects on protein stability. Proc Natl Acad Sci USA 102: 5703–5708 [DOI] [PMC free article] [PubMed] [Google Scholar]
- 4. Pickrell AM, Youle RJ (2015) The roles of PINK1, parkin, and mitochondrial fidelity in Parkinson's disease. Neuron 85: 257–273 [DOI] [PMC free article] [PubMed] [Google Scholar]
- 5. Narendra DP, Jin SM, Tanaka A, Suen DF, Gautier CA, Shen J, Cookson MR, Youle RJ (2010) PINK1 is selectively stabilized on impaired mitochondria to activate Parkin. PLoS Biol 8: e1000298 [DOI] [PMC free article] [PubMed] [Google Scholar]
- 6. Kazlauskaite A, Kondapalli C, Gourlay R, Campbell DG, Ritorto MS, Hofmann K, Alessi DR, Knebel A, Trost M, Muqit MM (2014) Parkin is activated by PINK1‐dependent phosphorylation of ubiquitin at Ser65. Biochem J 460: 127–139 [DOI] [PMC free article] [PubMed] [Google Scholar]
- 7. Kane LA, Lazarou M, Fogel AI, Li Y, Yamano K, Sarraf SA, Banerjee S, Youle RJ (2014) PINK1 phosphorylates ubiquitin to activate Parkin E3 ubiquitin ligase activity. J Cell Biol 205: 143–153 [DOI] [PMC free article] [PubMed] [Google Scholar]
- 8. Koyano F, Okatsu K, Kosako H, Tamura Y, Go E, Kimura M, Kimura Y, Tsuchiya H, Yoshihara H, Hirokawa T et al (2014) Ubiquitin is phosphorylated by PINK1 to activate parkin. Nature 510: 162–166 [DOI] [PubMed] [Google Scholar]
- 9. Kondapalli C, Kazlauskaite A, Zhang N, Woodroof HI, Campbell DG, Gourlay R, Burchell L, Walden H, Macartney TJ, Deak M et al (2012) PINK1 is activated by mitochondrial membrane potential depolarization and stimulates Parkin E3 ligase activity by phosphorylating Serine 65. Open Biol 2: 120080 [DOI] [PMC free article] [PubMed] [Google Scholar]
- 10. Geisler S, Holmstrom KM, Skujat D, Fiesel FC, Rothfuss OC, Kahle PJ, Springer W (2010) PINK1/Parkin‐mediated mitophagy is dependent on VDAC1 and p62/SQSTM1. Nat Cell Biol 12: 119–131 [DOI] [PubMed] [Google Scholar]
- 11. Sarraf SA, Raman M, Guarani‐Pereira V, Sowa ME, Huttlin EL, Gygi SP, Harper JW (2013) Landscape of the PARKIN‐dependent ubiquitylome in response to mitochondrial depolarization. Nature 496: 372–376 [DOI] [PMC free article] [PubMed] [Google Scholar]
- 12. Lazarou M, Sliter DA, Kane LA, Sarraf SA, Wang C, Burman JL, Sideris DP, Fogel AI, Youle RJ (2015) The ubiquitin kinase PINK1 recruits autophagy receptors to induce mitophagy. Nature 524: 309–314 [DOI] [PMC free article] [PubMed] [Google Scholar]
- 13. Heo JM, Ordureau A, Paulo JA, Rinehart J, Harper JW (2015) The PINK1‐PARKIN mitochondrial ubiquitylation pathway drives a program of OPTN/NDP52 recruitment and TBK1 activation to promote mitophagy. Mol Cell 60: 7–20 [DOI] [PMC free article] [PubMed] [Google Scholar]
- 14. Greene AW, Grenier K, Aguileta MA, Muise S, Farazifard R, Haque ME, McBride HM, Park DS, Fon EA (2012) Mitochondrial processing peptidase regulates PINK1 processing, import and Parkin recruitment. EMBO Rep 13: 378–385 [DOI] [PMC free article] [PubMed] [Google Scholar]
- 15. Jin SM, Lazarou M, Wang C, Kane LA, Narendra DP, Youle RJ (2010) Mitochondrial membrane potential regulates PINK1 import and proteolytic destabilization by PARL. J Cell Biol 191: 933–942 [DOI] [PMC free article] [PubMed] [Google Scholar]
- 16. Yamano K, Youle RJ (2013) PINK1 is degraded through the N‐end rule pathway. Autophagy 9: 1758–1769 [DOI] [PMC free article] [PubMed] [Google Scholar]
- 17. Wauer T, Simicek M, Schubert A, Komander D (2015) Mechanism of phospho‐ubiquitin‐induced PARKIN activation. Nature 524: 370–374 [DOI] [PMC free article] [PubMed] [Google Scholar]
- 18. Sauvé V, Lilov A, Seirafi M, Vranas M, Rasool S, Kozlov G, Sprules T, Wang J, Trempe JF, Gehring K (2015) A Ubl/ubiquitin switch in the activation of Parkin. EMBO J 34: 2492–2505 [DOI] [PMC free article] [PubMed] [Google Scholar]
- 19. Kumar A, Aguirre JD, Condos TE, Martinez‐Torres RJ, Chaugule VK, Toth R, Sundaramoorthy R, Mercier P, Knebel A, Spratt DE et al (2015) Disruption of the autoinhibited state primes the E3 ligase parkin for activation and catalysis. EMBO J 34: 2506–2521 [DOI] [PMC free article] [PubMed] [Google Scholar]
- 20. Pao KC, Stanley M, Han C, Lai YC, Murphy P, Balk K, Wood NT, Corti O, Corvol JC, Muqit MM et al (2016) Probes of ubiquitin E3 ligases enable systematic dissection of parkin activation. Nat Chem Biol 12: 324–331 [DOI] [PMC free article] [PubMed] [Google Scholar]
- 21. Tang MY, Vranas M, Krahn AI, Pundlik S, Trempe JF, Fon EA (2017) Structure‐guided mutagenesis reveals a hierarchical mechanism of Parkin activation. Nat Commun 8: 14697 [DOI] [PMC free article] [PubMed] [Google Scholar]
- 22. Swaney DL, Rodriguez‐Mias RA, Villen J (2015) Phosphorylation of ubiquitin at Ser65 affects its polymerization, targets, and proteome‐wide turnover. EMBO Rep 16: 1131–1144 [DOI] [PMC free article] [PubMed] [Google Scholar]
- 23. Cardona F, Sanchez‐Mut JV, Dopazo H, Perez‐Tur J (2011) Phylogenetic and in silico structural analysis of the Parkinson disease‐related kinase PINK1. Hum Mutat 32: 369–378 [DOI] [PubMed] [Google Scholar]
- 24. Trempe JF, Fon EA (2013) Structure and function of Parkin, PINK1, and DJ‐1, the three musketeers of neuroprotection. Front Neurol 4: 38 [DOI] [PMC free article] [PubMed] [Google Scholar]
- 25. Sim CH, Lio DS, Mok SS, Masters CL, Hill AF, Culvenor JG, Cheng HC (2006) C‐terminal truncation and Parkinson's disease‐associated mutations down‐regulate the protein serine/threonine kinase activity of PTEN‐induced kinase‐1. Hum Mol Genet 15: 3251–3262 [DOI] [PubMed] [Google Scholar]
- 26. Woodroof HI, Pogson JH, Begley M, Cantley LC, Deak M, Campbell DG, van Aalten DM, Whitworth AJ, Alessi DR, Muqit MM (2011) Discovery of catalytically active orthologues of the Parkinson's disease kinase PINK1: analysis of substrate specificity and impact of mutations. Open Biol 1: 110012 [DOI] [PMC free article] [PubMed] [Google Scholar]
- 27. Wauer T, Swatek KN, Wagstaff JL, Gladkova C, Pruneda JN, Michel MA, Gersch M, Johnson CM, Freund SM, Komander D (2015) Ubiquitin Ser65 phosphorylation affects ubiquitin structure, chain assembly and hydrolysis. EMBO J 34: 307–325 [DOI] [PMC free article] [PubMed] [Google Scholar]
- 28. Silvestri L, Caputo V, Bellacchio E, Atorino L, Dallapiccola B, Valente EM, Casari G (2005) Mitochondrial import and enzymatic activity of PINK1 mutants associated to recessive parkinsonism. Hum Mol Genet 14: 3477–3492 [DOI] [PubMed] [Google Scholar]
- 29. Okatsu K, Oka T, Iguchi M, Imamura K, Kosako H, Tani N, Kimura M, Go E, Koyano F, Funayama M et al (2012) PINK1 autophosphorylation upon membrane potential dissipation is essential for Parkin recruitment to damaged mitochondria. Nat Commun 3: 1016 [DOI] [PMC free article] [PubMed] [Google Scholar]
- 30. Narendra DP, Wang C, Youle RJ, Walker JE (2013) PINK1 rendered temperature sensitive by disease‐associated and engineered mutations. Hum Mol Genet 22: 2572–2589 [DOI] [PMC free article] [PubMed] [Google Scholar]
- 31. Safadi SS, Shaw GS (2007) A disease state mutation unfolds the parkin ubiquitin‐like domain. Biochemistry 46: 14162–14169 [DOI] [PubMed] [Google Scholar]
- 32. Iguchi M, Kujuro Y, Okatsu K, Koyano F, Kosako H, Kimura M, Suzuki N, Uchiyama S, Tanaka K, Matsuda N (2013) Parkin‐catalyzed ubiquitin‐ester transfer is triggered by PINK1‐dependent phosphorylation. J Biol Chem 288: 22019–22032 [DOI] [PMC free article] [PubMed] [Google Scholar]
- 33. Gladkova C, Schubert AF, Wagstaff JL, Pruneda JN, Freund SM, Komander D (2017) An invisible ubiquitin conformation is required for efficient phosphorylation by PINK1. EMBO J 36: 3555–3572 [DOI] [PMC free article] [PubMed] [Google Scholar]
- 34. Trempe JF, Chen CX, Grenier K, Camacho EM, Kozlov G, McPherson PS, Gehring K, Fon EA (2009) SH3 domains from a subset of BAR proteins define a Ubl‐binding domain and implicate parkin in synaptic ubiquitination. Mol Cell 36: 1034–1047 [DOI] [PubMed] [Google Scholar]
- 35. Trempe JF, Sauvé V, Grenier K, Seirafi M, Tang MY, Menade M, Al‐Abdul‐Wahid S, Krett J, Wong K, Kozlov G et al (2013) Structure of parkin reveals mechanisms for ubiquitin ligase activation. Science 340: 1451–1455 [DOI] [PubMed] [Google Scholar]
- 36. Wang ZX (1995) An exact mathematical expression for describing competitive binding of two different ligands to a protein molecule. FEBS Lett 360: 111–114 [DOI] [PubMed] [Google Scholar]
- 37. Endicott JA, Noble ME, Johnson LN (2012) The structural basis for control of eukaryotic protein kinases. Annu Rev Biochem 81: 587–613 [DOI] [PubMed] [Google Scholar]
- 38. Kumar A, Tamjar J, Waddell AD, Woodroof HI, Raimi OG, Shaw AM, Peggie M, Muqit MM, van Aalten DM (2017) Structure of PINK1 and mechanisms of Parkinson's disease associated mutations. Elife 6: e29985 [DOI] [PMC free article] [PubMed] [Google Scholar]
- 39. Schubert AF, Gladkova C, Pardon E, Wagstaff JL, Freund SMV, Steyaert J, Maslen SL, Komander D (2017) Structure of PINK1 in complex with its substrate ubiquitin. Nature 552: 51–56 [DOI] [PMC free article] [PubMed] [Google Scholar]
- 40. Kaiser SE, Riley BE, Shaler TA, Trevino RS, Becker CH, Schulman H, Kopito RR (2011) Protein standard absolute quantification (PSAQ) method for the measurement of cellular ubiquitin pools. Nat Methods 8: 691–696 [DOI] [PMC free article] [PubMed] [Google Scholar]
- 41. Puschmann A, Fiesel FC, Caulfield TR, Hudec R, Ando M, Truban D, Hou X, Ogaki K, Heckman MG, James ED et al (2017) Heterozygous PINK1 p. G411S increases risk of Parkinson's disease via a dominant‐negative mechanism. Brain 140: 98–117 [DOI] [PMC free article] [PubMed] [Google Scholar]
- 42. Gersch M, Gladkova C, Schubert AF, Michel MA, Maslen S, Komander D (2017) Mechanism and regulation of the Lys6‐selective deubiquitinase USP30. Nat Struct Mol Biol 24: 920–930 [DOI] [PMC free article] [PubMed] [Google Scholar]
- 43. Ordureau A, Sarraf SA, Duda DM, Heo JM, Jedrykowski MP, Sviderskiy VO, Olszewski JL, Koerber JT, Xie T, Beausoleil SA et al (2014) Quantitative proteomics reveal a feedforward mechanism for mitochondrial PARKIN translocation and ubiquitin chain synthesis. Mol Cell 56: 360–375 [DOI] [PMC free article] [PubMed] [Google Scholar]
- 44. Durcan TM, Tang MY, Perusse JR, Dashti EA, Aguileta MA, McLelland GL, Gros P, Shaler TA, Faubert D, Coulombe B et al (2014) USP8 regulates mitophagy by removing K6‐linked ubiquitin conjugates from parkin. EMBO J 33: 2473–2491 [DOI] [PMC free article] [PubMed] [Google Scholar]
- 45. Kazlauskaite A, Martinez‐Torres RJ, Wilkie S, Kumar A, Peltier J, Gonzalez A, Johnson C, Zhang J, Hope AG, Peggie M et al (2015) Binding to serine 65‐phosphorylated ubiquitin primes Parkin for optimal PINK1‐dependent phosphorylation and activation. EMBO Rep 16: 939–954 [DOI] [PMC free article] [PubMed] [Google Scholar]
- 46. Soukup SF, Kuenen S, Vanhauwaert R, Manetsberger J, Hernandez‐Diaz S, Swerts J, Schoovaerts N, Vilain S, Gounko NV, Vints K et al (2016) A LRRK2‐dependent endophilina phosphoswitch is critical for macroautophagy at presynaptic terminals. Neuron 92: 829–844 [DOI] [PubMed] [Google Scholar]
- 47. Chang D, Nalls MA, Hallgrimsdottir IB, Hunkapiller J, van der Brug M, Cai F, International Parkinson's Disease Genomics C , and Me Research T , Kerchner GA, Ayalon G et al (2017) A meta‐analysis of genome‐wide association studies identifies 17 new Parkinson's disease risk loci. Nat Genet 49: 1511–1516 [DOI] [PMC free article] [PubMed] [Google Scholar]
- 48. Aerts L, Craessaerts K, De Strooper B, Morais VA (2015) PINK1 kinase catalytic activity is regulated by phosphorylation on serines 228 and 402. J Biol Chem 290: 2798–2811 [DOI] [PMC free article] [PubMed] [Google Scholar]
- 49. Okatsu K, Uno M, Koyano F, Go E, Kimura M, Oka T, Tanaka K, Matsuda N (2013) A dimeric PINK1‐containing complex on depolarized mitochondria stimulates parkin recruitment. J Biol Chem 288: 36372–36384 [DOI] [PMC free article] [PubMed] [Google Scholar]
- 50. Meisburger SP, Taylor AB, Khan CA, Zhang S, Fitzpatrick PF, Ando N (2016) Domain movements upon activation of phenylalanine hydroxylase characterized by crystallography and chromatography‐coupled small‐angle X‐ray scattering. J Am Chem Soc 138: 6506–6516 [DOI] [PMC free article] [PubMed] [Google Scholar]
- 51. Beck S, Michalski A, Raether O, Lubeck M, Kaspar S, Goedecke N, Baessmann C, Hornburg D, Meier F, Paron I et al (2015) The impact II, a very high‐resolution quadrupole time‐of‐flight instrument (QTOF) for deep shotgun proteomics. Mol Cell Proteomics 14: 2014–2029 [DOI] [PMC free article] [PubMed] [Google Scholar]
- 52. Janson G, Zhang C, Prado MG, Paiardini A (2017) PyMod 2.0: improvements in protein sequence‐structure analysis and homology modeling within PyMOL. Bioinformatics 33: 444–446 [DOI] [PubMed] [Google Scholar]
- 53. Acerbo AS, Cook MJ, Gillilan RE (2015) Upgrade of MacCHESS facility for X‐ray scattering of biological macromolecules in solution. J Synchrotron Radiat 22: 180–186 [DOI] [PMC free article] [PubMed] [Google Scholar]
- 54. Nielsen SS, Toft KN, Snakenborg D, Jeppesen MG, Jacobsen JK, Vestergaard B, Kutter JP, Arleth L (2009) BioXTAS RAW, a software program for high‐throughput automated small‐angle X‐ray scattering data reduction and preliminary analysis. J Appl Crystallogr 42: 965–974 [Google Scholar]
- 55. Rambo RP, Tainer JA (2013) Accurate assessment of mass, models and resolution by small‐angle scattering. Nature 496: 477–481 [DOI] [PMC free article] [PubMed] [Google Scholar]
- 56. Petoukhov MV, Franke D, Shkumatov AV, Tria G, Kikhney AG, Gajda M, Gorba C, Haydyn MDT, Konarev PV, Svergun DI (2012) New developments in the ATSAS program package for small‐angle scattering data analysis. J Appl Cryst 45: 342–350 [DOI] [PMC free article] [PubMed] [Google Scholar]
Associated Data
This section collects any data citations, data availability statements, or supplementary materials included in this article.
Supplementary Materials
Appendix
Expanded View Figures PDF
Table EV1
Table EV2
Table EV3
Review Process File