Correction to: Qual Life Res 10.1007/s11136-017-1684-4
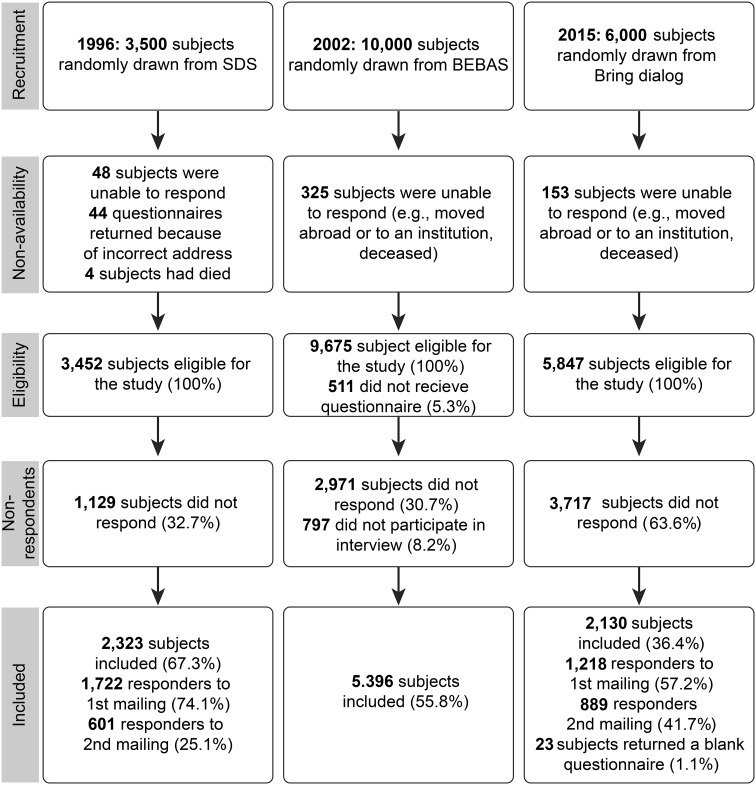
In the original publication of the article, the right number of participants included in the analysis should be 2107 and not 2118 as written in the paper. The flow-chart and corrected SF-36 scores for the 2015 data set for this article should have appeared as follows: Fig. 1 and Table 3. These changes did not influence the results. The authors would like to apologize for any inconvenience caused.
Fig. 1.
Flowchart of subject inclusion in the three survey
Table 3.
Mean SF-36 scale scores (± SD) in 2015 by gender and age group, N = 2107
| Scales | Age groups | |||||||||||||
|---|---|---|---|---|---|---|---|---|---|---|---|---|---|---|
| 18–29 years | 30–39 years | 40–49 years | 50–59 years | 60–69 years | 70–79 years | Total | ||||||||
| W (n = 65–68) | M (n = 36) | W(n = 116–120) | M (n = 81) | W (n = 225–229) | M (n = 163–167) | W (n = 253–260) | M (n = 209–216) | W (n = 243–258) | M (n = 249–256) | W (n = 188–207) | M (n = 180–187) | W (n = 1091–1143) | M (n = 917–942) | |
| PF | 93.2 (± 14.7) | 97.6 (± 6.2) | 94.0 (± 10.2) | 94.8 (± 9.6) | 90.7 (± 16.8) | 92.8 (± 12.6) | 87.9 (± 16.1) | 90.0 (± 16.3) | 81.2 (± 22.1) | 85.7 (± 18.4) | 71.7 (± 27.0) | 80.5 (± 19.2) | 84.9 (± 21.0) | 88.2 (± 17.0) |
| RP | 78.3 (± 37.8) | 94.4 (± 18.0) | 87.9 (± 26.1) | 90.7 (± 24.5) | 77.6 (± 37.6) | 86.5 (± 29.6) | 73.4 (± 39.3) | 82.5 (± 32.7) | 71.2 (± 40.1) | 76.9 (± 36.2) | 57.3 (± 43.7) | 63.4 (± 41.8) | 72.7 (± 39.6) | 79.1 (± 35.3) |
| BP | 72.7 (± 27.2) | 83.5 (± 19.1) | 76.0 (± 23.0) | 78.8 (± 24.8) | 66.9 (± 27.5) | 71.8 (± 26.4) | 66.4 (± 25.5) | 72.4 (± 24.8) | 64.3 (± 26.9) | 71.6 (± 25.3) | 63.7 (± 26.7) | 68.1 (± 25.6) | 66.9 (± 26.5) | 72.2 (± 25.3) |
| GH | 74.8 (± 21.1) | 75.6 (± 21.2) | 75.2 (± 20.3) | 73.5 (± 20.2) | 75.0 (± 23.0) | 74.6 (± 22.0) | 72.8 (± 22.8) | 74.1 (± 20.9) | 70.7 (± 22.6) | 73.1 (± 21.8) | 69.6 (± 22.7) | 71.6 (± 18.2) | 72.6 (± 22.5) | 73.4 (± 20.8) |
| VT | 47.6 (± 19.6) | 58.3 (± 18.7) | 54.4 (± 19.1) | 57.8 (± 16.8) | 56.2 (± 19.5) | 59.0 (± 18.5) | 56.1 (± 20.8) | 62.2 (± 18.5) | 60.5 (± 20.9) | 63.8 (± 20.3) | 60.4 (± 21.0) | 63.9 (± 18.2) | 57.2 (± 20.6) | 61.9 (± 18.9) |
| SF | 80.8 (± 25.2) | 86.4 (± 18.7) | 84.9 (± 24.0) | 90.1 (± 19.2) | 85.2 (± 22.2) | 89.6 (± 20.8) | 85.1 (± 21.3) | 89.7 (± 19.1) | 87.6 (± 19.5) | 90.3 (± 18.4) | 86.5 (± 21.5) | 86.3 (± 19.3) | 85.7 (± 21.6) | 89.1 (± 19.3) |
| RE | 78.6 (± 33.6) | 79.6 (± 35.8) | 86.6 (± 29.7) | 92.5 (± 21.0) | 88.1 (± 28.8) | 93.7 (± 22.5) | 91.6 (± 22.0) | 91.6 (± 23.5) | 89.1 (± 27.7) | 89.8 (± 26.1) | 82.8 (± 32.8) | 84.2 (± 30.7) | 87.5 (± 28.5) | 89.6 (± 26.2) |
| MH | 74.5 (± 16.0) | 75.5 (± 15.5) | 75.8 (± 15.6) | 78.2 (± 13.2) | 78.6 (± 16.0) | 80.0 (± 12.7) | 80.2 (± 13.8) | 81.5 (± 13.6) | 82.1 (± 14.0) | 83.8 (± 14.3) | 82.5 (± 13.8) | 84.1 (± 13.4) | 79.9 (± 14.8) | 81.9 (± 13.8) |
PF physical functioning, RP role physical, BP bodily pain, GH general health, VT vitality, SF social functioning, RE role emotional, MH mental health. W women, M men
Also this article was originally published electronically on the publisher’s internet portal (currently SpringerLink) on 14th August 2017 without open access. With the author(s)’ decision to opt for Open Choice the copyright of the article changed on 20th of November to © The Author(s) 2017 and the article is forthwith distributed under the terms of the Creative Commons Attribution 4.0 International License (http://creativecommons.org/licenses/by/4.0/), which permits use, duplication, adaptation, distribution and reproduction in any medium or format, as long as you give appropriate credit to the original author(s) and the source, provide a link to the Creative Commons license and indicate if changes were made. The original article was corrected.


