Abstract
Background and Aim: Conventional manual sperm analysis still shows variations in structure, process and outcome although World Health Organization (WHO) guidelines present an appropriate method for sperm analysis. In the present study a new system for sperm analysis, Sperm Motility Analysis System (SMAS), was compared with manual semen analysis based on WHO guidelines.
Materials and methods: Samples from 30 infertility patients and 21 healthy volunteers were subjected to manual microscopic analysis and SMAS analysis, simultaneously. We compared these two methods with respect to sperm concentration and percent motility.
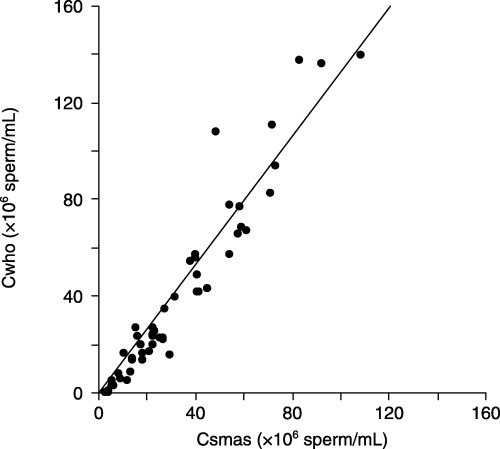
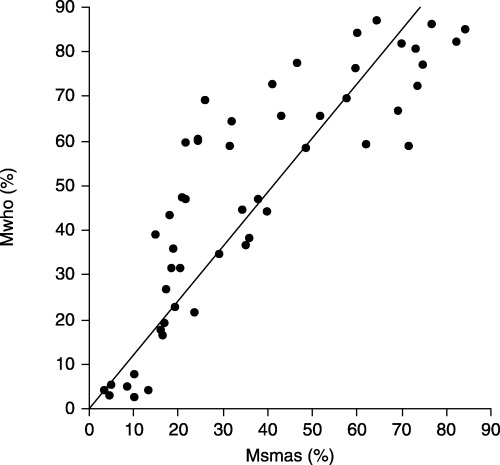
Results: Sperm concentrations obtained by SMAS (Csmas) and manual microscopic analyses on WHO guidelines (Cwho) were strongly correlated (Cwho = 1.325 × Csmas; r = 0.95, P < 0.001). If we excluded subjects with Csmas values >30 × 106 sperm/mL, the results were more similar (Cwho = 1.022 × Csmas; r = 0.81, P < 0.001). Percent motility obtained by SMAS (Msmas) and manual analysis on WHO guidelines (Mwho) were strongly correlated (Mwho = 1.214 × Msmas; r = 0.89, P < 0.001).
Conclusions: The data indicate that the results of SMAS and those of manual microscopic sperm analyses based on WHO guidelines are strongly correlated. SMAS is therefore a promising system for sperm analysis. (Reprod Med Biol 2006; 5: 195–200)
Keywords: semen analysis, Sperm Motility Analysis System
INTRODUCTION
SEMEN ANALYSIS IS the gold standard for investigating the cause of male infertility. The most popular method for semen analysis has been the conventional manual microscopic method with hemocytometers or counting chambers, such as Makler Chambers (Sefi‐Medical Instruments, Haifa, Israel). Manual semen assessments can be carried out in clinical settings and are simple and inexpensive. However, variation in results from different laboratories can occur, most likely the result of the lack of standardization of methods. 1 Although World Health Organization (WHO) guidelines provide a sophisticated method for sperm analysis, 2 problems with respect to reproducibility, quality control and complexity remain. 3 Furthermore, conventional semen analysis does not include examination of motion characteristics such as velocity, linearity or lateral head displacement.
Since the development of computer‐assisted semen analysis (CASA) in the 1980s, several additive motility parameters describing the movements of spermatozoa have made sperm analysis more objective and detailed. There have been many methodological studies on analyzing devices, chambers and other conditions. 4 , 5 Correlations between CASA results and results of in vitro or in vivo fertilization have also been reported. 6 , 7 , 8 Larsen et al. reported the value of CASA in the prediction of fertility in the general male population. 9 However, CASA is expensive and requires a complicated setup for optimum performance, and these factors have inhibited widespread clinical use.
In the present study, a new relatively inexpensive device for sperm analysis, Sperm Motility Analysis System (SMAS, Kashimura, Tokyo, Japan) was compared with conventional manual sperm analysis based on WHO guidelines.
MATERIALS AND METHODS
Subjects
THIRTY PATIENTS AT the male infertility clinic at Osaka Univeristy Hospital, Department of Urology, Osaka, Japan and 21 healthy volunteers were included in the present study. Mean age was 34.7 ± 6.5 (SD) years. Informed consent was obtained from all patients and volunteers prior to enrolment. All 51 samples were collected in the afternoon during the period July–September, 2004. Participants were asked to comply with the requirement of ejaculatory abstinence from 2 to 7 days prior to sample collection. The mean abstinence period of the participants was 3.3 ± 1.5 days. Freshly collected semen samples produced by masturbation were maintained at room temperature for at least 30 min to allow for liquefaction. Specimens were vortexed gently and evaluated for volume and pH. The mean volume of collected semen was 2.8 ± 1.8 mL. Each sample was subjected to manual microscopic analysis and simultaneously to SMAS analysis. None of the specimens showed leukospermia as defined by WHO criteria. 2
Manual microscopic sperm analysis based on WHO guidelines
Conventional semen analysis was carried out manually by a single experienced laboratory technician according to WHO guidelines in 1999. 2 For assessment of sperm concentration, an improved Neubauer hemocytometer was used. Samples were diluted according to the instructions of the WHO laboratory manual. 2 Diluent was prepared by adding 50 g sodium bicarbonate and 10 mL 35% (v/v) formalin to distilled water to a final volume of 1 L. To determine sperm percent motility, a 10 µL sample was loaded onto a clean slide glass and covered with a 22 × 22 mm coverslip. Motility was graded as follows: (a) rapid progressive motility; (b) slow or sluggish progressive motility; (c) non‐progressive motility; or (d) immotility, according to the WHO criteria under positive phase‐contrast microscopy at a total magnification of ×400.
Sperm Motility Analysis System
SMAS (version 1.0, Kashimura, Tokyo, Japan) consists of a high‐resolution digital scanning camera, a personal computer with a digital frame grabber and image‐processing software, and a computer monitor. The system records images at a rate of 1 per second (60 Hz) and can analyze up to approximately 200 spermatozoa simultaneously in real‐time. SMAS yields parameters essentially similar to those of other CASA systems, for example, percent motility, sperm concentration, curvilinear velocity, straight‐line velocity, amplitude of lateral head displacement, linearity and beat‐cross frequency. Additionally, the performance of SMAS is evaluated any time by comparison of SMAS‐determined parameters with manually determined values derived from the same image, which is overlaid with colored lines showing the motion paths of the spermatozoa. The most successful image analysis of spermatozoa is obtained with negative (or bright) phase‐contrast microscopy (bright sperm heads and tails on a gray background), but positive (or dark) phase‐contrast microscopy (bright sperm heads and dark flagellae on a gray background) can be used for human spermatozoa by selecting optimum light intensity and image size settings.
For each measurement, a 5‐µL aliquot was loaded into a 20‐µm Leja counting chamber (Standard Count Analysis Chamber 20 micron, Nieuw‐Vennep, the Netherlands). Six fields and a minimum of 200 sperm cells were analyzed per specimen. Samples were analyzed for sperm concentration, percent motility and other motion characteristics, although only sperm count and percent motility were considered in the present study.
Statistical analysis
The association between overall SMAS results and those of manual microscopic sperm analysis with respect to concentration and percent motility were evaluated. First, the results of overall samples were compared. Second, samples with SMAS values >30 × 106 sperm/mL (Csmas) or >60% motility (Msmas) were excluded because accurate and repeated semen analyses are more often needed for patients with lower concentration (oligozoospermia) and/or lower percent motility (asthenospermia) in the clinical settings. Values are shown as mean ± standard deviation (SD). Scatterplots and Spearman's rank correlation coefficients with respective P‐values were used for analysis of the linear association between measurements based on the two methods. Wilcoxon signed rank sum test was used to compare variables measured by both methods. A P‐value of <0.05 was considered significant. All statistical analyses were carried out with the use of sas version 8.02 (SAS Institute, Cary, NC, USA).
RESULTS
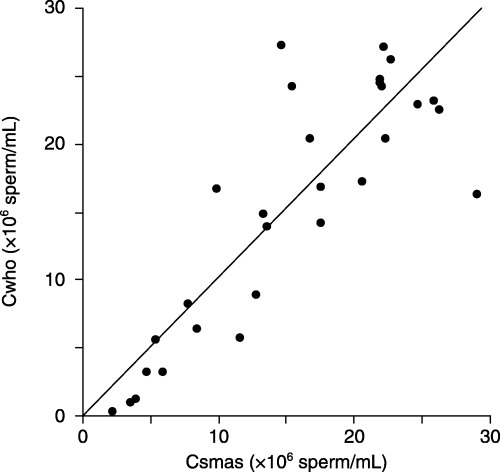
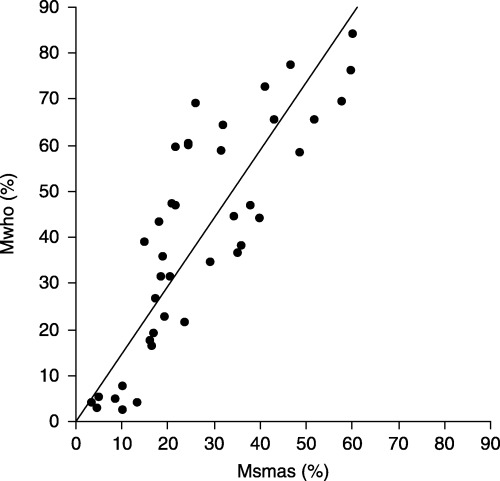
THE RELATIONSHIP BETWEEN sperm concentrations obtained by SMAS (Csmas) and manual sperm analysis on WHO guidelines (Cwho) is shown in Figure 1. Csmas (32.7 ± 24.9 × 10⁶ sperm/mL) and Cwho (41.1 ± 37.4 × 10⁶ sperm/mL) were strongly correlated (Cwho = 1.325 × Csmas; r = 0.95, P < 0.001). However, Csmas was significantly less than Cwho (P < 0.001, Table 1). The relationship between Csmas (≤30 × 106 sperm/mL) and corresponding Cwho is shown in Figure 2. When samples with Csmas values >30 × 106 sperm/mL were excluded, results on the two methods were also strongly correlated and more similar (Cwho = 1.022 × Csmas; r = 0.81, P < 0.001), and there was no significant difference between Cwho and Csmas (P = 0.85, Table 1). The relationship between sperm percent motility obtained by SMAS (Msmas) and manual analysis on WHO guidelines (Mwho) is shown in Figure 3. Msmas (36.7 ± 23.6%) and Mwho (48.4 ± 26.4%) were strongly correlated (Mwho = 1.214 × Msmas; r = 0.89, P < 0.001). However, Msmas was significantly less than Mwho (P < 0.001, Table 1). The relationship between Msmas (≤60%) and corresponding Mwho is shown in Figure 4. When samples with Msmas >60% were excluded, results on two methods were also strongly correlated (Mwho = 1.472 × Msmas; r = 0.863, P < 0.001) but significantly different (P < 0.001, Table 1).
Figure 1.

Scatterplot of sperm concentration results (Cwho vs Csmas), with line of Cwho = 1.325 × Csmas. Csmas, sperm concentrations obtained by Sperm Motility Analysis System; Cwho, sperm concentrations obtained by manual sperm analysis using World Health Organization guidelines.
Table 1.
Results obtained by Sperm Motility Analysis System and manual microscopic analysis using World Health Organization guidelines
| SMAS | WHO | Wilcoxon's P value | |
|---|---|---|---|
| Concentration (×106/ml) (Overall, n = 51) | 32.7 ± 24.9 | 41.1 ± 37.4 | <0.001 |
| Concentration (×106/ml) (Csmas, 30 × 106/ml, n = 30) | 15.6 ± 8.0 | 15.9 ± 9.5 | 0.85 |
| Percent motility (%) (Overall, n = 51) | 36.7 ± 23.6 | 48.4 ± 26.4 | <0.001 |
| Percent motility (%) (Msmas, 60%, n = 40) | 26.8 ± 15.4 | 40.7 ± 24.2 | <0.001 |
Csmas, sperm concentrations obtained by Sperm Motility Analysis System; Msmas, sperm percent motility obtained by Sperm Motility Analysis System; SMAS, Sperm Motility Analysis System; WHO, World Health Organization.
Figure 2.

Scatterplot of sperm concentration results from specimens with Csmas ≤30 × 106 sperm/mL (Cwho vs Csmas), with line of Cwho = 1.022 × Csmas. Csmas, sperm concentrations obtained by Sperm Motility Analysis System; Cwho, sperm concentrations obtained by manual sperm analysis using World Health Organization guidelines.
Figure 3.

Scatterplot of sperm motility results (Mwho%vs Msmas%), with line of Mwho = 1.214 × Msmas. Msmas, sperm percent motility obtained by Sperm Motility Analysis System; Mwho, sperm percent motility obtained by manual analysis using World Health Organization guidelines.
Figure 4.

Scatterplot of sperm motility results from specimens with Msmas ≤60%, with line of Mwho = 1.472 × Msmas. Msmas, sperm percent motility obtained by Sperm Motility Analysis System; Mwho, sperm percent motility obtained by manual analysis using World Health Organization guidelines.
DISCUSSION
ACCURATE ANALYSIS OF sperm concentration and motility are essential in the investigation of male infertility. The most popular method for semen analysis has been a manual microscopic method with hemocytometers or counting chambers. This method can be carried out successfully in any clinical laboratory and is simple and inexpensive. Numerous studies have reported the association between conventional sperm analysis and conception in infertile couples. It has been shown that conventionally assessed sperm concentration is a strong predictor of fertility in normal males. 10 Parameters such as percentage of motile sperm have also been shown to predict pregnancy. 11 Bostofte et al. reported that the degree of motility provided significant information regarding the time until pregnancy in an infertile male population. 12
However, it is doubtful whether WHO guidelines for manual sperm analysis are followed consistently even in andrology laboratories, although the guidelines provide an appropriate method for semen analysis. Keel et al. reported that as many as 34% of laboratories carrying out semen analysis have never heard of the WHO guidelines or do not have a copy of the manual. 3 Furthermore, standard semen analysis is a rather subjective technique associated with large interlaboratory variation, which makes it virtually impossible to compare sperm motility assessments carried out by different laboratories. 9 Jorgensen et al. showed only a modest interlaboratory variation in assessment of sperm concentration and semen volume, with a considerable interlaboratory variation in the assessment of sperm motility and morphology parameters. 1 Yeung et al. attempted to objectively measure sperm velocity that technicians had classified subjectively into WHO categories of grade a and b (progressive motile) and grade c (non‐progressive) spermatozoa. However, cut‐off values among grade a, b and c were variable. 13 Keel et al. summarized problems with semen analysis based on the WHO guidelines as follows: (i) there is a significant lack of standardization in the performance and reporting of semen analyses among laboratories; (ii) a large degree of variation and disagreement exists among laboratories carrying out this test; and (iii) quality control procedures are not routinely carried out in the majority of laboratories. 14 Furthermore, conventional semen analysis does not evaluate additional motion characteristics such as velocity, linearity or lateral head displacement. 15 Automated semen analysis with more objective and detailed parameters has been long awaited in clinical settings.
Since the development of CASA in the 1980s, motility parameters describing the movements of spermatozoa have made sperm analysis more objective and detailed. There have been a number of studies on devices, counting chambers, working range and other factors. Holt et al. assessed a single donor semen sample with five types of CASA systems and reported that emphasis on operator training and standardization of sample‐handling techniques would enhance the reproducibility of CASA measurements more than improvements in the CASA systems themselves. 16 With respect to counting chambers, most reports suggest the superior accuracy of disposable chambers in comparison to reusable chambers, 4 , 17 therefore we followed their recommendations while SMAS measurements were made in the present study. Johnson et al. also suggested an optimal working range of 20–149 × 106 sperm/mL for the determination of sperm concentration and motility. 5 The range is quite wide, however, it doesn't cover samples <20 × 106 sperm/mL which is identical to oligozoospermia based on WHO guidelines. With respect to the usefulness of CASA in predicting fertility, reports both on general populations and infertile populations have been published. Larsen et al. reported that the concentration of motile spermatozoa measured by CASA can predict fertility in the general male population. 9 Macleod and Irvine reported that lateral head displacement and average path velocity measured by CASA can predict the ability of donor semen to achieve conception. 6 Barratt et al. showed the prognostic significance of the total number of spermatozoa and average path velocity for in vivo fertility. 7 With respect to in vitro fertilization, De Geyter et al. reported that curvilinear velocity is the most distinctive parameter of sperm function. 15 Thus, CASA provides two additional advantages to the manual method: (i) an increase in repeatability and reliability of measurements between technicians; and (ii) provision of quantitative data previously shown to be predictive of both in vivo and in vitro fertility treatments. 18 In addition, CASA has been used frequently in reproductive toxicology. Sharma et al. showed that artificial stimulants affect CASA motion characteristics. 19 In 1998, the ESHRE Andrology Special Interest Group announced guidelines on the application of CASA technology in the analysis of spermatozoa. 20 They reported a variety of standards with respect to the following: basic instrumentation, determination of sperm concentration, motility, and movement, morphology assessment, clinical application and applications for reproductive toxicology. However, CASA remains expensive and the availability of less expensive systems which can enter mainstream of laboratories has long been awaited. 18
SMAS has been commercially available since 2002 and is approximately one‐tenth the cost of CASA in Japan. SMAS requires only a few minutes to analyze semen and can be carried out easily by technicians or practitioners. In the present study, there was a significant association between sperm concentrations obtained by SMAS (Csmas) and manual sperm analysis using WHO guidelines (Cwho). Furthermore, when samples of Csmas > 30 × 106 sperm/mL were excluded, good correlation and increased similarity between the methods were obtained. We assume this could be an excellent result because most of the male infertility patients show relatively lower sperm concentrations. In the male infertility clinic, objective, accurate and repetitive semen analyses are essential for oligozoospermia patients rather than normozoospermia patients. Johnson et al. also suggested CASA provides a wide working range of 20–149 × 106 sperm/mL for the determination of sperm concentration and motility, 5 however, their result means CASA might not be suitable for evaluation of oligozoospermia samples. In addition, sperm motility values obtained by SMAS (Msmas) and manual analysis (Mwho) were strongly correlated.
SMAS provides analysis of a variety of semen parameters such as straight‐line velocity, curvilinear velocity, linearity, amplitude of lateral head displacement and beat‐cross frequency, similar to CASA. There are no studies comparing these parameters in SMAS and CASA. Future comparative studies of SMAS and CASA are necessary. Nevertheless, SMAS might be useful in predicting the results of assisted reproductive techniques such as in vitro fertilization or intrauterine insemination, similar to CASA.
In conclusion, the present study showed results obtained with SMAS and with manual microscopic sperm analysis based on the WHO Laboratory Manual were strongly correlated. The present study is the first report on the utility of the new, inexpensive sperm analysis system, SMAS. SMAS provides the cost effectiveness of conventional sperm analysis and the utility of CASA. In clinical settings requiring limited expense of time and money, SMAS is a promising alternative.
ACKNOWLEDGMENTS
WE ARE GRATEFUL to S. Tanabe for skilful assistance with sample collection and analysis.
REFERENCES
- 1. Jorgensen N, Auger J, Giwercman A et al. Semen analysis performed by different laboratory teams: an intervariation study. Int J Androl 1997; 20: 201–208. [DOI] [PubMed] [Google Scholar]
- 2. World Health Organization. WHO Laboratory Manual for the Examination of Human Semen and Semen–Cervical Mucus Interaction, 4th edn New York: Cambridge University Press, 1999. [Google Scholar]
- 3. Keel BA, Stembridge TW, Pineda G, Serafy NT, Sr. Lack of standardization in performance of the semen analysis among laboratories in the United States. Fertil Steril 2002; 78: 603–608. [DOI] [PubMed] [Google Scholar]
- 4. Johnson JE, Boone WR, Blackhurst DW. Manual versus computer‐automated semen analyses. Part I. Comparison of counting chambers. Fertil Steril 1996; 65: 150–155. [DOI] [PubMed] [Google Scholar]
- 5. Johnson JE, Boone WR, Blackhurst DW. Manual versus computer‐automated semen analyses. Part II. Determination of the working range of a computer‐automated semen analyzer. Fertil Steril 1996; 65: 156–159. [DOI] [PubMed] [Google Scholar]
- 6. Macleod IC, Irvine DS. The predictive value of computer‐assisted semen analysis in the context of a donor insemination programme. Hum Reprod 1995; 10: 580–586. [DOI] [PubMed] [Google Scholar]
- 7. Barratt CL, Tomlinson MJ, Cooke ID. Prognostic significance of computerized motility analysis for in vivo fertility. Fertil Steril 1993; 60: 520–525. [PubMed] [Google Scholar]
- 8. Paston MJ, Sarkar S, Oates RP, Badawy SZ. Computer‐aided semen analysis variables as predictors of male fertility potential. Arch Androl 1994; 33: 93–99. [DOI] [PubMed] [Google Scholar]
- 9. Larsen L, Scheike T, Jensen TK et al. Computer‐assisted semen analysis parameters as predictors for fertility of men from the general population. The Danish First Pregnancy Planner Study Team. Hum Reprod 2000; 15: 1562–1567. [DOI] [PubMed] [Google Scholar]
- 10. Bonde JP, Ernst E, Jensen TK et al. Relation between semen quality and fertility: a population‐based study of 430 first‐pregnancy planners. Lancet 1998; 352: 1172–1177. [DOI] [PubMed] [Google Scholar]
- 11. Jouannet P, Ducot B, Feneux D, Spira A. Male factors and the likelihood of pregnancy in infertile couples. I. Study of sperm characteristics. Int J Androl 1988; 11: 379–394. [DOI] [PubMed] [Google Scholar]
- 12. Bostofte E, Bagger P, Michael A, Stakemann G. Fertility prognosis for infertile men: results of follow‐up study of semen analysis in infertile men from two different populations evaluated by the Cox regression model. Fertil Steril 1990; 54: 1100–1106. [DOI] [PubMed] [Google Scholar]
- 13. Yeung CH, Cooper TG, Nieschlag E. A technique for standardization and quality control of subjective sperm motility assessments in semen analysis. Fertil Steril 1997; 67: 1156–1158. [DOI] [PubMed] [Google Scholar]
- 14. Keel BA. How reliable are results from the semen analysis? Fertil Steril 2004; 82: 41–44. [DOI] [PubMed] [Google Scholar]
- 15. De Geyter C, De Geyter M, Koppers B, Nieschlag E. Diagnostic accuracy of computer‐assisted sperm motion analysis. Hum Reprod 1998; 13: 2512–2520. [DOI] [PubMed] [Google Scholar]
- 16. Holt W, Watson P, Curry M, Holt C. Reproducibility of computer‐aided semen analysis: comparison of five different systems used in a practical workshop. Fertil Steril 1994; 62: 1277–1282. [PubMed] [Google Scholar]
- 17. Ginsburg KA, Armant DR. The influence of chamber characteristics on the reliability of sperm concentration and movement measurements obtained by manual and videomicrographic analysis. Fertil Steril 1990; 53: 882–887. [DOI] [PubMed] [Google Scholar]
- 18. Mortimer D, Fraser L. Consensus workshop on advanced diagnostic andrology techniques. ESHRE (European Soc Human Reprod Embryology) Androl Special Interest Group. Hum Reprod 1996; 11: 1463–1479. [PubMed] [Google Scholar]
- 19. Sharma RK, Tolentino MV Jr, Thomas AJ Jr, Agarwal A. Optimal dose and duration of exposure to artificial stimulants in cryopreserved human spermatozoa. J Urol 1996; 155: 568–573. [PubMed] [Google Scholar]
- 20. ESHRE Andrology Special Interest Group. Guidelines on the application of CASA technology in the analysis of spermatozoa. ESHRE Andrology Special Interest Group. European Society for Human Reproduction and Embryology. Hum Reprod 1998; 13: 142–145. [PubMed] [Google Scholar]


