Abstract
The Barnes maze is a dry-land based rodent behavioral paradigm for assessing spatial learning and memory that was originally developed by its namesake, Carol Barnes. It represents a well-established alternative to the more popular Morris Water maze and offers the advantage of being free from the potentially confounding influence of swimming behavior. Herein, the Barnes maze experimental setup and corresponding procedures for testing and analysis in mice are described in detail.
Keywords: Spatial memory, Mouse, Hippocampus, Cognition, Behavior
Background
The Barnes maze is a dry-land based behavioral test that was originally developed by Carol Barnes to study spatial memory in rats (Barnes, 1979) and later adapted for use in mice ( Bach et al., 1995 ). Conceptually, it is similar to the Morris water maze (MWM) (Morris, 1984), in that it is a hippocampal-dependent task where animals learn the relationship between distal cues in the surrounding environment and a fixed escape location. For mice, the typical Barnes maze setup consists of an elevated circular platform with 40 evenly-spaced holes around the perimeter. An escape tunnel is mounted underneath one hole while the remaining 39 holes are left empty. Both bright light and open spaces are aversive to rodents, thus serve as motivating factors to induce escape behavior. The escape tunnel is maintained at a fixed location for the duration of training, which involves multiple daily trials spread over several days. During the course of training, rodents typically utilize a sequence of three different search strategies (random, serial, spatial) to learn the location of the escape tunnel. Following sufficient acquisition training, the escape tunnel is removed and a probe trial is administered to assess spatial reference memory.
Although the MWM is the dominant model for assessing spatial learning in rodents, the Barnes maze offers several important advantages worth noting. First and foremost, the Barnes maze does not involve swimming and the potential confounding factors associated with it. Swimming is stressful, as detailed in studies documenting that MWM training increases plasma corticosterone levels to a greater extent than that of the Barnes maze ( Harrison et al., 2009 ). In addition, the swim conditions utilized in most MWM protocols elicit reductions in core body temperature that can affect performance ( Iivonen et al., 2003 ). Moreover, rodents often take to floating, which is thought to represent a state of behavioral despair and is considered an index of ‘depressive-like’ behavior in the widely utilized Porsolt forced swim test ( Porsolt et al., 1977 ). Finally, as noted above, the Barnes maze allows clear delineation of the three possible search strategies used by the mouse during performance of each trial.
Materials and Reagents
Tissue paper (Georgia-Pacific Consumer Products, catalog number: 48100)
70% ethanol in a spray bottle
C57BL/6J adult male mice (Purchased from Jackson Labs, 3-5 months of age)
Equipment
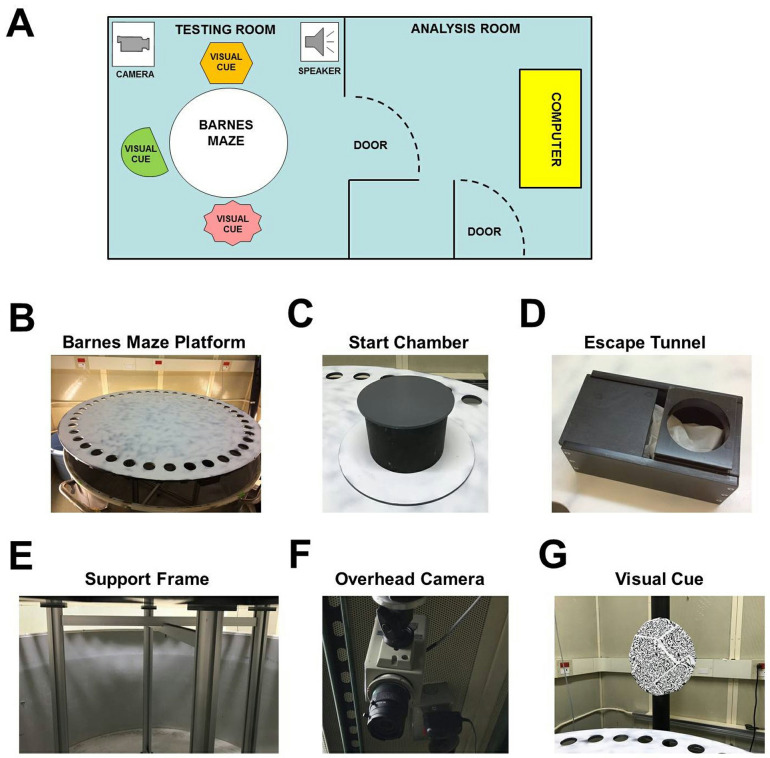
Well-lit (~1,000 lux) testing room with a holding room located nearby (Figure 1A)
-
Barnes maze apparatus (TSE Systems, catalog number: 302050-BM/M), includes:
Circular PVC platform* (diameter = 122 cm; thickness = 1 cm) containing 40 equally spaced holes (diameter = 5 cm) (Figure 1B)
Gray PVC start chamber* consisting of a base plate and a cover (Figure 1C)
PVC escape tunnel* that can be mounted under any of the 40 escape holes (Figure 1D)
Aluminum support frame* (height = 80 cm) for circular PVC platform (Figure 1E)
Overhead camera (Panasonic, catalog number: WV-BP332, Figure 1F)
Three distal visual cues (length/width ~30 cm) surrounding the platform (Figure 1G)
Loudspeaker for 90 dB white noise (Sony, catalog number: SS-MB150H)
Windows-based PC computer (Dell, model: OptiPlex 780) connected to the camera
Tally counter
Figure 1. Barnes maze experimental setup.
A. Layout of behavioral testing room and adjacent room used for analysis. B-F. Images of the Barnes maze platform (B), start chamber (C), escape tunnel (D), aluminum support frame (E), overhead camera (F), a single visual cue (G).
Software
TSE VideoMot2 video tracking software (TSE Systems)
GraphPad Prism version 5.0 (GraphPad Software)
Microsoft Excel
Procedure
-
Software setup
-
Calibration
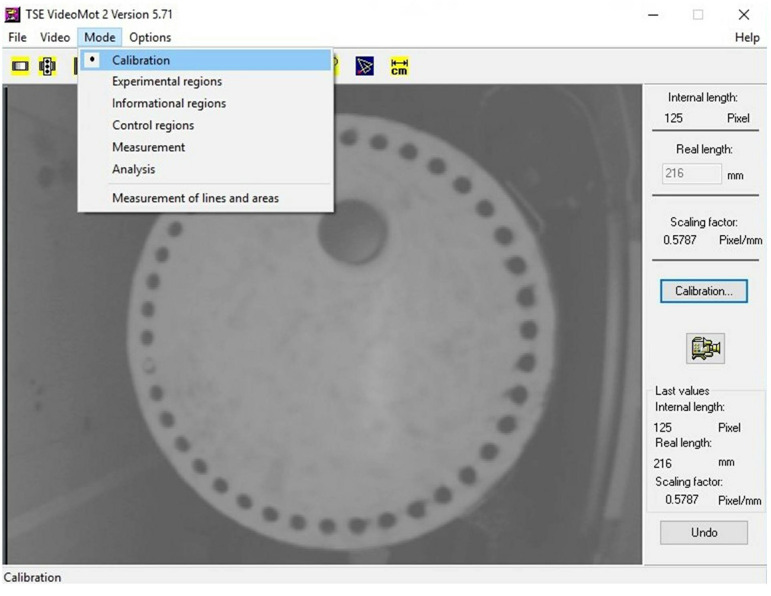
Under the ‘Mode’ tab located in the upper left corner of VideoMot2 software program, select ‘Calibration’ (Figure 2).
Hit the button for ‘Calibration’.
Draw a line across the diameter of the Barnes maze platform.
Enter 1,220 mm in the box for ‘Real length’. This corresponds to the actual diameter of the Barnes maze.
-
Define experimental region
Under the ‘Mode’ tab in the VideoMot2 program, select ‘Experimental regions’.
Use the draw tools located at the bottom of the display window to make a circle that covers the entire Barnes platform. This defines the region where the mouse will be tracked by the software.
-
Define informational region
Under the ‘Mode’ tab in the VideoMot2 program, select ‘Informational regions’.
Use the draw tools to make a circle around the hole covering the escape tunnel.
-
Measurement
Select ‘Measurement’ from the ‘Mode’ tab.
Enter 00:03:00 in the white box to the right of the text ‘Autostop at’. Make sure that the white box to the left of the ‘Autostop at’ text is checked off. This will insure that the video tracking software automatically stops each trial after 3 min.
Click on the ‘Start’ button located in the lower right corner of the display window.
Enter relevant study information (Study number, etc.) when prompted.
Click the spacebar once to start the background measurement and then again to conclude it. During the background measurement, make sure that there is no movement or change in lighting in view of the camera.
Enter trial data (Animal #, Group) when prompted.
Click the spacebar once to begin tracking the mouse. In the video display, a cross will be superimposed on the mouse’s body and will follow its movements in the maze. Click the spacebar again to end the trial.
To save data for each trial, select ‘Save track as’ under the ‘File’ tab located in the upper left corner of the screen.
-
-
Barnes maze procedure (Figure 3)
-
Habituation (Day 1)
Attach the escape tunnel to the platform and add one piece of clean tissue paper for each mouse habituation trial. The surrounding visual cues should be in place. These cues should remain unaltered for the habituation, acquisition, and probe trial phases.
Place mouse in the escape tunnel for 1 min.
Put mouse in the center of the apparatus. Allow it to explore until it enters the escape tunnel or 5 min elapses.
Clean the apparatus and escape tunnel with 70% ethanol
-
Acquisition training (Days 1-10)
Allow an interval of at least 1 h between habituation and the onset of acquisition training. Attach the escape tunnel to the platform at a location different from that used for the habituation trial. The position of the escape tunnel remains at this fixed location relative to spatial cues in the room for the duration of training. Add one piece of clean tissue paper to the escape tunnel for each mouse acquisition trial.
Training consists of two acquisition trials daily (3 min limit per trial; intertrial interval ~1 h) with the starting location varied pseudorandomly among the four quadrants.
At the start of each trial, the mouse is placed in a gray PVC start chamber located in the center of one of the four quadrants. After a 15 sec period, the start chamber is lifted (Figure 3B), and the mouse is allowed to explore the maze. During each trial, loud white noise (90 dB) is played through a loudspeaker to induce escape behavior. The trial concludes when the mouse enters the escape tunnel (Figure 3D) or 3 min elapses. If a mouse fails to find the escape tunnel within the 3 min period, it is placed in the tunnel by the researcher and allowed to stay there for 15 sec prior to removal.
Following each trial, the maze and escape tunnel are cleaned with 70% ethanol.
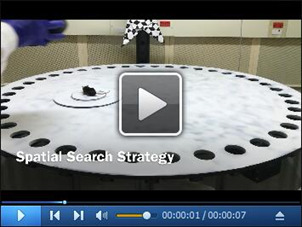
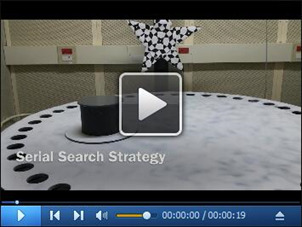
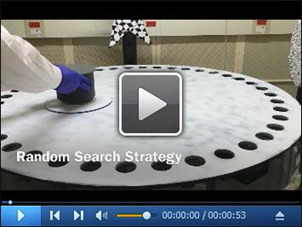
For each trial, a number of parameters are recorded to assess performance. These include the latency to locate (primary latency) and enter (total latency) the escape tunnel, along with the number of incorrect holes checked prior to locating (primary errors) and entering (total errors) the tunnel. Errors are defined as checking any hole that does not contain the escape tunnel and are scored live using a tally counter. The distance traveled (path length) prior to locating the escape tunnel and total distance for each trial are also chronicled. In addition, we also make note of the location of the first hole checked relative to the escape tunnel (primary hole distance) by a given mouse during each trial. For this measure, values range from 0 (target hole) to 20 (directly opposite the target hole). Finally, for each trial, the search strategy is classified as spatial, serial, or random (Figure 4). Trials where mice have scores of 3 or less for both primary errors and primary hole distance are defined as spatial searches (Video 1). Trials in which mice spent the majority of the time on the periphery performing systematic hole searches in a clockwise or counterclockwise manner are classified as a serial searches (Video 2). All other trials are considered random searches, including those in which mice failed to enter the escape tunnel within the 3-min trial period (Video 3).
-
Probe trial
Three days after the final session of acquisition training, mice undergo a 1 min probe trial in which the escape tunnel is removed from the apparatus.
The probe trial is administered in a similar manner to the acquisition trials, except that the start chamber is placed in the center of the apparatus, rather than the center of any given quadrant.
For the probe trial, the latency and distance traveled (path length) prior to reaching to previous escape tunnel location are recorded, along with the primary hole distance, total distance traveled, number of target hole checks, and number of incorrect holes checks.
-
Figure 2. Screenshot of VideoMot2 analysis software.
Figure 3. Barnes maze procedure.
A. Experimental timeline; B-D. Images of a mouse being released from the start chamber (B), checking a hole (C), and entering the escape tunnel (D).
Figure 4. Barnes maze search strategy.
A-C. Tracking data from individual trials that were classified as random (A), serial (B), and spatial searches (C).
Video 1. Spatial search strategy.
Video 2. Serial search strategy.
Video 3. Random search strategy.
Data analysis
Under the ‘Mode’ tab in the VideoMot2 program, select ‘Analysis’.
Under the ‘File’ tab, select the chosen file to be analyzed.
Recorded data can be examined using the video player located in the lower right hand corner of the software program. Here the experimenter can determine and/or review the number of errors and target hole distance as well as classify the search strategy.
Click on the ‘Protocol’ button situated in the lower right hand corner of the software program. This will open a new display that contains data for latency to target (primary latency) and distance traveled.
After all relevant data for each trial is tabulated from VideoMot2, it is then consolidated into trial blocks using Microsoft Excel. Each trial block consists of four trials conducted over two consecutive days with one start location in each of the four quadrants. Mean values for each trial block are imported into GraphPad Prism 5.0 to generate graphs and to determine whether statistically significant differences exist between groups.
Figure 5 displays graphs for measures of primary latency (A), primary errors (B), and primary hole distance (C) that compare groups of wild-type and knockout mice. Both groups showed similar decreases in all three measures with increased training, indicating that spatial learning occurred. Other Barnes maze parameters that are often graphed include path length, average speed, percentage of failed trials (3 min without finding escape tunnel), and percentage of trials using a spatial search strategy.
Figure 5. Barnes maze data presentation.
A-C. Graphs for measures of primary latency (A), primary errors (B), and primary hole distance (C) that compare performance between groups of wild-type and knockout mice. For primary hole distance, the dotted line indicates random chance performance (score = 10).
Notes
One potential drawback of the Barnes maze is that the lack of stressful stimuli can result in slow learning. To provide mild stress and increase motivation for escape, we play 90 dB white noise through a loudspeaker during all trials. Other groups have used buzzer noise in a similar manner to induce escape behavior ( Bach et al., 1995 ; O’Leary and Brown, 2012).
It should also be noted that pharmacological and/or genetic manipulations that increase anxiety could act as confounding factors on Barnes maze performance. However, this potential confound appears to be of greater concern for the MWM than the Barnes maze. For example, one study used both the MWM and the Barnes maze to assess spatial learning in neurogranin null mice, a mutant strain with increased anxiety. These mice were unable to reach acquisition criterion on the MWM, but were able to do so for the Barnes maze ( Miyakawa et al., 2001 ). Nevertheless, when testing mice with increased anxiety on the Barnes maze, decreasing the light intensity would be one possible remedy to minimize the confounding influence of anxiety.
In addition to the procedure outlined above, we have also used a version with more extensive acquisition training that included 40 trials spread over 20 days ( Pitts et al., 2013 ). In our studies, we have found that wild-type C57BL/6J mice develop a spatial preference after 15-20 acquisition trials, as indicated by primary hole distances significantly less than 10 (random chance). Further training results in decreasing primary hole distances and an increasing percentage of spatial search strategies. However, this additional training can also have a saturating effect, as cognitively impaired mice may eventually catch up with that of normal mice. There is no clear consensus among researchers as to when acquisition training should end. In the initial paper adapting the Barnes maze for use in mice, researchers kept testing a given mouse until it made 3 errors or less on 7 out of 8 consecutive trials ( Bach et al., 1995 ). For wild-type mice used in this study, the median time to meet this criteria was 22 days on a training regimen of one trial daily. In the published literature since that time, the typical range is 15-30 acquisition trials ( Seeger et al., 2004 ; Patil et al., 2009 ; O’ Leary et al., 2011 and 2012) before administering the probe trial.
Our experience with the Barnes maze is limited to the use of young (3-5 months of age) adult C57BL/6J mice. We have found that rates of learning can vary substantially between individual mice within a given group. Due to this variability, we recommend a group size of 10-12 mice (matched for age and gender) in order to accurately compare performance between groups on this task. In terms of gender differences, we have observed that males adopt a spatial search strategy to a greater degree than females as training progresses. Moreover, it also should be noted that other groups have reported significant differences in Barnes maze performance with respect to mouse background strain (O’ Leary et al., 2011 ) and age ( Kesby et al., 2015 ).
Following administration of the probe trial, training can be further extended to examine reversal learning ( Seeger et al., 2004 ). For reversal learning, the escape tunnel is moved to a location directly opposite the initial target site. Training proceeds in an analogous manner to that described above for initial acquisition and the same parameters are measured.
Acknowledgments
Our laboratory used this protocol to assess spatial learning in mice in two recent publications ( Pitts et al., 2013 and 2015). That work was supported by NIH grants G12 MD007601, R01 DK47320 (Marla J. Berry), and Pilot Project Award funds from G12 MD007601 to M.W.P. The author thanks Ann Hashimoto, Ting Gong, Daniel Torres, and Tessi Sherrin for helping obtain the images and video that accompany this manuscript. The author declares that there are no any conflicting and/or competing interests.
Citation
Readers should cite both the Bio-protocol article and the original research article where this protocol was used.
References
- 1. Bach M. E., Hawkins R. D., Osman M., Kandel E. R. and Mayford M.(1995). Impairment of spatial but not contextual memory in CaMKII mutant mice with a selective loss of hippocampal LTP in the range of the theta frequency. Cell 81(6): 905-915. [DOI] [PubMed] [Google Scholar]
- 2. Barnes C. A.(1979). Memory deficits associated with senescence: a neurophysiological and behavioral study in the rat. J Comp Physiol Psychol 93(1): 74-104. [DOI] [PubMed] [Google Scholar]
- 3. Harrison F. E., Hosseini A. H. and McDonald M. P.(2009). Endogenous anxiety and stress responses in water maze and Barnes maze spatial memory tasks. Behav Brain Res 198(1): 247-251. [DOI] [PMC free article] [PubMed] [Google Scholar]
- 4. Kesby J. P., Kim J. J., Scadeng M., Woods G., Kado D. M., Olefsky J. M., Jeste D. V., Achim C. L. and Semenova S.(2015). Spatial cognition in adult and aged mice exposed to a high-fat diet. PLoS One 10(10): e0140034. [DOI] [PMC free article] [PubMed] [Google Scholar]
- 5. Iivonen H., Nurminen L., Harri M., Tanila H. and Puolivali J.(2003). Hypothermia in mice tested in Morris water maze. Behav Brain Res 141(2): 207-213. [DOI] [PubMed] [Google Scholar]
- 6. Miyakawa T., Yared E., Pak J. H., Huang F. L., Huang K. P. and Crawley J. N.(2001). Neurogranin null mutant mice display performance deficits on spatial learning tasks with anxiety related components. Hippocampus 11(6): 763-75. [DOI] [PubMed] [Google Scholar]
- 7. Morris R.(1984). Developments of a water-maze procedure for studying spatial learning in the rat. J Neurosci Methods 11(1): 47-60. [DOI] [PubMed] [Google Scholar]
- 8. O’Leary T. P. and Brown R. E.(2012). The effects of apparatus design and test procedure on learning and memory performance of C57BL/6J mice on the Barnes maze. J Neurosci Methods 203(2): 315-324. [DOI] [PubMed] [Google Scholar]
- 9. O’Leary T. P., Savoie V. and Brown R. E.(2011). Learning, memory and search strategies of inbred mouse strains with different visual abilities on the Barnes maze. Behav Brain Res 216(2): 531-42. [DOI] [PubMed] [Google Scholar]
- 10. Patil S. S., Sunyer B., Hoger H. and Lubec G.(2009). Evaluation of spatial memory of C57BL/6J and CD1 mice in the Barnes maze, the Multiple T-maze, and the Morris water maze. Behav Brain Res 198(1): 58-68. [DOI] [PubMed] [Google Scholar]
- 11. Pitts M. W., Kremer P. M., Hashimoto A. C., Torres D. J., Byrns C. N., Williams C. S. and Berry M. J.(2015). Competition between the brain and testes under selenium-compromised conditions: Insight into sex differences in Selenium metabolism and risk of neurodevelopmental disease. J Neurosci 35(46):15326-38. [DOI] [PMC free article] [PubMed] [Google Scholar]
- 12. Pitts M. W., Reeves M. A., Hashimoto A. C., Ogawa A., Kremer P., Seale L. A. and Berry M. J.(2013). Deletion of selenoprotein M leads to obesity without cognitive deficits. J Biol Chem 288(36): 26121-26134. [DOI] [PMC free article] [PubMed] [Google Scholar]
- 13. Porsolt R. D., Le Pichon M. and Jalfre M.(1977). Depression: a new animal model sensitive to antidepressant treatments. Nature 266(5604): 730-732. [DOI] [PubMed] [Google Scholar]
- 14. Seeger T., Fedorova I., Zheng F., Miyakawa T., Koustova E., Gomeza J., Basile A. S., Alzheimer C. and Wess J.(2004). M2 muscarinic acetylcholine receptor knock-out mice show deficits in behavioral flexibility, working memory, and hippocampal plasticity. J Neurosci 24(45): 10117-10127. [DOI] [PMC free article] [PubMed] [Google Scholar]


