

Summary
High-grade gliomas (HGG) are a devastating group of cancers, representing the leading cause of brain tumor-related death in both children and adults. Therapies aimed at mechanisms intrinsic to the glioma cell have translated to only limited success; effective therapeutic strategies will need to also target elements of the tumor microenvironment that promote glioma progression. We recently demonstrated that neuronal activity robustly promotes the growth of a range of molecularly and clinically distinct HGG types, including adult glioblastoma (GBM), anaplastic oligodendroglioma, pediatric GBM, and diffuse intrinsic pontine glioma (DIPG)1. An important mechanism mediating this neural regulation of brain cancer is activity-dependent cleavage and secretion of the synaptic molecule neuroligin-3 (NLGN3), which promotes glioma proliferation through the PI3K-mTOR pathway1. However, neuroligin-3 necessity to glioma growth, proteolytic mechanism of secretion and further molecular consequences in glioma remain to be clarified. Here, we demonstrate a striking dependence of HGG growth on microenvironmental neuroligin-3, elucidate signaling cascades downstream of neuroligin-3 binding in glioma and determine a therapeutically targetable mechanism of secretion. Patient-derived orthotopic xenografts of pediatric GBM, DIPG and adult GBM fail to grow in Nlgn3 knockout mice. Neuroligin-3 stimulates numerous oncogenic pathways, including early focal adhesion kinase activation upstream of PI3K-mTOR, and induces transcriptional changes including upregulation of numerous synapse-related genes in glioma cells. Neuroligin-3 is cleaved from both neurons and oligodendrocyte precursor cells via the ADAM10 sheddase. ADAM10 inhibitors prevent release of neuroligin-3 into the tumor microenvironment and robustly block HGG xenograft growth. This work defines a promising strategy for targeting neuroligin-3 secretion, which could prove transformative for HGG therapy.
To determine the necessity of microenvironmental neuroligin-3 to glioma growth, we xenografted patient-derived HGG cells expressing GFP and luciferase into Nlgn3 knockout mice2 (Nlgn3y/−;NSG). Patient-derived pediatric glioblastoma xenografts (SU-pcGBM2) to the frontal cortex were monitored using in vivo bioluminescent (IVIS) imaging over the course of six months (Fig. 1a) and evaluated histologically (Fig. 1b). Initial engraftment was equivalent in neuroligin-3 KO and WT mice (Extended Data Fig. 1a,b). A striking inhibition of glioma growth was evident in Nlgn3 KO animals for up to six months (Fig. 1a-f and Extended Data Fig. 1c,d). By 4.5 months, a subset of tumors circumvented this apparent neuroligin-3 dependency and began to exhibit growth (Fig. 1e,f, Extended Data Fig. 1c,d). The observed degree of growth inhibition was unexpected, as our previous work indicated that brain-derived neurotrophic factor (BDNF) also contributes to activity-regulated glioma proliferation1. Conditioned medium (CM) from optogenetically-stimulated acute cortical slices from Nlgn3 WT or KO;Thy1::ChR2 mice demonstrated that the increase in glioma cell proliferation induced by active CM is incompletely abrogated in the context of Nlgn3 KO (Extended Data Fig. 2a), replicating the degree of differential proliferation previously accounted for by activity-regulated Bdnf1. Taken together, these findings indicate that glioma growth is more dependent on neuroligin-3 in vivo than would have been predicted from these in situ/in vitro experiments.
Figure 1. Microenvironmental neuroligin-3 is necessary for HGG growth.
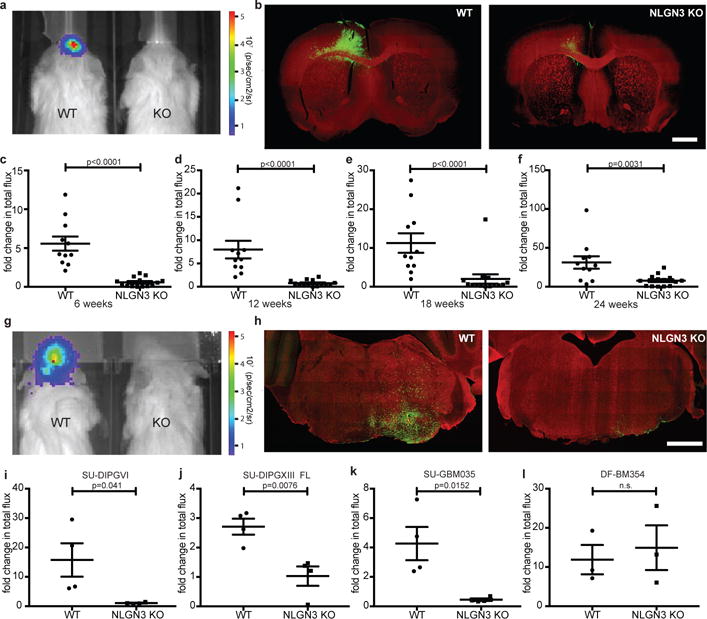
a, IVIS of WT or Nlgn3 KO mice at 3 months. Heat map, photon emission. b, Representative coronal forebrain images of xenografts in WT (n=11) and Nlgn3 KO (n=14) mice at 6 months, as in (f); GFP+ tumor cells (green) and myelin basic protein (MBP, red). Scale bar=1 mm. c-f, Fold change in total photon flux of SU-pcGBM2 xenografts in identically manipulated WT;NSG (n=11 animals) and Nlgn3y/−;NSG (n=14 animals) mice shown at 6, 12, 18, and 24 weeks. Experiment replicated in five independent cohorts of mice and data shown combined. g, Representative IVIS images of WT (left) and Nlgn3 KO (right) mice at 6 weeks following DIPG (SU-DIPG-VI) xenografting. h, Representative confocal images at the level of the pons in Nlgn3 WT (left) and Nlgn3 KO (right) mouse brains (MBP, red) bearing DIPG xenografts (green) at 6 weeks post-xenografting; as in (i), n=4/group. Scale bar=1 mm. i-l, Fold change in photon emission in (i) SU-DIPG-VI (n=4/group), (j) SU-DIPG-XIII FL (n=4/group), (k) SU-GBM035 (n=4/group), and (l) DF-BM354 (n=3 WT, n=3 KO) xenografts in WT and Nlgn3 KO mice at 6 weeks (i,j) or 4 weeks (k,l) after xenografting. Each dot represents one mouse. P values indicated on graphs, two-sided Mann-Whitney test (c-f), Student’s two-tailed t-test (i-l). Data shown as mean+/−s.e.m. 96% CI for (c) [−6.40 to −2.81]; (d) [−7.43 to −3.63]; (e) [−15.12 to −3.80]; (f) [−30.5 to −6.65]; 95% CI for (i) [−28.61 to −0.74]; (j) [−2.73 to −0.64]; (k) [−6.60 to −1.04]; (l) [−15.93 to 22.05].
The nearly normal neurological function of Nlgn3 knockout mice3–5 is attributed to compensatory expression of other neuroligins2,6. We found no effect of NLGN1, NLGN4X/Y (Extended Data Fig. 2b,c) or NLGN21 on glioma proliferation. Thus, compensatory expression of other neuroligins would not be expected to influence glioma growth, supporting a unique role for NLGN3 in glioma pathobiology.
To determine the role of neuroligin-3 in the growth of additional HGG types, patient-derived xenografts of DIPG (SU-DIPG-VI and SU-DIPG-XIII-FL) and adult glioblastoma (SU-GBM035) were tested in the Nlgn3-deficient brain. We found that DIPG, xenografted to pons or to frontal cortex, and adult glioblastoma each exhibited marked growth stagnation in Nlgn3 KO mice (Fig. 1g-k). In contrast, patient-derived HER2+ breast cancer brain metastasis xenografts (DF-BM354)7 did not exhibit differential growth in Nlgn3 WT or KO brains (Fig. 1l). These results indicate a conserved dependency on neuroligin-3 across molecularly and clinically distinct types of HGG.
The observed growth inhibition is more robust than can be explained by known effects of NLGN3 on glioma PI3K-mTOR signaling1. To better delineate the signaling consequences of neuroligin-3 exposure in glioma, we utilized phophoproteomics (Fig. 2a, Extended Data Table 1). Phospho-antibody array analyses at 5 and 30-minutes following NLGN3 exposure revealed focal adhesion kinase (FAK) phosphorylation and numerous phosphorylation events classically downstream of FAK, including activation of the SRC kinase cascade, PI3K-mTOR cascade, and SHC-RAS-RAF-MEK-ERK cascade (Fig. 2a). Additional oncogenic proteins exhibiting increased phosphorylation include integrin β3, growth factor receptors EGFR, FGFR and VEGFR, and others (Extended Data Table 1). FAK activity is central to many of these signaling events. Phospho-tyrosine pull-down analysis at 5-minutes following NLGN3 exposure similarly demonstrated FAK phosphorylation. FAK inhibition blocked the effects of NLGN3 on glioma proliferation (Fig. 2b-c). FAK phosphorylation peaked at 5-10 minutes following NLGN3 exposure, placing FAK early in the signaling cascade (Fig. 2d). FAK activity was necessary for PI3K stimulation by NLGN3 as demonstrated by AKTS473 phosphorylation (Fig. 2e).
Figure 2. Signaling consequences of neuroligin-3 in glioma.
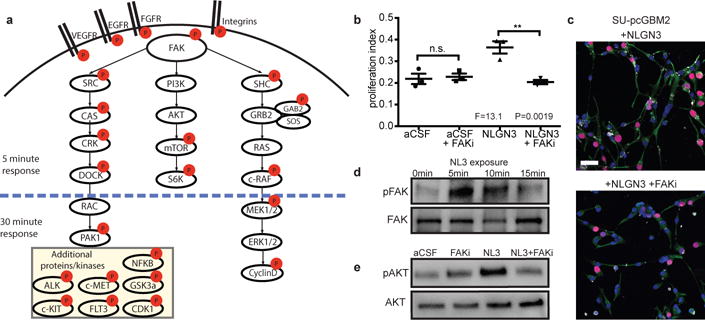
a, Schematic illustration of signaling pathways activated following NLGN3 exposure; red circles represent proteins exhibiting increased phosphorylation. b, Proliferation index of SU-pcGBM2 cells exposed to plain medium (aCSF), aCSF+5nM FAK inhibitor (FAKi), NLGN3 (50nM), or NLGN3 (50nM)+5nM FAK inhibitor (NLGN3+FAKi), (n=3 wells per condition; P and F values indicated on graph; One-way ANOVA with Tukey’s post-hoc test for multiple comparisons; Data shown as mean+/−s.e.m.). c, Representative confocal images of SU-pcGBM2 cells as in (b) exposed to NLGN3 in the absence (top) or presence of FAK inhibitor (bottom). Vimentin, green; phospho-FAK, white; DAPI, blue; EdU, red, scale bar=50 μm. d, Representative Westerns demonstrating increased phosphorylation of FAK (Tyr861) after 0, 5, 10 or 15-minute NLGN3 exposure. e, Representative Westerns demonstrating AKTS473 phosphorylation in SU-pcGBM2 cells exposed to plain medium (aCSF), aCSF+5nM FAK inhibitor (FAKi), NLGN3 (50nM), or soluble NLGN3 (50nM)+5nM FAK inhibitor, (NLGN3+FAKi). d-e) performed in biological duplicate and technical triplicate (6 replicate Westerns). 95% CI for (b) aCSF vs. aCSF + FAKi, [−0.10 to 0.08]; aCSF vs. NLGN3, [−0.24 to −0.05]; aCSF vs. NLGN3+ FAKi, [−0.08 to 0.11]; aCSF + FAKi vs. NLGN3, [−0.23 to −0.04]; aCSF + FAKi vs. NLGN3+ FAKi, [−0.07 to 0.12]; NLGN3 vs. NLGN3+ FAKi, [0.07 to 0.25].
We performed RNA sequencing (RNA-seq) following glioma exposure to NLGN3. Genes involved in cell proliferation were upregulated, as were numerous genes known to promote malignancy in glioma, including PDGFA8–10, TTYH111 and several potassium channel genes12 (Extended Data Fig. 3). In addition to NLGN31, numerous genes involved in synapse function were upregulated following NLGN3 exposure (Extended Data Fig. 3). While the meaning of this intriguing observation remains to be clarified, it suggests the biology of NLGN3 may extend beyond the role of mitogen.
The dramatic glioma growth inhibition observed in the Nlgn3-deficient brain highlights its therapeutic potential. Blocking release into the tumor microenvironment is one therapeutic strategy, so we sought to determine the proteolytic and cellular details of neuroligin-3 shedding. Full length neuroligin-3 is cleaved and secreted in an activity-regulated fashion with shedding of the N-terminal ectodomain1 (Fig. 3a-c). Optogenetic stimulation of acute cortical slices increased Nlgn3 shedding while the addition of tetrodotoxin (TTX) inhibited Nlgn3 shedding (Fig. 3c).
Figure 3. ADAM10 mediates activity-regulated neuroligin-3 shedding from both neurons and OPCs.
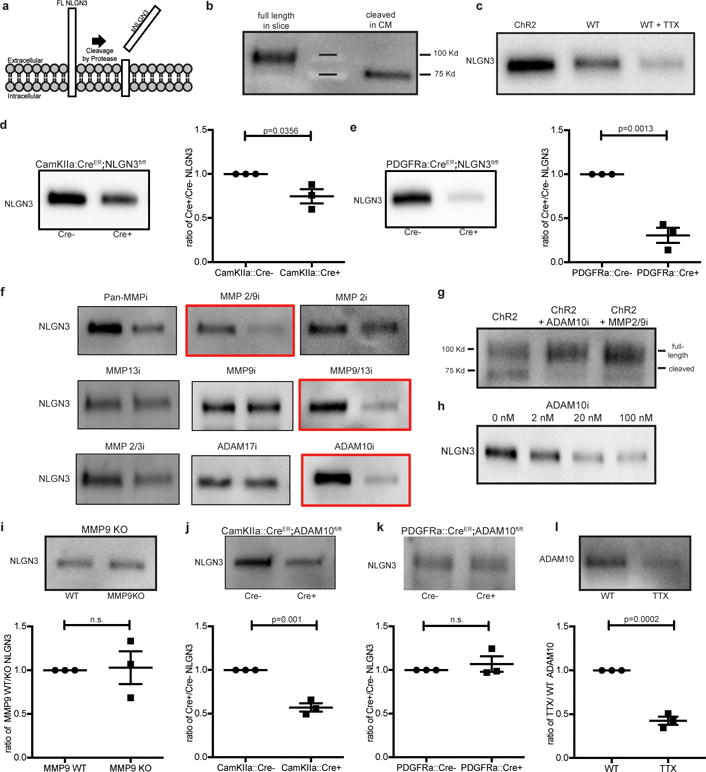
a, Schematic depicting neuroligin-3 (NLGN3) cleavage. b, NLGN3 Western of slice lysate and conditioned medium (CM). c, NLGN3 Western of CM from optogenetically-stimulated Thy1::ChR2 slices or WT slices at baseline neuronal activity +/−tetrodotoxin (TTX). d, NLGN3 Western and quantification of CM from CamKIIa::CreER;Nlgn3fl/fl or Nlgn3fl/fl (no Cre) slices (n=3 animals). e, as in d from PDGFRa::CreER;Nlgn3fl/fl model (n=3 animals). f, NLGN3 Western of CM from optogenetically stimulated Thy1::ChR2 slices +/− inhibitors as indicated. g, NLGN3 Western of optogenetically stimulated Thy1::ChR2 slice homogenates +/− ADAM10 or MMP2/9 inhibitors. h, NLGN3 Western of CM from optogenetically-stimulated Thy1::ChR2 slices +/− indicated concentration of ADAM10 inhibitor. i, NLGN3 Western and quantification of WT and Mmp9−/− slice CM (n=3 animals), j-k, like i, in CamKIIa::CreER;ADAM10fl/fl (n=3 animals) (j), or PDGFRa::CreER;ADAM10fl/fl (n=3 animals) (k) models. l, ADAM10 Western and quantification of slice CM +/− TTX. Quantifications expressed as ratio of experimental/control. P values as indicated, two-tailed Student’s t-test. Data shown as mean+/−s.e.m. All Westerns performed with n=3 biologically independent samples. 95% CI for (d) [−0.48 to −0.03]; (e) [−0.93 to −0.46]; (i) [−0.49 to 0.55]; (j) [−0.56 to −0.30]; (k) [−0.18 to 0.31]; (l) [−0.70 to −0.45].
Neuroligin-3 is highly expressed in both neurons and in oligodendrocyte precursor cells13 (OPCs; Extended Data Fig. 4a), known to form bona fide synapses with presynaptic neurons and serve as a post-synaptic cell14–16. To test the relative contribution of neurons and OPCs to neuroligin-3 secretion, mice expressing cell type-specific, inducible Cre drivers were bred to Nlgn3fl/fl mice. Tamoxifen was administered for 5 days beginning at P28, resulting in recombination in ~40% of cortical neurons in the CamKIIa::CreER driver mouse and in ~80% of OPCs in the PDGFRa::CreER driver mouse (Extended Data Fig. 4b,c). Using the acute slice paradigm together with inducible, conditional deletion of Nlgn3 from either neurons or from OPCs, we find that both cells types contribute to activity-regulated neuroligin-3 secretion, and notably OPCs are a major source of secreted neuroligin-3 (Fig. 3d,e), defining a role for OPCs as a microenvironmental cell type contributing to glioma growth.
Neuroligin-3 exposure results in feed-forward glioma expression of NLGN31, and we thus asked if glioma cells contribute to the pool of secreted NLGN3. Elevated neuroligin-3 levels were found in CM from glioma xenograft-bearing, Nlgn3 WT brain slices compared to non-xenograft-bearing slices (Extended Data Fig. 5a,b). CM from NLGN3-primed glioma cultures also exhibit upregulated secretion (Extended Data Fig. 5c). In contrast, xenograft-bearing brain slices from Nlgn3 KO mice secrete no detectable NLGN3 (Extended Data Fig. 5b). These data indicate that glioma cells contribute to NLGN3 in the tumor microenvironment in a manner regulated by neuroligin-3 exposure from normal stromal cells.
To determine the enzyme responsible for the cleavage of neuroligin-3, we analyzed the c-terminal transmembrane domain for putative cleavage sites (https://prosper.erc.monash.edu.au/home.html). This indicated MMP and ADAM family proteases as candidate enzymes, a prediction consistent with the reported enzyme(s) responsible for Nlgn1 cleavage17,18 and neural ADAM10 targets19. Active slice CM generated in the absence and presence of various protease inhibitors exhibited decreased neuroligin-3 shedding with MMP9 and ADAM10 inhibitors (Fig. 3f-g). Increased full-length neuroligin-3 was observed in brain slice lysate concomitant with the observed decrease in cleaved neuroligin-3 in CM with either MMP9 or ADAM10 inhibitors (Fig. 3g). ADAM10 inhibition blocks neuroligin-3 shedding in a dose-dependent manner (Fig. 3h). Neither protease inhibitor directly affects glioma proliferation despite intrinsic expression of ADAM10 (Extended Data Fig. 5d). However, decreased neuroligin-3 levels in active CM in response to protease inhibition elicit correspondingly reduced proliferation of exposed glioma cells (Extended Data Fig. 6a-d), and add back of NLGN3 rescues proliferation (Extended Data Fig. 6d). MMP9 and ADAM10 thus emerge as candidate enzymes mediating neuroligin-3 cleavage.
Given the possibility of cross-inhibition with pharmacological protease inhibition, genetic models were employed to more definitively determine the proteolytic mechanism. Acute cortical slices from Mmp9 knockout mice showed no change in neuroligin-3 secretion (Fig. 3i), suggesting that MMP9 is not responsible for neuroligin-3 cleavage. Conditional knockout of Adam10 from CamKIIa+ neurons resulted in ~50% decrease in secreted neuroligin-3 (Fig. 3j), whereas conditional deletion of Adam10 from OPCs did not influence neuroligin-3 secretion (Fig. 3k). Incubation with tetrodotoxin (TTX) substantially abrogates ADAM10 release into active slice CM (Fig. 3l), demonstrating activity-regulated release of ADAM10, a finding consistent with reports of ADAM10 localized to synaptic vesicles20. Taken together, these data indicate that ADAM10, released in activity-dependent fashion from neurons, is the chief enzyme responsible for neuroligin-3 shedding.
We next investigated the therapeutic potential of ADAM10 inhibition. ADAM10 is expressed in gliomas as reported in the literature21,22 and demonstrated in gene expression datasets from pediatric and adult HGG samples (Extended Data Fig. 5d). Cell-intrinsic effects of ADAM10 inhibition have been reported in adult HGG22–24, so we assessed possible direct effects of ADAM10 inhibition on the pHGG cells used here. ADAM10 inhibition did not change proliferation, cell viability or invasion of pHGG cells (Extended Data Fig. 6e-g). ADAM10 inhibition mildly affected pHGG self-renewal (Extended Data Fig. 6h-i).
We next tested the influence of ADAM10 inhibition on HGG growth in vivo. Brain penetration of the specific ADAM10 inhibitor GI254023X was assessed and found to be sufficient (Extended Data Table 2). Given effects of ADAM10 inhibition on glioma self-renewal and therefore tumor initiation, drug treatment started well after engraftment. Mice bearing pediatric glioblastoma (SU-pcGBM2) or DIPG (SU-DIPGVI or SU-DIPG-XIX) orthotopic xenografts were treated with GI254023X or vehicle control. pGBM and both DIPG xenografts in mice treated with the ADAM10 inhibitor exhibited robust growth reduction compared to vehicle-treated controls (Fig. 4a-c). Histological analyses revealed reduced glioma proliferation in ADAM10 inhibitor-treated animals (Fig. 4d-e and Extended Data Fig. 7a). Furthermore, ADAM10 inhibition abrogated glioma cell secretion of neuroligin-3 from both xenograft-bearing brain slices and NLGN3-primed glioma cells (Extended Data Fig. 5b,c), suggesting this therapeutic strategy addresses all cellular sources of neuroligin-3.
Figure 4. ADAM10 inhibition blocks glioma growth.
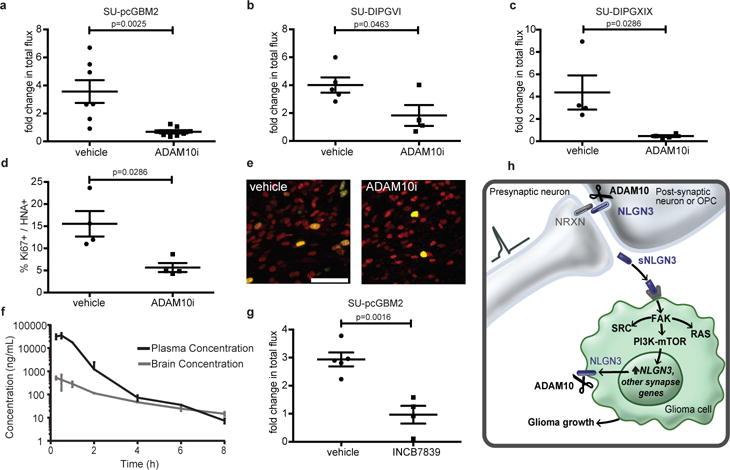
a-c, Orthotopic xenograft growth (fold change in photon flux) following systemic administration of GI254023X or vehicle control for (a) SU-pcGBM2 (n=7 control, n=8 treated mice), (b) SU-DIPG-VI (n=5 control, n=4 treated mice), (c) SU-DIPG-XIX (n=4 control, n=4 treated mice) xenografts. d, In vivo proliferation index of SU-pcGBM2 cells in vehicle control and ADAM10i treated mice (n=4 mice/group). e, Representative confocal images (Ki67+, green; human nuclear antigen, HNA+ red) of SU-pcGBM2 xenografts in vehicle-treated or ADAM10i-treated mice (n=4 mice/group) as in (d). Scale bar=50μm. f, Pharmacokinetics of INCB7839; (n=3 mice/data point). g, Growth (fold change in photon flux) of SU-pcGBM2 xenografts following systemic administration of INCB7839 or vehicle control; (n=5 control, n=4 treated mice) h, Schematic summary; (neurexin = NRXN; soluble neuroligin-3 = sNLGN3). P values indicated in graphs. n.s. = not significant. Student’s two-tailed t-test (a,b,g,); two-sided Mann-Whitney (c,d). Each dot represents one mouse. Data are shown as mean +/− s.e.m except in (f) error bars are +/− st. dev. 95% CI for (a) [−4.53 to −1.22]; (b) [−4.32 to −0.05]; (g) [−2.91 to −1.04]; 97% CI for (c) [−8.63 to −1.66]; (d) [−19.39 to −2.32].
ADAM10 inhibitors have been developed for clinical use, and the ADAM10/17 inhibitors INCB7839 and XL-784 have been through Phase II clinical trials for other diseases25,26. Brain penetration of INCB7839 was superior to XL-784 (Fig. 4f and Extended Data Fig. 7b) and sufficient to inhibit ADAM10 enzymatic function25,26 (Fig. 4f). INCB7839 robustly inhibited growth of pGBM orthotopic xenografts (Fig. 4g). ADAM10 mediates cleavage of numerous cell surface proteins, prominently targeting synapse-associated proteins19, and also plays an important role in amyloid protein processing27. While ADAM10 inhibition appears well-tolerated in clinical trials25,26, and caused no overt neurotoxicity here (Extended Data Fig. 8), long-term effects on neurological function should be carefully evaluated.
The dependency of HGG growth on microenvironmental neuroligin-3 is conserved across multiple classes of pediatric and adult HGG (Supplementary Note 1). The magnitude of this effect both underscores its potential as a therapeutic target and suggests that the mechanisms by which NLGN3 promotes HGG growth (Fig. 4h) are incompletely understood. Future work will need to elucidate further mechanisms by which NLGN3 regulates glioma progression and clarify how the cancer may circumvent this dependency. Targeting the ADAM10 sheddase represents a potentially transformative strategy to modulate neuroligin-3 levels in the tumor microenvironment for HGG therapy.
Methods
Mice and housing conditions
All in vivo experiments were conducted in accordance with protocols approved by the Stanford University Institutional Animal Care and Use Committee (IACUC) and performed in accordance with institutional guidelines. Animals were housed according to standard guidelines with free access to food and water in a 12-hour light/dark cycle. For brain tumor xenograft experiments, the IACUC does not set a limit on maximal tumor volume but rather on indications of morbidity; mice were euthanized if they exhibited signs of neurological morbidity or if they lost 15% or more of their body weight.
For constitutive Nlgn3 knockout studies, Nlgn3 KO mice (The Jackson Laboratory) were intercrossed with NSG mice (NOD-SCID-IL2R gamma chain-deficient, The Jackson Laboratory) to produce the Nlgn3 KO;NSG genotype. All Nlgn3 mouse model experiments were performed with male mice, either hemizygous WT Nlgn3 (Nlgn3y/+;NSG) or hemizygous null Nlgn3 littermates (Nlgn3y/−;NSG).
For conditional knockout experiments, Nlgn3fl/fl mice (a kind gift from Dr. Thomas Sudhof) or ADAM10fl/fl mice (The Jackson Laboratory) were crossed to CamKIIa:CreER (The Jackson Laboratory) or PDGFRa::CreER (The Jackson Laboratory). Cre+ or control Cre− floxed mice were treated with 100mg/kg tamoxifen i.p. for 5 days and experiments were performed 7 days after the end of treatment. Tamoxifen was given from postnatal day 28 (P28) to P33 and brain slice experiments performed at P40.
Mmp9−/− mice (The Jackson Laboratory) were used in brain slice experiments at P40. Thy1::ChR2 (Jackson Labs, line 18) were used in brain slice experiments at 4-7 weeks of age.
Bioluminescent imaging
For in vivo monitoring of tumor growth, bioluminescence imaging was performed using an IVIS imaging system (Xenogen). Mice orthotopically xenografted with luciferase-expressing glioma cells were placed under isofluorane anesthesia and injected with luciferin substrate. Animals were imaged at baseline and randomized based on tumor size by a blinded investigator so that experimental groups contained an equivalent range of tumor sizes. All total flux values were then normalized to baseline values to determine fold change of tumor growth. Statistical analysis between tumor burden in each group was assessed using Student’s two-tailed t-test (parametric data) or Mann-Whitney test (non-parametric data). Based on the variance of xenograft growth in control mice, we used at least 3 mice per genotype to give 80% power to detect an effect size of 20% with at a significance level of 0.05.
Orthotopic xenografting
Patient-derived DIPG cells (SU-DIPG-VI, from a pontine DIPG tumor or SU-DIPG-XIII FL, from a frontal lobe DIPG metastasis), adult glioblastoma cells, (SU-GBM035 cells) or HER2+ breast cancer brain metastasis cells (DF-BM354 cells) expressing firefly luciferase were xenografted into the orthotopic location of derivation in Nlgn3y/+;NSG and Nlgn3y/−;NSG mice. A single-cell suspension from cultured neurospheres was prepared in sterile PBS immediately prior to the xenograft procedure. Animals at P34-36 were anesthetized with 1-4% isoflurane and placed in a stereotactic apparatus. The cranium was exposed via midline incision under aseptic conditions. 600,000 glioma cells in 3 μL sterile PBS were stereotactically implanted in either the premotor cortex (M2) (SU-pcGBM2, SU-DIPG-XIII FL and SU-GBM035) or the pons (SU-DIPGVI and SU-DIPGXIX) through a 31-gauge burr hole, using a digital pump at infusion rate of 0.4 μL/minute and 31-gauge Hamilton syringe. For breast cancer brain metastasis studies, 100,000 DF-BM354 cells were similarly xenografted in the premotor cortex. Stereotactic coordinates used were as follows: for premotor cortex, 0.5 mm lateral to midline, 1.0 mm anterior to bregma, −1.75 mm deep to cranial surface; for pons, 1.0 mm lateral to midline, −0.8 mm posterior to lambda, −5.0 mm deep to cranial surface. At the completion of infusion, syringe needle was allowed to remain in place for a minimum of 2 minutes, then manually withdrawn at a rate of 0.875 mm/minute to minimize backflow of the injected cell suspension.
Perfusion and immunohistochemistry
Animals were anesthetized with intraperitoneal Avertin (tribromoethanol), then transcardially perfused with 20 mL of PBS. Brains were fixed in 4% paraformaldehyde overnight at 4°C, then transferred to 30% sucrose for cryoprotection. Brains were embedded in Tissue-Tek O.C.T. (Sakura) and sectioned in the coronal plane at 40 μm using a sliding microtome (Microm HM450; Thermo Scientific). For immunohistochemistry, coronal sections were incubated in blocking solution (3% normal donkey serum, 0.3% Triton X-100 in TBS) at room temperature for 30 minutes. Chicken anti-GFP (1:500, Abcam), Rat anti-MBP (1:300, Abcam), Mouse anti-human nuclei clone 235-1 (1:100; Millipore), rabbit anti-Ki67 (1:500; Abcam), rabbit anti-cleaved caspase 3 (1:200, Cell Signaling), or mouse anti-NeuN (Millipore, 1:2000) were diluted in 1% blocking solution (1% normal donkey serum in 0.3% Triton X-100 in TBS) and incubated overnight at 4°C. Sections were then rinsed three times in 1X TBS and incubated in secondary antibody solution (Alexa 488 donkey anti-chicken IgG, 1:500 (Jackson Immuno Research); Alexa 594 donkey anti-mouse IgG, 1:500 (Life Technologies); Alexa 647 donkey anti-rabbit IgG, 1:500 (Life Technologies); Alexa 594 donkey anti-rat IgG, 1:1000 (Life Technologies)) in 1% blocking solution at 4°C overnight. Sections were rinsed 3 times in TBS and mounted with ProLong Gold Mounting medium (Life Technologies).
Cell culture
For all human tissue studies, informed consent was obtained and tissue was used in accordance with protocols approved by the Stanford University or Dana Farber Cancer Institute Institutional Review Board (IRB). For all patient-derived cultures, short tandem repeat (STR) DNA fingerprinting was performed every three months to verify authenticity. The STR fingerprints and clinical characteristics for the patient-derived cultures used have been previously reported1 with the exception of SU-DIPG-XIX which is a H3.3K27M mutant tumor that was derived from the brainstem at the time of autopsy from a male who was 2 years of age at diagnosis, treated with radiotherapy and cabazitaxel, and survived 18 months. STR fingerprint for SU-DIPG-XIX is: X/Y (AMEL), 10/11 (CSF1PO1), 13/14 (D13S317), 9/13 (D16S539), 30/30 (D21S11), 11/12 (D5S818), 10/10 (D7S820), 9.3/9.3 (TH01), 8/11 (TPOX), 17/18 (vWA). All cell cultures were routinely tested for mycoplasma.
All high-grade glioma cultures were generated as previously described1. In brief, tissue was obtained from high-grade glioma (WHO grade III or IV) tumors at the time of biopsy or from early post-mortem donations. Tissue was dissociated both mechanically and enzymatically and grown in a defined, serum-free medium designated “Tumor Stem Media (TSM)”, consisting of Neurobasal(-A) (Invitrogen), B27(-A) (Invitrogen), human-bFGF (20 ng/mL) (Shenandoah Biotech), human-EGF (20 ng/mL) (Shenandoah), human PDGF-AA (10 ng/mL) and PDGF-BB (10 ng/mL) (Shenandoah) and heparin (2 ng/mL) (Stem Cell Technologies).
Breast cancer brain metastasis line, PDX DF-BM354, was provided by the Zhao lab and developed as previously described7.
Generation of conditioned medium from acute cortical slices
Conditioned medium was generated as previously described1. Mice (genotype varied based on experiment) between the ages of 4-7 weeks were briefly exposed to 4% isofluorane and immediately cervically dislocated and decapitated. Extracted brains were placed in oxygenated high-sucrose solution and sliced in 350-μm sections. Slices were then placed in buffering solution (aCSF) and allowed to recover for at least one hour. After recovery, slices were then moved into fresh aCSF in a 24-well plate and slices optogenetically stimulated using a blue-light LED to observe the effects of elevated neuronal activity (in the case of Thy1::ChR2 brain slices) or unstimulated to observe the effects of baseline neuronal activity. Following recovery, medium was conditioned for 30 minutes. For various experiments, conditioned medium was prepared in the presence of various protease inhibitors (described below) or tetrodotoxin at 1uM (Tocris). Surrounding medium was then collected for immediate use or frozen at −80°C for future experiments. All slice experiments were performed in three biological replicates unless otherwise indicated.
EdU incorporation assay
8-well chamber slides were coated with poly-L-lysine. Cells were then seeded at 40,000 cells per well and exposed to various conditions based off the assay (aCSF, aCSF plus the relevant inhibitor (see below), active conditioned medium (conditioning methods vary by assay), recombinant NLGN3 (Origene Technolgies), NLGN1 (R&D Systems), NLGN4 (R&D Systems), or NLGN4Y (R&D Systems)). 10 μM EdU was added to each well. Cells were fixed after 24 hours using 4% paraformaldehyde in PBS and stained using the Click-iT EdU kit and protocol (Invitrogen). Proliferation index was then determined by quantifying percentage of EdU labeled cells using confocal microscopy at 200× magnification. Group mean differences were otherwise assessed using one-way analysis of variance (one-way ANOVA) with Tukey’s post-hoc tests to further examine pairwise differences. All experiments were performed in three biological replicates.
CellTiter-Glo assay of cell viability
To assess overall cell number, 5000 glioma cells were seeded in minimal growth medium in a 96-well plate with varying concentrations of ADAM10 inhibitor. After 24, 48, or 72 hours, CellTiter-Glo reagent (Promega) was added at a 1:1 ratio. Luminescence was measured after 10-minute incubation at room temperature to stabilize signal. All experiments were performed in three biological replicates.
Inhibitors used
Batimastat at 20nM (Pan MMP inhibitor; BB-94; Selleck Chemicals); MMP-2/MMP-9 Inhibitor II at 50nM (sc-311430; Santa Cruz biotechnology); ARP 100 at 20nM (MMP2 inhibitor) (R&D Systems); MMP-13 Inhibitor at 10nM (sc-205756; Santa Cruz biotechnology); MMP-9 Inhibitor I at 100nM (sc-311437; Santa Cruz biotechnology); MMP-9/MMP-13 Inhibitor II at 10nM (sc-311439; Santa Cruz biotechnology); MMP2/MMP-3 Inhibitor I at 20uM (sc-295483; Santa Cruz biotechnology); TAPI-1 at 20uM (ADAM17 inhibitor; S7434; Selleck Chemicals); GI254023X at 200nM unless otherwise indicated (ADAM10 inhibitor; Sigma Aldrich); PF-00562271 at 5nM (FAK inhibitor; S2672; Selleck Chemicals).
Analysis of NLGN3 secretion from glioma
For in vivo studies demonstrating NLGN3 secretion from xenograft-bearing slices, mice were xenografted as above with SU-DIPG-XIII or SU-GBM035 cells in premotor cortex. Brains were extracted and used for conditioned medium experiments in comparison to non-xenografted littermate controls at 5 months (SU-DIPG-XIII) or 6 weeks (SU-GBM035). These experiments were performed in duplicate for SU-DIPG-XIII xenograft-bearing cortical slices and in triplicate for SU-GBM035 xenograft-bearing cortical slices (five biological replicates in total). For in vivo studies demonstrating neuroligin secretion from xenograft-bearing slices can be blocked by ADAM10 inhibition, mice were xenografted as above with SU-GBM035 cells in premotor cortex and brains were extracted at 6 weeks post xenograft. Cortical slices were made and incubated in the presence or absence of 200nM ADAM10 inhibitor, GI 254023X. CM was then analyzed using Western blot analyses, comparing non-xenograft bearing slices to xenograft-bearing slices from WT or Nlgn3 KO mice in the presence of absence of ADAM inhibitor. These experiments were performed in triplicate.
For in vitro studies of NLGN3 secretion from glioma cells, SU-pcGBM2 cells were seeded at 5 million cells/well in the presence of either vehicle, 100nM recombinant NLGN3, 200nM GI 254023X, or 100nM NLGN3 + 200nM GI254023X for 48 hours. After thorough rinsing of the cells, cells were left in either fresh medium or 200nM GI 254023X for another 48 hours in the presence or absence of ADAM10 inhibition. After 48 hours, medium was collected and analyzed for presence of cleaved NLGN3 using Western blot analyses as described below. Experiments were performed in three biological replicates.
Spheroid invasion assay was performed as previously described12.
Neurosphere formation assay
ELDA (extreme limiting dilution analysis) was performed to evaluate self-renewal capacity30. SU-pcGBM2 cells were dissociated in TrypLE (+ DNase and HEPES) for 5min at 37C. Cells were triturated into a single cell solution. The solution was incubated with Hoechst (Thermo, cat. 33342) for 30min at 37°C. Live cells were identified using a LIVE/DEAD staining kit (Thermo, cat. L10119). Live cells were sorted into 96 well plates. Spheres were counted at 14 days. Cell density per well ranged from: 1, 10, 25, 50, 100, 250, 500, 1000. Each condition was tested in 10 independent wells. Volume of medium per well was 200 μl medium with growth factors spike-ins every 3-4 days. The ADAM10 inhibitor was reconstituted in DMSO. Each well was adjusted to have 0.1% DMSO, except for the no-DMSO control wells. Neurosphere-forming capability was determined using the Extreme Limiting Dilution Analysis (ELDA) web-based tool (http://bioinf.wehi.edu.au/software/elda/).
Western Blot analyses
Western blot analyses were used to probe for protein levels present in either brain slice homogenate or secreted into slice conditioned medium. For slice homogenates, brain slices were lysed using RIPA buffer and protease inhibitors. Lysates were incubated on ice for 10 minutes and then centrifuged for 10 minutes at 4°C. All samples were normalized to protein concentration, mixed with Laemmli loading buffer (1:4), boiled for 5 minutes, and loaded onto BioRad Mini-Protean TGX precast gels. Protein was transferred to PVDF membranes and blocked with 5% bovine serum albumin (BSA) in TBST for one hour. Anti-Neuroligin-3 (NovusBio; 1:250), Anti-phospho FAK pTyr861 (Thermo Fisher Scientific; 1:500), and anti-FAK (Cell Signaling Technologies; 1:500), or anti-ADAM10 (Abcam; 1:500) were diluted in 1% BSA/TBST and incubated with the membrane overnight. Secondary anti-rabbit conjugated to HRP (BioRad) was then added for one hour (1:1000). Proteins were visualized using Clarity ECL Western Substrate (BioRad) and quantified and analyzed using ImageJ.
Phospho-antibody array
The Phospho Explorer antibody array assay was performed by Full Moon Biosystems on patient-derived pediatric glioblastoma (SU-pcGBM2) cells. Cell lysates were prepared using Protein Extraction Kit (Full Moon BioSystems). Clear supernatant of the lysates was separated, biotinylated, and incubated with Phospho Explorer Antibody Arrays (Full Moon BioSystems) for two hours at room temperature. The array slides were washed with Wash Buffer (Full Moon BioSystems) and rinsed with DI water. The slides were then incubated with Cy3-Streptavidin for 45 minutes at room temperature, then washed, rinsed and dried. Arrays were scanned on GenePix Array Scanner (Molecular Devices). Image quantification was performed on GenePix Pro (Molecular Devices). Signal intensity data for each spot on the array was extracted from array images. Since there are two replicates printed for each antibody, the mean signal intensity of the replicates is determined. The data is then normalized to the median value (signal intensity) of all antibodies on the slide. Finally, fold change between Control Sample and Treatment Sample is determined using the normalized data (Treatment Sample’s signal is divided by Control Sample’s signal).
Phospho-tyrosine pull down assay
Samples were analyzed using the Cell Signaling Technology PTMScan method as previously described31–33. Cellular extracts were prepared in urea lysis buffer, sonicated, centrifuged, reduced with DTT, and alkylated with iodoacetamide. 15mg total protein for each sample was digested with trypsin and purified over C18 columns for enrichment with the Phosphotyrosine pY-1000 antibody (#8803) and the PTMScan Direct Tyr Kinases Reagent33. Enriched peptides were purified over C18 STAGE tips (Rappsilber). Enriched peptides were subjected to secondary digest with trypsin and second STAGE tip prior to LC-MS/MS analysis.
Replicate injections of each sample were run non-sequentially for each enrichment. Peptides were eluted using a 90-minute linear gradient of acetonitrile in 0.125% formic acid delivered at 280 nL/min. Tandem mass spectra were collected in a data-dependent manner with an LTQ Orbitrap Elite mass spectrometer running XCalibur 2.0.7 SP1 using a top-twenty MS/MS method, a dynamic repeat count of one, and a repeat duration of 30 sec. Real time recalibration of mass error was performed using lock mass34 with a singly charged polysiloxane ion m/z = 371.101237.
MS/MS spectra were evaluated using SEQUEST and the Core platform from Harvard University35–37. Files were searched against the NCBI rattus norvegicus FASTA database updated on May 22, 2015. A mass accuracy of +/−5 ppm was used for precursor ions and 1.0 Da for product ions. Enzyme specificity was limited to trypsin, with at least one LysC or tryptic (K- or R-containing) terminus required per peptide and up to four mis-cleavages allowed. Cysteine carboxamidomethylation was specified as a static modification, oxidation of methionine and phosphorylation on serine, threonine, and tyrosine residues were allowed as variable modifications. Reverse decoy databases were included for all searches to estimate false discovery rates, and filtered using a 5% FDR in the Linear Discriminant module of Core. Peptides were also manually filtered using a -/+ 5ppm mass error range and reagent-specific criteria. For each antibody reagent results were filtered to include only phosphopeptides matching the sequence motif(s) targeted by the antibodies included. All quantitative results were generated using Progenesis V4.1 (Waters Corporation) to extract the integrated peak area of the corresponding peptide assignments. Accuracy of quantitative data was ensured by manual review in Progenesis or in the ion chromatogram files.
RNA Sequencing
Samples were processed and analyzed as previously described12 with minor modifications as indicated below:
RNA was extracted from Trizol-lysed cells and 1 μg of total RNA was used for each sample. Polyadenylated RNA was selected using Ambion Dynabeads mRNA Purification Kit (Life Technologies 61006) and fragmented with Fragmentation Buffer (Ambion, #AM8740). First strand synthesis was performed using Random Hexamer Primers (Invitrogen, #48190-011) and SuperScript II (Invitrogen, #18064-014). Second strand synthesis was performed using DNA Pol I (Invitrogen #18010-025) and RNA was removed using RNaseH (Invitrogen #18021-014).
Libraries were end-repaired, 3′ A-tailed, and ligated to NEBNext Multiplex Oligo Adaptors (NEB E7335S). Sequencing was performed on an Illumina NextSeq 500 by Stanford Functional Genomics Facility.
Reads were mapped to hg19 annotation using Tophat238 (version 2.0.13) and transcript expression was quantified against RefSeq gene annotations using featureCounts39. Differential testing and log2 fold change calculation was performed using DESeq240 with default multiple hypothesis adjustment to reduce false positives (Benjamini-Hochberg, FDR = 0.1). Gene Ontology analyses were performed using DAVID41,42.
Pharmacokinetic studies
LC-MS/MS analysis of GI254023X concentrations in tissues and serum
Sample preparation
A single 100 mg/kg dose was delivered i.p. in NOD-SCID-IL2R γ chain–deficient mice, and tissue samples collected 30 min later for analysis using liquid chromatography/tandem mass spectrometry (LC-MS/MS). Tissues samples were weighed and 1 volume of bullet blender beads (Next Advance) and 3 volume of Milli-Q water were added. Tissues were homogenized by a bullet blender (Next Advance) at 4°C according to manufacturer’s instruction. The neat stock solution of GI254023X was dissolved in DMSO at 5 mg/ml and further diluted in 50% methanol to prepare spiking solutions. For spiked standard curve, 25 μl of GI254023X spiking solutions (0.5 - 1000 ng/ml for brain samples and 1 – 100 μg/ml for serum and kidney samples) was mixed with 25 μl of blank tissue homogenate or serum. For samples, the spiking solution was replaced by 25 μl of 50% methanol to make up the volume. After vortexing all standards and samples, 150 μl of methanol/acetonitrile 20:80 (v/v) was added to the mixture and vortexed vigorously for 1 min followed by centrifugation at 3,000 g for 10 min. The supernatant was diluted 3 times in Milli-Q water for brain samples and 100 times in 25% methanol for serum and kidney samples. The LC-MS/MS system consists of a QTRAP 4000 mass spectrometer (AB SCIEX) coupled to a Shimadzu UFLC system. LC separation was carried out on a ZORBAX SB-Phenyl column (4.6 mm × 50 mm, 3.5 μm) (Agilent) at room temperature. The analysis time was 3 min. The injection volume was 5-10 μl. Isocratic elution was carried out with a mobile phase composed of 55% water and 45% acetonitrile with 0.1% of formic acid and a flow rate of 0.5 ml/min. The mass spectrometer was operated in the positive mode with multiple-reaction monitoring (MRM) with the transition m/z 392.2→361.2. Data acquisition and analysis were performed using the Analyst 1.6.1 software (AB SCIEX).
LC-MS/MS analysis of INCB7839 (Aderbasib) and XL-784 in brain tissue and serum
Aderbasib was purchased from Astatech, Inc. XL-784 was provided by True Pharmachem, Inc. A single 50 mg/kg dose of INCB7839 (aderbasib) or XL-784 was delivered i.p. in NOD-SCID-IL2R γ chain–deficient (NSG) mice, and tissue samples collected at various time points for analysis using liquid chromatography/tandem mass spectrometry (LC-MS/MS). NSG mice were purchased from the Model Animal Research Center of Nanjing University. Study was conducted by Crown Biosciences, Inc. in accordance with a protocol approved by the Institutional Animal Care and Use Committee (IACUC) of CrownBio and in accordance with the regulations of the Association for Assessment and Accreditation of Laboratory Animal Care (AAALAC). Compounds were formulated in 2% DMSO, 2% Tween 80, 48% PEG300, 48% water. Compounds were administered i.p., with a dosing volume of 10 μL/g and concentration of 5 mg/ml. Compounds were dosed at 50 mg/kg. A cohort of 24 male, NSG mice, age 6-8 weeks, body weight 18-22 grams, were used for each study. Animals were housed at room temperature, under 40-70% humidity, with a 12 hour light/12 hour dark schedule. Mice were fed with Co60 dry granule food, with free access to reverse osmosis water. Eight time points were collected for each compound (0.25, 0.5, 1, 2, 4, 6, 8, and 24 h), with an n=3 for each time point. Blood was collected via cardiac puncture and collected into potassium-EDTA Eppendorf tubes. Samples were centrifuged within 30 minutes to afford plasma samples. Brains were collected at each time point, PBS (4X) was added, and the material homogenized with a Tissue Lyser II to give a fine homogenate. Brain homogenate (50 μL) was treated with 250 μL acetonitrile (containing 200 ng/mL tolbutamide), which was then vortexed and then centrifuged at 4000 rpm for 20 min. The supernatant was collected and mixed with a 0.1% aqueous formic acid solution. Samples were analyzed on a Waters UPLC or Agilent 1200 Liquid chromatography system, with an API 4000 mass spectrometer, and a 10 μL injection volume, with tolbutamide as an internal standard. Pharmacokinetics were analyzed using WinNonlin6.3 (non-compartmental model).
Mouse drug treatment studies
For all drug studies, NSG mice were xenografted as above with either SU-pcGBM2, SU-DIPGVI, or SU-DIPG-XIX cells. Four weeks post-xenograft, animals were treated with either systemic administration of ADAM10 inhibitor, GI254023X (Sigma-Aldrich; formulated in 10% DMSO in 0.1M carbonate buffer) via intraperitoneal injection 5 days per week at 100mg/kg or systemic administration of ADAM10/17 inhibitor, INCB7839 (Astatech, Inc; formulated in 2% DMSO, 2% Tween 80, 48% PEG300, 48% water) via intraperitoneal injection 5 days per week at 50mg/kg. For both studies, controls were intraperitoneally injected with an identical volume of vehicle. Drug treatment began four weeks after xenografting and continued through week six. Bioluminescence imaging was performed by a blinded investigator before treatment, and again 7 days and 14 days later, using an IVIS imaging system (Xenogen) under isoflurane anesthesia. Similar to above, tumor burden was assessed as fold change in total flux from the beginning to end of treatment. All differences were statistically verified using Students two-tailed t-test.
Confocal imaging and quantification of cell proliferation
Cell quantification was performed by a blinded investigator using live counting at 400× magnification using a Zeiss LSM700 scanning confocal microscope and Zen 2011 imaging software (Carl Zeiss Inc.). The area for quantification was selected as follows: of a 1 in 6 series of 40-μm coronal sections, 3 consecutive sections were selected at approximately 1.1–0.86 mm anterior to bregma (Figures 22, 23, 24; Franklin & Paxinos, The Mouse Brain in Stereotaxic Coordinates, 3rd Ed. 2008); using our stereotactic coordinates for tumor xenograft, these sections are expected to include the tissue most proximal to the site of tumor cell implantation in the coronal plane. For each of the three consecutive sections, the cingulum bundle was first identified as an anatomic landmark, and six 160×160-μm field area for quantification were selected centered around this landmark within cortical layer 6b of M2. Within each field, all human nuclear antigen (HNA)-positive tumor cells were quantified to determine tumor burden within the areas quantified. HNA-positive tumor cells were then assessed for double-labeling with or Ki67. To calculate proliferation index (the percentage of proliferating tumor cells for each animal), the total number of HNA-positive cells co-labeled with Ki67 across all areas quantified was divided by the total number of human nuclei-positive cells counted across all areas quantified. Differences in proliferation indices were calculated using unpaired, two-tailed Student’s t-tests (parametric data) or Mann-Whitney test (non-parametric data).
Statistical Analyses
Statistical tests were conducted using Prism (GraphPad) software unless otherwise indicated. Gaussian distribution was confirmed by the Shapiro-Wilk normality test. For parametric data, unpaired, two-tailed Student’s t-tests and one-way ANOVAs with Tukey’s post-hoc tests to further examine pairwise differences were used. For non-parametric data, two-sided Mann-Whitney test was used. The limiting dilution assay to test for neurosphere forming capacity was analyzed with a chi-squared test using the Extreme Limiting Dilution Analysis (ELDA) web-based tool (http://bioinf.wehi.edu.au/software/elda/). A level of P < 0.05 was used to designate significant differences. Based on the variance of xenograft growth in control mice, we used at least 3 mice per genotype to give 80% power to detect an effect size of 20% with a significance level of 0.05. For all animal experiments, the number of independent mice used are listed in figure legend. For all Western blots, analyses were done in biological triplicate, except in the case of Figure 2d-e and Extended Figure 6a, where analyses were done in biological duplicates and technical triplicates.
Statistical analyses for proteomic and RNA-seq data are described above in the respective sections.
Extended Data
Extended Data Figure 1. Orthotopic xenografts of pediatric glioblastoma fail to grow in the neuroligin-3-deficient brain.
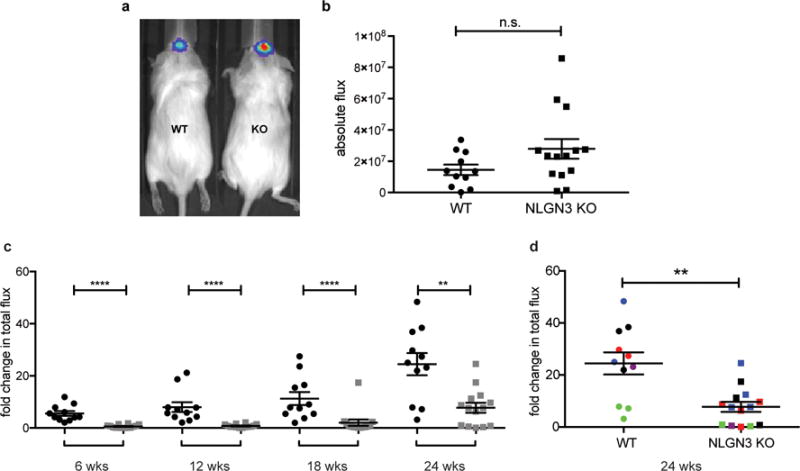
a, Engraftment is equivalent in Nlgn3 knockout and wild type mice. In vivo bioluminescence imaging of SU-pcGBM2 xenografts two weeks following xenograft in WT;NSG (“WT”; left) or Nlgn3 KO;NSG mice (“KO”; right). The heat map superimposed over the mouse heads represents the degree of photon emission by cells expressing firefly luciferase. b, Absolute flux of pHGG cells in identically manipulated WT;NSG (n=11) and Nlgn3 KO;NSG (n=14) mice, measured by IVIS imaging two weeks post-xenograft illustrates no significant difference in tumor engraftment. Two-sided Mann-Whitney test, n.s. = not significant (P > 0.05). Data are shown as mean +/− s.e.m. c-d, Data from main Figure 1 shown on the same axis (c) and with each independent cohort color coded for comparison of littermates (d). Data illustrate growth of pHGG (SU-pcGBM2) xenografts in identically manipulated WT;NSG (black dots, n=11) and Nlgn3y/−;NSG (grey dots, n=14) mice, measured by IVIS imaging (fold change in total photon flux) and shown at 6, 12, 18, and 24 weeks post-xenograft. Data were replicated in five independent cohorts (litters) of mice xenografted with different cell preparations on different days and the data from these five biological replicates are shown combined with each cohort color-coded (i.e. littermates are shown in the same color). **P < 0.01, ****P < 0.0001, two-sided Mann-Whitney test. Data are shown as mean +/− s.e.m.
Extended Data Figure 2. Neuroligin-3 is the only neuroligin family member that promotes glioma proliferation.
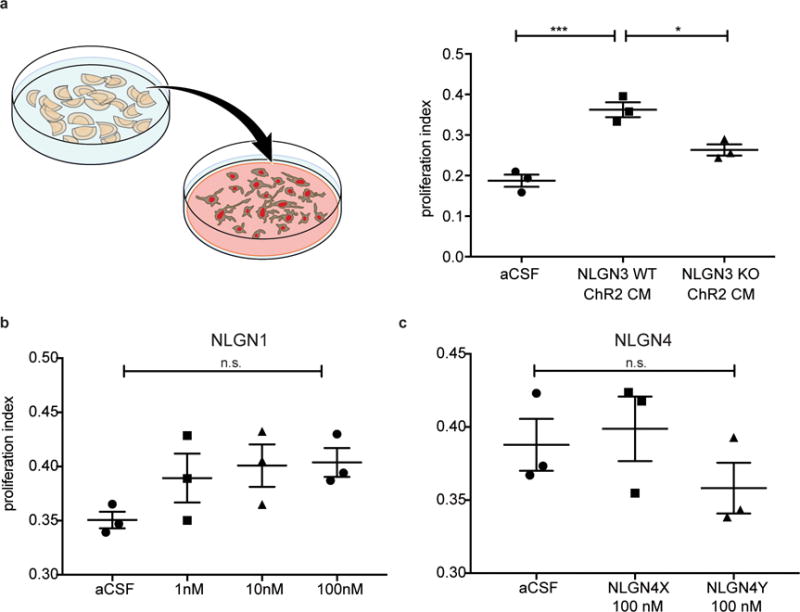
a, Schematic representation of active conditioned medium generation (left). Proliferation index (EdU+ and DAPI co-positive nuclei/total DAPI+ nuclei) of pHGG cells (SU-pcGBM2) exposed to plain medium (aCSF), optogenetically stimulated Nlgn3 WT cortical slice CM, or optogenetically stimulated Nlgn3 KO cortical slice CM (F = 30.8, P < 0.001). b-c, Proliferation index of patient-derived pediatric cortical glioblastoma (SU-pcGBM2) cells as measured by EdU incorporation 24 hrs after in vitro exposure to (b) recombinant human neuroligin-1 (NLGN1) at concentrations ranging from 0-100 nM or (c) recombinant human neuroligin-4X (NLGN4X) or neuroligin-4Y (NLGN4Y) at 100 nM. n=3 wells per condition. All data are presented as mean +/− s.e.m. n.s. = not significant (p > 0.05) by one-way ANOVA with Tukey’s post hoc test for multiple comparisons. *P < 0.05, ***P < 0.001.
Extended Data Figure 3. Gene expression changes induced by neuroligin-3 in glioma.
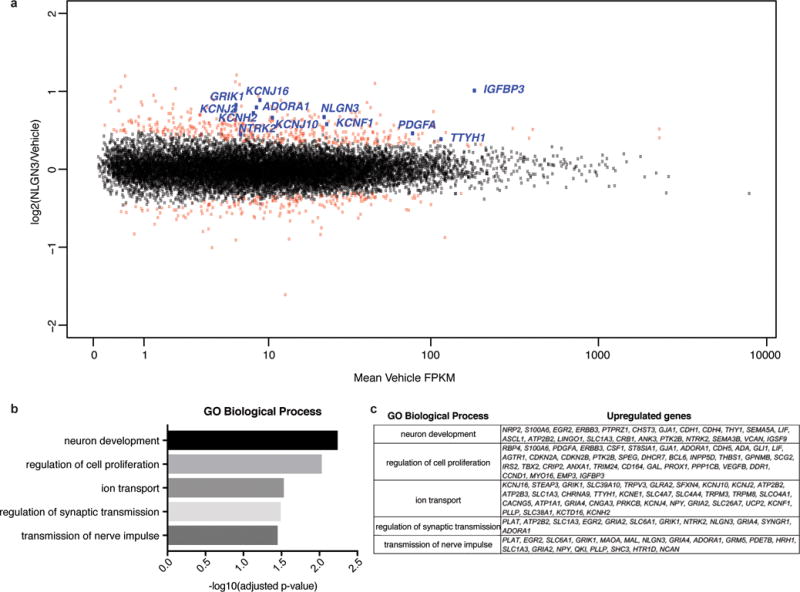
a, Scatterplot showing SU-pcGBM2 (n=2) gene expression changes following 16 hours of treatment with vehicle (~1% DMSO) or NLGN3 (100 nM). The x-axis shows mean FPKM value in vehicle treated cells and the y-axis shows log2(fold-change) of NLGN3 over vehicle. Points shown in red represent genes showing statistically significant change (adjusted p value < 0.1, Benjamini-Hochberg for multiple comparison testing). b, Gene Ontology Biological Processes enriched in significantly upregulated genes with NLGN3 treatment, as identified by DAVID with p values shown with Benjamini-Hochberg adjustment for multiple comparison testing. c, Genes associated with each GO BP term shown in (b).
Extended Data Figure 4. Neuroligin-3 expression data and efficiency of Cre driver mice.
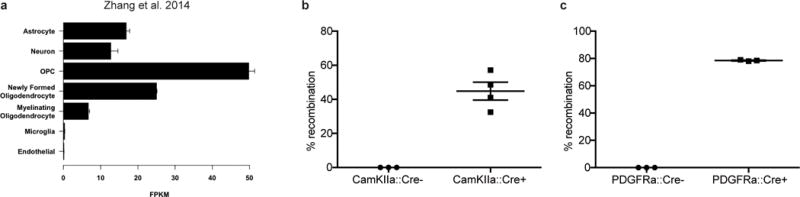
a, Nlgn3 RNA expression (FPKM values) in various cell types; (data from Brain-seq Barres dataset13) b-c, Recombination rate of inducible Cre driver models 7 days after treatment with tamoxifen (100mg/kg for 5 days) in Rosa26::tdTomatolox-stop-lox reporter mice. b, To assess the neuron-specific CamKIIa:CreER Cre driver, recombination efficiency was quantified as percent of NeuN+ neurons that co-express tdTomato+ in the cortex of either CamKIIa:CreER− or CamKIIa:CreER+ mice 7 days following completion of tamoxifen administration. c, To assess the OPC-specific Cre driver PDGFRa:CreER, recombination efficiency was quantified as number PDGFRα+ OPCs that co-express tdTomato in the cortex of either PDGFRa:CreER− or PDGFRa:CreER+ mice. n=3 mice per group.
Extended Data Figure 5. NLGN3 shedding from glioma cells is regulated by NLGN3 exposure and is mediated by ADAM10.
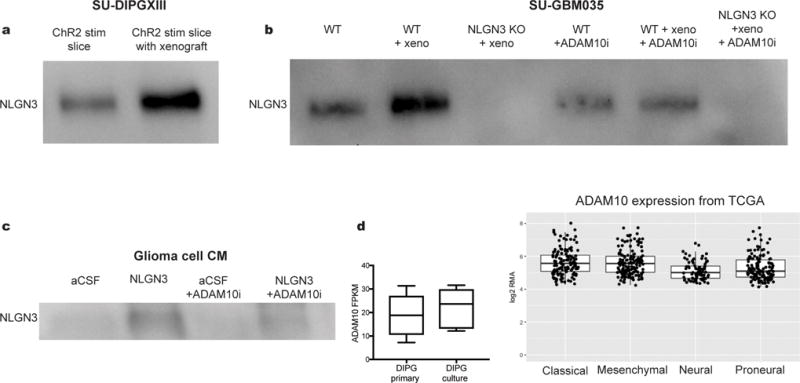
a, NLGN3 Western blot illustrating neuroligin-3 secreted into CM from optogenetically stimulated Thy1::ChR2; NSG cortical slices (ChR2 stim slice) or SU-DIPGXIII xenograft-bearing Thy1::ChR2; NSG cortical slices (ChR2 stim slice with xenograft). Performed in biological duplicate. b, NLGN3 western blot illustrating neuroligin-3 secreted into CM from wild type brain slices (WT), WT brain slices bearing xenografts of adult GBM SU-GBM035 (WT + xeno), or from Nlgn3 knockout brains bearing SU-GBM035 xenografts (Nlgn3 KO + xeno) in the absence (left 3 lanes) or presence (right 3 lanes) of 200 nM ADAM10 inhibitor GI254023X (+ADAM10i). Performed in biological triplicate. c, NLGN3 Western illustrating glioma cell secretion of NLGN3 in vitro at baseline medium conditions (aCSF), following exposure to recombinant NLGN3 with subsequent washing (NLGN3), at baseline medium conditions in the presence of ADAM10 inhibitor GI254023X (aCSF + ADAM10i) or following NLGN3 exposure in the presence of ADAM10 inhibitor (NLGN3+ADAM10i). Performed in biological triplicate. d, mRNA expression levels of ADAM10 in primary tumor and cultures of DIPG by RNA-seq with values reported as FPKM12,28 (left; n=8 primary samples, n=7 culture samples) and in 493 individual adult glioblastoma samples from TCGA29 (right). Values are reported as robust multi-array averages (RMA; right). Boxes show the median, 25th and 75th percentiles, error bars show the minima and maxima.
Extended Data Figure 6. Functional consequences for glioma of protease inhibition in situ and in vitro.
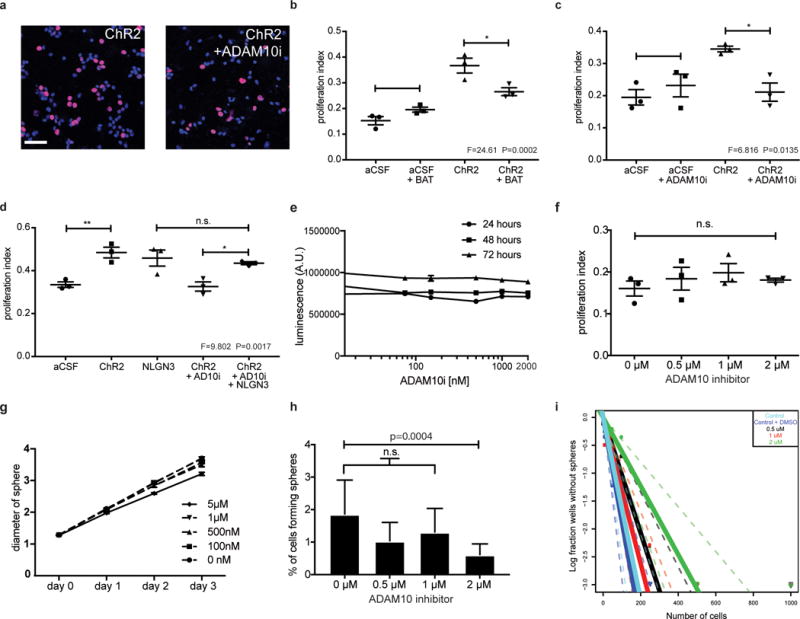
a, SU-pcGBM2 cells (EdU, red; DAPI, blue) exposed to CM +/− ADAM10 inhibitor; Scale bar=50μm. b-d, Proliferation indices of SU-pcGBM2 cells exposed to plain medium (aCSF) or active CM +/− (b) pan-MMP inhibitor (BAT) (c) ADAM10 inhibitor or (d) ADAM10 inhibitor +/− NLGN3 rescue. n=3 wells per condition. e, Cell viability of SU-pcGBM2 cells exposed to ADAM10 inhibitor (GI254023X, 10nM-2μM) at 24-, 48-, and 72-hours, (n=3 wells/condition) f, Proliferation index of SU-pcGBM2 cells exposed to GI254023X (0-2μM; (n=3 wells/condition). g, Spheroid invasion index of SU-DIPGVI cells exposed to ADAM10i (0-5μM) at 24-, 48- and 72-hours expressed as the diameter of the sphere of glioma cells relative to the initial diameter at time 0-hours. h, Neurosphere formation assay in SU-pcGBM2 cells in the presence of GI254023X (0-2μM; n=10 wells/condition. i, Extreme limiting dilution assay (ELDA) data presented in h re-plotted here as a log fraction plot with the slope of the solid line representing the log-active cell fraction and confidence intervals shown as dotted lines. SU-pcGBM2 cells treated with ADAM10 inhibitor GI254023X at 0.5μM (black), 1μM (red) or 2μM (green), with vehicle (DMSO) control (royal blue) or no DMSO (cyan) and analyzed for neurosphere formation at two weeks. For (b-d, f), P values as indicated; one-way ANOVA with Tukey’s post hoc test for multiple comparisons; data presented as mean +/− s.e.m. For (h), χ2 test; data presented as mean +/− confidence intervals.
Extended Data Figure 7. Glioma xenograft proliferation after ADAM10 inhibition and pharmacokinetics of XL-784.
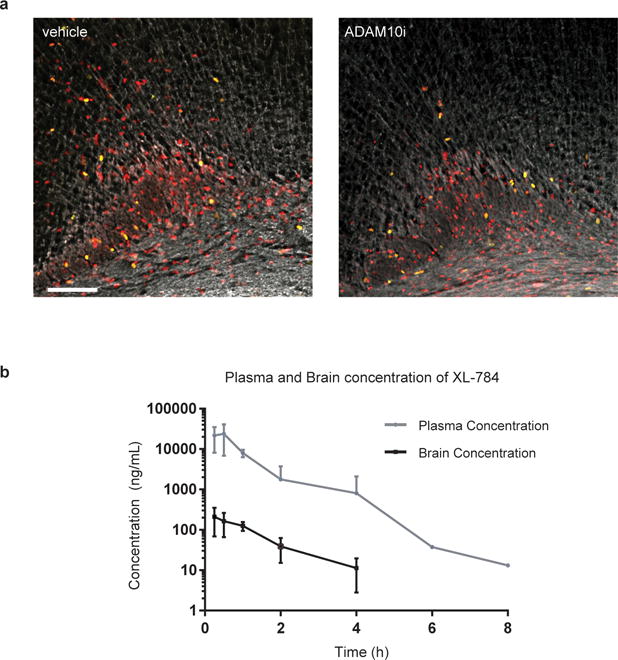
a, Representative confocal images (Ki67, green; human nuclear antigen, red; myelin basic protein, white) of vehicle-treated or ADAM10i-treated mice bearing frontal cortex SU-pcGBM2 xenografts; images similar to but lower magnification than those shown in Fig. 4e; n=4 vehicle, n=4 ADAM10i-treated mice. Scale bar=100μm. b, Brain tissue and plasma levels of XL-784 at various time points following a single 50 mg/kg i.p. dose in NSG mice as assessed by liquid chromatography/tandem mass spectrometry (LC-MS/MS). n=3 mice at each data point. Data are shown as mean +/− st.dev.
Extended Data Figure 8. Lack of detectable neurotoxicity following treatment with INCB7839.
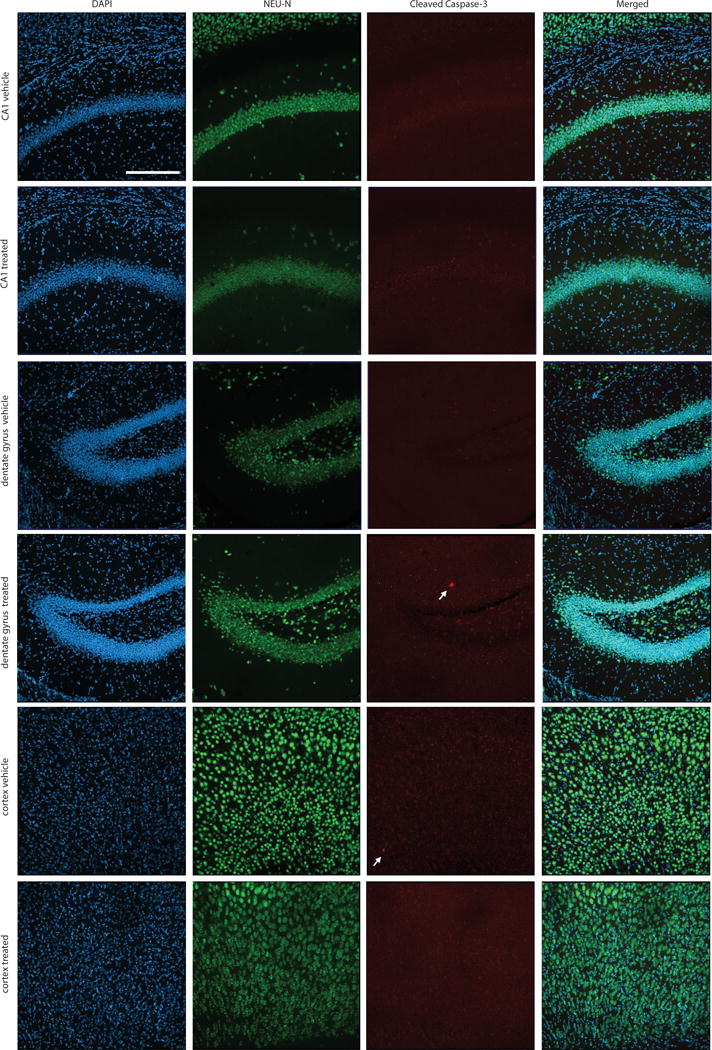
Histological assessment of neuronal integrity was performed in mice treated with INCB7839 or vehicle control. The cortex, CA1 region of the hippocampus and dentate gyrus of the hippocampus were examined immunohistologically in the hemisphere contralateral to glioma xenografts in mice treated with INCB7839 or vehicle control. Brain sections were immunostained with NeuN (green) to mark neuronal nuclei and cleaved caspase-3 (red) to mark apoptotic cells and counterstained with DAPI (Blue). Representative sections from n=4 INCB7839-treated mice and n=4 vehicle control mice were examined. Neuronal nuclei appeared morphologically normal and non-pyknotic. Extremely few cleaved caspase-3+ cells were identified in either group; a total of one cleaved caspase-3+ cell was found in each group across all mice examined (white arrows). Scale bar = 200 μm.
Extended Data Table 1.
Phospho-antibody array analysis in glioma cells following neuroligin-3 exposure.
| 5 minute phosphorylation | ratio of fold change |
|---|---|
| LYN | 2.72 |
| PLCG2 | 2.21 |
| FGFR1 | 1.97 |
| SHC1 | 1.88 |
| SYK | 1.88 |
| NFKB1 | 1.86 |
| TP53 | 1.79 |
| DOK1 | 1.79 |
| AURKA | 1.78 |
| EGFR | 1.76 |
| RAF1 | 1.67 |
| RPS6KB1 | 1.58 |
| PAK2 | 1.55 |
| PTK2B | 1.53 |
| MET | 1.52 |
| JUN | 1.52 |
| VEGFR2 | 1.51 |
| PLD1 | 1.47 |
| GAB2 | 1.47 |
| TNK2 | 1.47 |
| CCNE1 | 1.41 |
| ITGB3 | 1.39 |
| LCK | 1.37 |
| BCAR1 | 1.35 |
| PXN | 1.31 |
| 30 minute phosphorylation | ratio of fold change |
| NFKB1 | 4.13 |
| CCND1 | 3.87 |
| FLT3 | 3.37 |
| FAK2 | 2.13 |
| MEK1 | 2.06 |
| JUN | 1.91 |
| EFNB1/B2/B3 | 1.87 |
| CDK1 | 1.80 |
| PLD2 | 1.65 |
| PTPN11 | 1.62 |
| CDH5 | 1.56 |
| ELK1 | 1.52 |
| GSK3A | 1.49 |
| PAK1 | 1.45 |
| ETK | 1.44 |
| ITGB3 | 1.36 |
| CRK | 1.30 |
| TP53 | 1.30 |
| PXN | 1.29 |
| MTOR | 1.28 |
Phosphorylation ratio of NLGN3-exposed vs. control SU-pcGBM2 cell lysates after 5-minute or 30-minute exposure to NLGN3 as assessed by phospho-antibody array.
Extended Data Table 2.
Brain penetration of ADAM10 inhibitor GI254023X.
| Tissue | ADAM10 inhibitor(GI254023X) levels |
|---|---|
| Serum | 38 μg/ml (97 μM) |
| Kidney | 106 μg/ml (270 μM) |
| Cerebral cortex | 1.6 μg/ml (4 μM) |
| Pons | 887 ng/ml (2.2 μM) |
A single 100 mg/kg dose was delivered intra-peritoneally in NSG mice (n=3), and tissue samples collected 30-minutes later for analysis using liquid chromatography/tandem mass spectrometry (LC-MS/MS). Brain tissue concentrations show reasonable penetration across the blood brain barrier, achieving 2-4 μM concentration of drug at this time point.
Supplementary Material
Acknowledgments
The authors gratefully acknowledge support from the V Foundation, Liwei Wang Research Fund, National Institutes of Health (NINDS R01NS092597; NCI 1F31CA200273, P50 CA168504, P50 CA165962, R35 CA210057), Department of Defense (W81XWH-151-0131), McKenna Claire Foundation, Alex’s Lemonade Stand Foundation, The Cure Starts Now Foundation and DIPG Collaborative, Lyla Nsouli Foundation, Unravel Pediatric Cancer, California Institute for Regenerative Medicine (RN3-06510), Childhood Brain Tumor Foundation, Matthew Larson Foundation, the Joey Fabus Childhood Cancer Foundation, the Wayland Villars DIPG Foundation, the Connor Johnson, Zoey Ganesh, and Declan Gloster Memorial Funds, N8 Foundation, Virginia and D.K. Ludwig Fund for Cancer Research, Child Health Research Institute at Stanford Anne T. and Robert M. Bass Endowed Faculty Scholarship in Pediatric Cancer and Blood Diseases, and Breast Cancer Research Foundation and the intramural programs of the National Center for Advancing Translational Sciences and the National Cancer Institute.
Footnotes
Author Contributions: H.S.V., L.T.T., P.J.W, S.G., J.L, D.Y.D., P.J.M. conducted experiments. H.S.V. and M.M. designed the experiments. H.S.V, S.N., S.G., J.L., C.J.T. and M.M. analyzed the data. J.N and J.J.Z. developed the breast cancer brain metastasis xenograft model. All authors contributed to manuscript editing. H.S.V. and M.M. wrote the manuscript. M.M. supervised all aspects of the work.
The authors declare competing financial interests: M.M. and H.S.V. declare that Stanford University filed a patent application (15/011260) related to this work.
Materials Availability: All glioma cultures are freely available and can be obtained by contacting the corresponding author and with a standard materials transfer agreement.
Data Availability: RNA-seq data are deposited in GEO, accession number GSE99045. The source data for the main figures and all Western blots are included in the supplementary information for this paper.
References
- 1.Venkatesh HS, et al. Neuronal Activity Promotes Glioma Growth through Neuroligin-3 Secretion. Cell. 2015;161:803–16. doi: 10.1016/j.cell.2015.04.012. [DOI] [PMC free article] [PubMed] [Google Scholar]
- 2.Varoqueaux F, et al. Neuroligins determine synapse maturation and function. Neuron. 2006;51:741–54. doi: 10.1016/j.neuron.2006.09.003. [DOI] [PubMed] [Google Scholar]
- 3.Radyushkin K, et al. Neuroligin-3-deficient mice: model of a monogenic heritable form of autism with an olfactory deficit. Genes, Brain Behav. 2009;8:416–425. doi: 10.1111/j.1601-183X.2009.00487.x. [DOI] [PubMed] [Google Scholar]
- 4.Tabuchi K, et al. A neuroligin-3 mutation implicated in autism increases inhibitory synaptic transmission in mice. Science. 2007;318:71–6. doi: 10.1126/science.1146221. [DOI] [PMC free article] [PubMed] [Google Scholar]
- 5.Etherton M, et al. Autism-linked neuroligin-3 R451C mutation differentially alters hippocampal and cortical synaptic function. Proc Natl Acad Sci. 2011;108:13764–13769. doi: 10.1073/pnas.1111093108. [DOI] [PMC free article] [PubMed] [Google Scholar]
- 6.Blundell J, et al. Neuroligin-1 Deletion Results in Impaired Spatial Memory and Increased Repetitive Behavior. J Neurosci. 2010;30 doi: 10.1523/JNEUROSCI.4517-09.2010. [DOI] [PMC free article] [PubMed] [Google Scholar]
- 7.Ni J, et al. Combination inhibition of PI3K and mTORC1 yields durable remissions in mice bearing orthotopic patient-derived xenografts of HER2-positive breast cancer brain metastases. Nat Med. 2016;22:723–726. doi: 10.1038/nm.4120. [DOI] [PMC free article] [PubMed] [Google Scholar]
- 8.Ozawa T, et al. Most human non-GCIMP glioblastoma subtypes evolve from a common proneural-like precursor glioma. Cancer Cell. 2014;26:288–300. doi: 10.1016/j.ccr.2014.06.005. [DOI] [PMC free article] [PubMed] [Google Scholar]
- 9.Martinho O, et al. Expression, mutation and copy number analysis of platelet-derived growth factor receptor A (PDGFRA) and its ligand PDGFA in gliomas. Br J Cancer. 2009;101:973–82. doi: 10.1038/sj.bjc.6605225. [DOI] [PMC free article] [PubMed] [Google Scholar]
- 10.Sakakini N, et al. A Positive Feed-forward Loop Associating EGR1 and PDGFA Promotes Proliferation and Self-renewal in Glioblastoma Stem Cells. J Biol Chem. 2016;291:10684–99. doi: 10.1074/jbc.M116.720698. [DOI] [PMC free article] [PubMed] [Google Scholar]
- 11.Jung E, et al. Tweety-Homolog 1 Drives Brain Colonization of Gliomas. J Neurosci. 2017;37 doi: 10.1523/JNEUROSCI.3532-16.2017. [DOI] [PMC free article] [PubMed] [Google Scholar]
- 12.Nagaraja S, et al. Transcriptional Dependencies in Diffuse Intrinsic Pontine Glioma. Cancer Cell. 2017;31:635–652.e6. doi: 10.1016/j.ccell.2017.03.011. [DOI] [PMC free article] [PubMed] [Google Scholar]
- 13.Zhang Y, et al. An RNA-Sequencing Transcriptome and Splicing Database of Glia, Neurons, and Vascular Cells of the Cerebral Cortex. J Neurosci. 2014;34:11929–47. doi: 10.1523/JNEUROSCI.1860-14.2014. [DOI] [PMC free article] [PubMed] [Google Scholar]
- 14.Bergles DE, Roberts JD, Somogyi P, Jahr CE. Glutamatergic synapses on oligodendrocyte precursor cells in the hippocampus. Nature. 2000;405:187–91. doi: 10.1038/35012083. [DOI] [PubMed] [Google Scholar]
- 15.Lin S, Bergles DE. Synaptic signaling between GABAergic interneurons and oligodendrocyte precursor cells in the hippocampus. Nat Neurosci. 2004;7:24–32. doi: 10.1038/nn1162. [DOI] [PubMed] [Google Scholar]
- 16.Ziskin JL, Nishiyama A, Rubio M, Fukaya M, Bergles DE. Vesicular release of glutamate from unmyelinated axons in white matter. Nat Neurosci. 2007;10:321–30. doi: 10.1038/nn1854. [DOI] [PMC free article] [PubMed] [Google Scholar]
- 17.Suzuki K, et al. Activity-Dependent Proteolytic Cleavage of Neuroligin-1. Neuron. 2012;76:410–422. doi: 10.1016/j.neuron.2012.10.003. [DOI] [PubMed] [Google Scholar]
- 18.Peixoto RT, et al. Transsynaptic Signaling by Activity-Dependent Cleavage of Neuroligin-1. Neuron. 2012;76:396–409. doi: 10.1016/j.neuron.2012.07.006. [DOI] [PMC free article] [PubMed] [Google Scholar]
- 19.Kuhn PH, et al. Systematic substrate identification indicates a central role for the metalloprotease ADAM10 in axon targeting and synapse function. Elife. 2016;5:1174–1189. doi: 10.7554/eLife.12748. [DOI] [PMC free article] [PubMed] [Google Scholar]
- 20.Lundgren JL, et al. ADAM10 and BACE1 are localized to synaptic vesicles. J Neurochem. 2015;135:606–615. doi: 10.1111/jnc.13287. [DOI] [PubMed] [Google Scholar]
- 21.Qu M, Qiu BO, Xiong W, Chen D, Wu A. Expression of a-disintegrin and metalloproteinase 10 correlates with grade of malignancy in human glioma. Oncol Lett. 2015;9:2157–2162. doi: 10.3892/ol.2015.2993. [DOI] [PMC free article] [PubMed] [Google Scholar]
- 22.Bulstrode H, et al. A-Disintegrin and Metalloprotease (ADAM) 10 and 17 promote self-renewal of brain tumor sphere forming cells. Cancer Lett. 2012;326:79–87. doi: 10.1016/j.canlet.2012.07.022. [DOI] [PubMed] [Google Scholar]
- 23.Siney EJ, et al. Metalloproteinases ADAM10 and ADAM17 Mediate Migration and Differentiation in Glioblastoma Sphere-Forming Cells. Mol Neurobiol. 2016 doi: 10.1007/s12035-016-0053-6. [DOI] [PMC free article] [PubMed] [Google Scholar]
- 24.Kohutek ZA, diPierro CG, Redpath GT, Hussaini IM. ADAM-10-mediated N-cadherin cleavage is protein kinase C-alpha dependent and promotes glioblastoma cell migration. J Neurosci. 2009;29:4605–15. doi: 10.1523/JNEUROSCI.5126-08.2009. [DOI] [PMC free article] [PubMed] [Google Scholar]
- 25.Infante J, Burris HA, L N, et al. A multicenter phase Ib study of the safety, pharmacokinetics, biological activity and clinical efficacy of INCB7839, a potent and selective inhibitor of ADAM10 and ADAM17. Breast Cancer Res Treat. 2007;106(Supp 1):S269. [Google Scholar]
- 26.Friedman S, et al. Clinical Benefit of INCB7839, a Potent and Selective Inhibitor of ADAM10 and ADAM17, in Combination with Trastuzumab in Metastatic HER2 Positive Breast Cancer Patients. Cancer Res. 2014;69 [Google Scholar]
- 27.Postina R, et al. A disintegrin-metalloproteinase prevents amyloid plaque formation and hippocampal defects in an Alzheimer disease mouse model. J Clin Invest. 2004;113:1456–64. doi: 10.1172/JCI20864. [DOI] [PMC free article] [PubMed] [Google Scholar]
- 28.Grasso CS, et al. Functionally defined therapeutic targets in diffuse intrinsic pontine glioma. Nat Med. 2015;21:827. doi: 10.1038/nm0715-827a. [DOI] [PubMed] [Google Scholar]
- 29.Verhaak RGW, et al. Integrated genomic analysis identifies clinically relevant subtypes of glioblastoma characterized by abnormalities in PDGFRA, IDH1, EGFR, and NF1. Cancer Cell. 2010;17:98–110. doi: 10.1016/j.ccr.2009.12.020. [DOI] [PMC free article] [PubMed] [Google Scholar]
- 30.Hu Y, Smyth GK. ELDA: extreme limiting dilution analysis for comparing depleted and enriched populations in stem cell and other assays. J Immunol Methods. 2009;347:70–8. doi: 10.1016/j.jim.2009.06.008. [DOI] [PubMed] [Google Scholar]
- 31.Rush J, et al. Immunoaffinity profiling of tyrosine phosphorylation in cancer cells. Nat Biotechnol. 2005;23:94–101. doi: 10.1038/nbt1046. [DOI] [PubMed] [Google Scholar]
- 32.Stokes M, et al. Complementary PTM Profiling of Drug Response in Human Gastric Carcinoma by Immunoaffinity and IMAC Methods with Total Proteome Analysis. Proteomes. 2015;3:160–183. doi: 10.3390/proteomes3030160. [DOI] [PMC free article] [PubMed] [Google Scholar]
- 33.Stokes MP, et al. PTMScan Direct: Identification and Quantification of Peptides from Critical Signaling Proteins by Immunoaffinity Enrichment Coupled with LC-MS/MS. Mol Cell Proteomics. 2012;11:187–201. doi: 10.1074/mcp.M111.015883. [DOI] [PMC free article] [PubMed] [Google Scholar]
- 34.Olsen JV, et al. Parts per Million Mass Accuracy on an Orbitrap Mass Spectrometer via Lock Mass Injection into a C-trap. Mol Cell Proteomics. 2005;4:2010–2021. doi: 10.1074/mcp.T500030-MCP200. [DOI] [PubMed] [Google Scholar]
- 35.Eng JK, McCormack AL, Yates JR. An approach to correlate tandem mass spectral data of peptides with amino acid sequences in a protein database. J Am Soc Mass Spectrom. 1994;5:976–989. doi: 10.1016/1044-0305(94)80016-2. [DOI] [PubMed] [Google Scholar]
- 36.Huttlin EL, et al. A Tissue-Specific Atlas of Mouse Protein Phosphorylation and Expression. Cell. 2010;143:1174–1189. doi: 10.1016/j.cell.2010.12.001. [DOI] [PMC free article] [PubMed] [Google Scholar]
- 37.Villén J, Beausoleil SA, Gerber SA, Gygi SP. Large-scale phosphorylation analysis of mouse liver. Proc Natl Acad Sci U S A. 2007;104:1488–93. doi: 10.1073/pnas.0609836104. [DOI] [PMC free article] [PubMed] [Google Scholar]
- 38.Kim D, et al. TopHat2: accurate alignment of transcriptomes in the presence of insertions, deletions and gene fusions. Genome Biol. 2013;14:R36. doi: 10.1186/gb-2013-14-4-r36. [DOI] [PMC free article] [PubMed] [Google Scholar]
- 39.Liao Y, Smyth GK, Shi W. featureCounts: an efficient general purpose program for assigning sequence reads to genomic features. Bioinformatics. 2014;30:923–30. doi: 10.1093/bioinformatics/btt656. [DOI] [PubMed] [Google Scholar]
- 40.Love MI, Huber W, Anders S. Moderated estimation of fold change and dispersion for RNA-seq data with DESeq2. Genome Biol. 2014;15:550. doi: 10.1186/s13059-014-0550-8. [DOI] [PMC free article] [PubMed] [Google Scholar]
- 41.Huang DW, Sherman BT, Lempicki RA. Systematic and integrative analysis of large gene lists using DAVID bioinformatics resources. Nat Protoc. 2009;4:44–57. doi: 10.1038/nprot.2008.211. [DOI] [PubMed] [Google Scholar]
- 42.Huang DW, Sherman BT, Lempicki RA. Bioinformatics enrichment tools: paths toward the comprehensive functional analysis of large gene lists. Nucleic Acids Res. 2009;37:1–13. doi: 10.1093/nar/gkn923. [DOI] [PMC free article] [PubMed] [Google Scholar]
Associated Data
This section collects any data citations, data availability statements, or supplementary materials included in this article.