

Abstract
Background
The Integrated Disease Surveillance and Response (IDSR) strategy was introduced in Madagascar in 2007. Information was collected by Healthcare structures (HS) on paper forms and transferred to the central level by post or email. Completeness of data reporting was around 20% in 2009–10. From 2011, in two southern regions data were transmitted through short messages service using one telephone provider. We evaluated the system in 2014–15 to determine its performance before changing or expanding it.
Methods
We randomly selected 80 HS and interviewed their representatives face-to-face (42) or by telephone (38). We evaluated knowledge of surveillance activities and selected case definitions, number of SMS with erroneous or missing information among the last ten transferred SMS, proportion of weekly reports received in the last 4 weeks and of the last four health alerts notified within 48 h, as well as mobile phone network coverage.
Results
Sixty-four percent of 80 interviewed HS representatives didn’t know their terms of reference, 83% were familiar with the malaria case definition and 32% with that of dengue. Ninety percent (37/41) of visited HS had five or more errors and 47% had missing data in the last ten SMS they transferred. The average time needed for weekly IDSR data compilation was 24 min in the Southern and 47 in the South-eastern region. Of 320 expected SMS 232 (73%) were received, 136 (43%) of them in time. Out of 38 alerts detected, four were notified on time. Nine percent (7/80) of HS had no telephone network with the current provider.
Conclusions
SMS transfer has improved IDSR data completeness, but timeliness and data quality remain a problem. Healthcare staff needs training on guidelines and case definitions. From 2016, data are collected and managed electronically to reduce errors and improve the system’s performance.
Keywords: Integrated disease surveillance and response IDSR, Madagascar, Basic healthcare, Infectious diseases, Surveillance
Background
Early detection of epidemics, but also population health status ascertainment and Public Health decision-making oftentimes depend on effective disease surveillance systems [1, 2].
The Integrated Disease Surveillance and Response (IDSR) approach was proposed to countries in the African region by the Regional Office for Africa of the World Health Organization (WHO AFRO) in 1998. Its purpose is to establish one national communicable disease surveillance system integrating different surveillance activities into one, consisting of functions using the same or similar structures, processes and personnel. The goal is an effective communicable disease control based on functioning effective disease surveillance and response systems. Since then, many countries in Africa have adapted and adopted it with some including non-communicable diseases as well [3, 4].
The International Health Regulations (IHR) constitute an agreement by WHO member states to (implement measures limiting the spread of health risks, including requirements concerning surveillance and response activities [5]. IDSR systems can help achieve and sustain countries’ IHR obligations, as priorities like timely detection and response to Public Health (PH) events are shared between the two [6].
In Madagascar, the IDSR strategy was adapted to the national context with help of the WHO and introduced in 2007. Healthcare Structures (HS) collected information on paper forms and transferred it to the central level by post or email. The mean national completeness of data reporting in 2011–13 was 20%. The system was non-representative and not responding to its objectives (source: Direction de Veille Sanitaire et Surveillance Epidémiologique, DVSSE, 2010).
The south and southeast of Madagascar consists of five regions with 18 districts that are vulnerable to epidemic threats through their regular and alternating droughts and inondations leading to nutrition crises, locusts plagues, and a general unfavourable socio-economic context (Fig. 1: Madagascar’s 18 south and southeast districts targeted by the reinforced IDSR strategy, 2013, source: DVSSE).
Fig. 1.
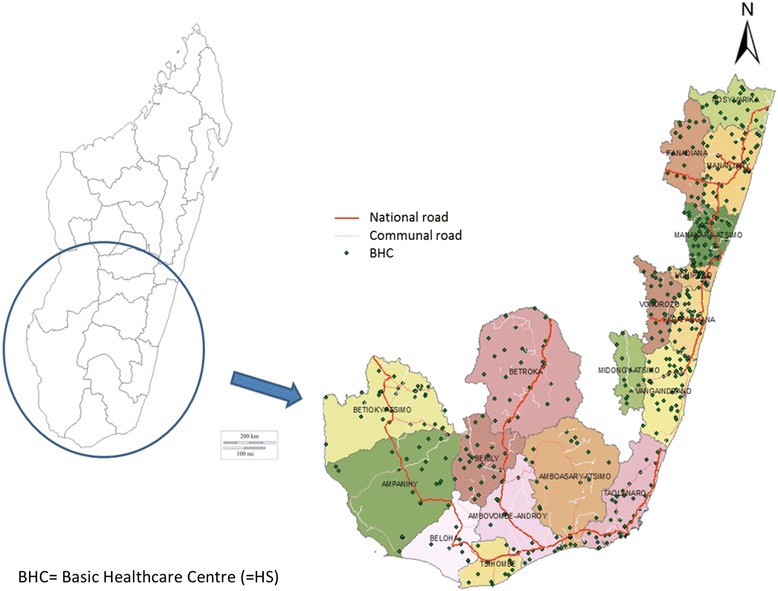
Madagascar’s 18 south and southeast districts targeted by the reinforced IDSR strategy, 2013. Direction de Veille Sanitaire et Surveillance Epidémiologique, Madagascar. Map of Madagascar and its southern regions and districts pointing out the main road network and HS locations
From 2011, the Central Emergency Response Fund (CERF) and WHO, in collaboration with the Ministry of Health through the Direction de Veille Sanitaire et Surveillance Epidémiologique (DVSSE) started reinforcing the IDSR strategy in the three regions in the south. Of their 238 HS, 152 (64%) were covered by the selected mobile phone network provider Airtel. From these, data were transferred through short message service (SMS) using the Airtel network. HS without mobile network coverage continued following the same procedures as the other regions of Madagascar. Within its goal of capacity reinforcement and fight against epidemics, the “Health watch” (Veille Sanitaire) project of the Indian Ocean Commission (IOC) has ensured continuation of this reinforced IDSR in the south. In 2013, data transfer by SMS was also introduced in the two regions in the southeast. Here, out of the 258 HS, 142 (55%) had access to the Airtel mobile phone network and were included.
A summary of the IDSR approach reinforced through SMS data transfer in the south and southeast of Madagascar is provided in Appendix 1.
Before extending or adjusting the SMS data transmission reinforced IDSR strategy in southern Madagascar, we evaluated the system to determine its performance and potential ways of improvement.
Our specific objectives were to evaluate its performance using the attributes simplicity, data quality, completeness and timeliness, and to evaluate the technological aspects, including mobile phone network coverage and quality, capacity of healthcare staff to handle the mobile phones, and proportion of mobile phone losses and breakdowns.
Methods
We adapted evaluation guidelines published by WHO, the Morbidity and Mortality Weekly Report (MMWR) and from United States Centers for Disease Control and Prevention (CDC) to our context [7–9].
Indicators to be collected and definitions
For each of our attributes to be evaluated (simplicity, data quality, completeness and timeliness, and the technological assessment) we defined an indicator to be measured, as described in Table 1 (IDSR evaluation attributes and indicators, south and southeast of Madagascar, 2014–15). We also defined points of action that could be undertaken depending on the evaluation results (not shown).
Table 1.
IDSR evaluation attributes and indicators, south and southeast of Madagascar, 2014–15
| Attribute/ topic | Indicators | Numerator/ denominator |
|---|---|---|
| Simplicity | ||
| Ease of understanding | Presence of Terms of Reference (TOR) in the HS | Number of HS agents possessing a (SIMR) TOR document/ Number of interviewed HS agents |
| Proportion of HS agents capable of describing the activities linked to the surveillance (according to TOR) | Number of HS agents who could describe the activities linked to the surveillance/ Number of interviewed HS agents | |
| Ease of execution | Proportion of HS agents who | |
| • Master selected case definitions (acute respiratory infection (ARI), diarrhoea, malaria, dengue-like syndrome (DLS), and measles) | • Number of HS agents who correctly cited all case definition aspects/ Number of interviewed HS agents | |
| • Presence of case definitions guidelines in the HS | • Number of HS agents possessing hardcopy case definitions/ Number of interviewed HS agents | |
| Distribution of data collection mode and kind of tools used | Number per mode or tool/ Number of modes or kind of tools used | |
| Time of data collection | Median and range of minutes needed each week | |
| Time of SMS editing | Median and range of minutes needed to write one SMS | |
| Data quality | ||
| Missing data | Number and proportion of SMS with ≥1 missing observation among the ten last SMS sent for frequent diseases (see under definitions below)/ syndrome | Number of SMS with ≥1 missing observation/ 10 last SMS sent |
| Proportion of SMS with ≥1 missing observation among the ten last SMS sent for rare diseases (see under definitions below)/ syndrome | Number of SMS with ≥1 missing observation/ 10 last SMS sent | |
| Erroneous data | Comparison of consultation register and sent SMS archived on the HS’s mobile phone, when this was not possible (no SMS archive), data from the consultation register was compared to the databases at district or central level | |
| Proportion of erroneous observations among 10 last SMS sent | Number of erroneous observations/ Number of observations sent | |
| Number of erroneous observations within the 10 last SMS sent | Median and range of erroneous observations | |
| Number of supervision visits in 2014 | Median and range of supervision visits in 2014 | |
| Completeness & Timeliness | ||
| Routine completeness | Proportion of SMS reports received over last 4 weeks | Number of SMS received/ Number of SMS expected |
| Distribution of reasons for not sending SMS reports | Number of HS agents invoking each reason/ Number of reasons (for not sending SMS) quoted | |
| Routine timeliness | Proportion of routine SMS received in time (see under definitions below) for the last 4 weeks | Number of SMS in time per week/ Number of expected SMS |
| Distribution of reasons for not sending the SMS in time over last 4 weeks | Number of HS agents invoking each reason/ Number of quoted reasons | |
| Alert notifications | Number of HS that notified alerts | |
| Number of alerts notified by HS in 2014 | ||
| Type of notified alerts | ||
| Proportion of alert notifications received in time (see under definitions below) for the last 4 alerts | Number of alerts received in time / Number of alerts received | |
| Technological evaluation | ||
| Geographical mobile phone network coverage and coverage at/around HS with the three available providers | Verification during HS visits or during telephone interview | |
| Sources of mobile phones used for data transfer | Number of HS by phone source/ Number all HS mobile phones | |
| Mobile phone changes/ replacements since arrival on job | Number of mobile phone changes/ replacements | |
| Mobile phone handling capacity by HS agents (following demonstration by evaluation team) | Number of HS agents by capacity/ Number of all interviewed HS agents | |
| Energy sources, availability and capacity | Evaluation by the evaluators in the field during HS visits | |
| Last problem experienced with mobile phone charging | Interview with the HS director | |
| Number of HS by time of last problem/ Number all HS | ||
Definitions
Missing observations = HS failing to report disease, syndrome or event data, which in the frame of a “zero reporting” (i.e. reporting even if zero cases) system should not happen
Erroneous observations = observation transferred by SMS that did not correspond to those in the consultation register
Outliers/ outlying observations = incoherent observations identified through exploration of each variables, extreme observations were verified
Completeness = Number of received weekly SMS/ Number of weekly SMS expected
Timeliness = Number of reports received within 48 h after the week in question/ Number of expected surveillance reports
Frequent disease/syndromes examples = selected diseases/syndromes, notably diarrhoea, Acute respiratory infections (ARI), malaria, Dengue like syndrome (DLS)
Rare diseases/syndromes = selected diseases/syndromes of those for which one case is defined as an epidemic, notably measles, Acute Flaccid Paralysis (AFP), plague
The study period differed depending on the attribute and indicators evaluated but all lay within 2014. Simplicity and technological indicators were evaluated at time of visit through observation or interview. To assess data quality we considered the last ten sent SMS, for supervision visits and alerts by HS the evaluation period concerned the year 2014, while for routine and alert notification completeness and timeliness we looked at the 4 weeks or four alerts preceding our evaluation interviews respectively.
Levels included in the evaluation and healthcare structure selection
Each of the 18 districts in the south and southeast of Madagascar has a District Health Office (DHO). Two-hundred-and-ninety-four HS participate in the reinforced IDSR system; they are divided into three types:
BHC 1: paramedical staff covering a population of 5000–9000 inhabitants
BHC 2: usually general practitioners and paramedical staff covering > 9000 inhabitants
Primary Care Reference Centre (PCRC, district level)
We stratified all HS according to the possibility or not to visit them in person (parts of Madagascar are considered “red zones” that cannot be visited for security reasons). Then we stratified the 184 accessible HS according to type (BHC1/2, PCRC), and selected a random sample of 23% of the HS in each stratum, resulting in 42 HS to be visited in person (Appendix 2).
We also selected a random sample of 38 of the 110 inaccessible HS for telephone interviews.
Data collection
Our evaluation had three components, [1] the description of the surveillance system (not presented here, but summarized in Appendix 1), [2] the evaluation of its attributes, and [3] a technological assessment. We performed field visits to a selection of HS and conducted telephone interviews with a second selection.
We trained three teams including epidemiologists and a person responsible for the technology assessment) on all aspects of the evaluation. We used two questionnaires created with Wepi (www.wepi.org) that were tested and revised before being administered during the evaluation: one for HS and one for the technological assessment. In the HS, the teams interviewed the head of the HS or the agent responsible for the IDSR activities.
The telephone interviews, using the same questionnaires, took place after the teams’ return from the field. Information that needed in visu verification (for example comparison of consultation register and sent SMS, and most of the technology evaluation) could not be collected for the HS interviewed by phone. For the HS visited in person that did not have a sent SMS archive on their phone, we compared data from the consultation register with that of the IDSR databases at district level.
Data analysis
We verified the data collected through the questionnaires checking each individual variable for coherence, missing observations and potential mistakes, before calculating the indicators for each of the surveillance attributes. We also compared the indicator results for the different types of HS that were included in the evaluation, for example urban vs. rural, background/training of HS agent, type of HS (BHC1, BHC2, PCRC), by district, region, accessibility with the Chi-square test for homogeneity.
Results
Description of visited and interviewed HS
We visited 42 HS between 26 November and 12 December 2014. In January and February 2015, we interviewed 38 HS by telephone. Of the 80 included HS, 61 were BHC1 (out of all 245 BHC1, 25%), 14 BHC2 (out of all 49, 29%), and 5 PCRC (out of all 18, 28%) (Table 2).
Table 2.
Included HS by type, Madagascar, 2014–15
| Type of HS | Total HS | Number included HS | Proportion (%) |
|---|---|---|---|
| Centre de Santé de Base niveau 2 (BHC 2) | 245 | 61 | 25 |
| Centre de Santé de Base niveau 1 (BHC 1) | 49 | 14 | 29 |
| Centre Hospitalier du District (PCRC) | 18 | 5 | 28 |
| Total | 312 | 80 | 26 |
The majority of the 80 interviewed agents were paramedical staff (66%), the rest were medical doctors (34%); this was similar for both (south and southeast) regions. The time they had been in their position at time of the interview ranged between two days and nine years, with a median of one year. Sixty five percent (53/80) had previously received a surveillance training course, 20 (24%) had on-the-job-training, and nine (11%) were instructed by their predecessor (two had a combination of these). Fifty-three agents (79%) had received the last training within the previous two years.
Attributes evaluation: Simplicity, data quality, completeness and timeliness
All results relating to the evaluated surveillance attributes are summarized in Table 3 (Indicator results by reinforced IDSR evaluation attribute, Madagascar, 2014–15).
Table 3.
Indicator results by reinforced IDSR evaluation attribute, Madagascar, 2014–15
| Indicators per attribute | Denominator | Number | Proportion (%) |
|---|---|---|---|
| Simplicity | |||
| TOR presence | 80 | 15 | 19 |
| TOR knowledge, description of surveillance activities (Number of correct answers/ 5 questions) | |||
| 5/5 | 29 | 36 | |
| 4/5 | 26 | 33 | |
| 3/5 | 12 | 15 | |
| 2/5 | 10 | 13 | |
| 1/5 | 3 | 4 | |
| Knowledge of selected case definitions | |||
| Malaria | 66 | 83 | |
| Diarrhoea | 62 | 78 | |
| ARI | 37 | 46 | |
| Measles | 14 | 18 | |
| DLS | 13 | 16 | |
| Case definitions guidelines presence | 51 | 64 | |
| Data collection mode | |||
| Weekly | 60 | 75 | |
| End of each day | 16 | 20 | |
| Other | 4 | 5 | |
| Tools routinely used for data compilationa | |||
| Data form | 39 | 35 | |
| SMS register notebook | 13 | 12 | |
| Dashboard | 12 | 11 | |
| Other | 48 | 43 | |
| Time for data compilation (minutes), median (range) | 42 | 30 | (5–180) |
| Time for SMS writing (minutes), median (range) | 5 | (1–20) | |
| Data quality | |||
| Missing data | 80 | ||
| Number of last 10 SMS with ≥1 missing observation | |||
| Frequent diseases | |||
| > 4 | 5 | 6 | |
| 1–3 | 10 | 12 | |
| 0 | 38 | 47 | |
| No responseb | 27 | 34 | |
| Rare diseases | |||
| 10 | 12 | 15 | |
| 0 | 68 | 85 | |
| Erroneous data | |||
| Number of 10 last SMS with ≥1 erroneous observations | 42 | ||
| 0 | 2 | 5 | |
| 3–5 | 8 | 19 | |
| 6–8 | 16 | 38 | |
| 9–10 | 18 | 43 | |
| Number of erroneous observations, median (range) | 12 | (0–51) | |
| Number of supervisions in 2014, median (range) | 80 | 2 | (0–26) |
| Completeness & timeliness | |||
| Completeness of HS routine data transfer over last 4 weeks (SMS number) | 80 (320) | 58 (232) | 73 |
| Reasons for non-completeness | |||
| Monthly DHO meeting | 4 | 17 | |
| Training | 4 | 17 | |
| Illness | 3 | 13 | |
| Lost telephone or SIM card | 3 | 13 | |
| Telephone network problem | 2 | 9 | |
| No telephone credit | 2 | 9 | |
| No telephone network | 2 | 9 | |
| End of the year workload too high | 2 | 9 | |
| Newly recruited health agent | 1 | 4 | |
| Timeliness of routine SMS over 4 last weeks | |||
| 4/4 | 34 | 44 | |
| 3/4 | 11 | 14 | |
| 2/4 | 11 | 14 | |
| 1/4 | 6 | 8 | |
| 0/4 | 15 | 19 | |
| Reasons for non-timeliness over last 4 weeks | |||
| Workload too high | 9 | 24 | |
| Telephone network problem | 6 | 16 | |
| Training | 4 | 11 | |
| Illness | 4 | 11 | |
| No telephone credit | 4 | 10 | |
| Family problem, leave, or rest after on-call duty | 3 | 8 | |
| No telephone network | 2 | 5 | |
| No/ lost telephone | 2 | 5 | |
| Battery charging problem | 2 | 5 | |
| Monthly DHO meeting | 1 | 3 | |
| Newly recruited health agent | 1 | 3 | |
| Number of HS that notified alerts (79 alerts in total) over last 4 weeks | 80 | 38 | 48 |
| Type of notified alerts | 53 | ||
| Increase malaria cases | 17 | 32 | |
| AFP | 8 | 15 | |
| Dog bite | 8 | 15 | |
| Measles suspicion | 8 | 15 | |
| Maternal death | 3 | 6 | |
| Chikungunya | 2 | 4 | |
| Diarrhoea | 2 | 4 | |
| Other | 5 | 9 | |
| Timeliness of alert notification (4 last alerts) | 38 | ||
| 4/4 | 4 | 10 | |
| 3/4 | 2 | 5 | |
| 2/4 | 4 | 10 | |
| 1/4 | 23 | 61 | |
| 0/4 | 5 | 13 | |
| Technological evaluation | |||
| Geographical mobile phone network coverage and coverage at/around HS (Fig. 2) | 80 | ||
| Sources of mobile phone used for data transfer | |||
| WHO | 50 | 63 | |
| Non-WHO | 27 | 34 | |
| Does not know | 2 | 3 | |
| No mobile phone | 1 | 1 | |
| Mobile phone changes/ replacements since job start | |||
| Not since arrival | 49 | 61 | |
| Once | 25 | 31 | |
| Twice | 3 | 4 | |
| Three times | 2 | 3 | |
| Does not use WHO provided mobile phone | 1 | 1 | |
| Mobile phone handling capacity by HS agents | 40 | ||
| Easily | 31 | 74 | |
| Not checked | 1 | 2 | |
| Some difficulties | 6 | 14 | |
| Very difficult | 4 | 10 | |
| Problems encountered (≥1 possible) | 81 | ||
| No electricity/ lack of charging possibilities | 34 | 42 | |
| No/ broken mobile phone charger | 6 | 7 | |
| Phone battery faulty | 11 | 14 | |
| Other | 30 | 37 | |
| Energy sources* | 98 | ||
| Solar energy | 43 | 49 | |
| Electricity grid | 25 | 29 | |
| Generator | 17 | 20 | |
| Car battery | 2 | 2 | |
| Last mobile phone charging problem (in months) | 80 | ||
| < 1 | 30 | 38 | |
| 1–3 | 1 | 1 | |
| 3–6 | 3 | 4 | |
| > 6 | 29 | 36 | |
| No problem | 17 | 21 | |
amore than one answer possible
bcomparison not possible as sent SMS not archived, consultation register or databases at district level not available
Simplicity
Fifteen (19%) of the 80 interviewed agents had terms of reference (TOR) at their work place, and 64% of them were fully familiar with their surveillance activities. Fifty-one agents (64%) had the case definitions guidelines in their HS. The best-known case definition was that for malaria (83%), followed by those of diarrhoea (78%), acute respiratory infections (ARI) (46%) and measles (18%). The case definition of dengue-like syndrome (DLS) was known by 16% overall, by 93% (26/28) in Vatovavy Fitovinany and by 81% (13/16) Atsimo Atsinanana.
Sixty agents (75%) did a weekly compilation of data from the consultation register and 20% compiled them daily. To do this, 39 (35%) used data forms, 13 (12%) had a notebook to register sent SMS, 12 (11%) had a case compilation dashboard and 48 (43%) used other tools. For the 42 agents visited in person, these other tools were confirmed to be disposable note sheets (31%), the consultation register itself (19%) or the weekly overall surveillance report notebook (17%). Fifty-seven percent (24/42) of agents use more than one tool for IDSR data compilation. The reported median time needed to compile the IDSR data was 30 min (range 5–180), that to write and send the SMS was five minutes (range 1–20). This differed by region and by background/training of the HS agent. In the south the median weekly data compilation took 24 and in the southeast 47 min. In HS with medical doctors, 50% needed 30 min or less for data compilation, in HS with paramedical staff it was 59% (p = 0.469). Data compilation took longer in the southeast, where 79% needed > 30 min compared to 21% in the south (p < 0.001).
Data quality
Sixty-seven percent (28/42) of the HS visited in person did not have an archive of sent SMS on their mobile phone.
Thirty-eight of the 80 (47%) interviewed HS had no missing observations for selected frequent diseases within the last ten sent SMS and 5 (6%) had more than four SMS (out of ten) with ≥1 missing observation. For rare diseases/syndromes, 68 (85%) of HS had no missing observations.
Eighteen (43%) of the 42 HS visited in person had erroneous observations in 9–10 out of the last ten SMS that were transferred, 16 (38%) had 6–8 mistakes. Two (5%) of them had no mistakes. The mean number of erroneous observations in the last ten sent SMS was 12 (range 0–51). Eleven (65%) HS with medical agents and 22 (58%) with paramedical agents had transmitted > 10 erroneous observations among the last ten SMS sent (p = 0.637). By type of HS, four (10%) BHC1 had > 10 erroneous observations, 27 (40%) BHC2, and 2 (5%) PCRC (p = 0.179). There were more erroneous data transmitted from the southeast (67%) compared to the south (33%) region (p = 0.004).
The median number of supervisions the 80 interviewed HS had in 2014 was 2 (range 0–26), there was no difference between the south and southeast.
Completeness and timeliness
In the four weeks preceding our interviews, the routine data transfer completeness was 73% (232/320). Main reasons for non-completeness cited by the agents were the monthly DHO meeting (17%), training (17%), illness (13%) or lost telephone and/or subscriber identification module (SIM) card (13%).
The overall timeliness of routine reporting was 43% (136/320). Forty-four percent (34/77) of HS sent all four of the SMS of the previous four weeks in time, and 19% did not send any of the four SMS in time. The reasons for non-timeliness were high workload (24%), telephone network problem (16%), training or illness (11% each) and illness (10%).
Almost half (38/80, or 48%) of the HS issued an alert over the four weeks before our interviews, and in total 79 alerts were notified. Among the 53 alerts for which information was available, an increase in malaria cases was the most frequently notified event (32%), followed by acute flaccid paralysis (AFP) cases, dog bites, and measles suspicion (15% each). Out of the 38 HS that notified an alert, 10% (4/38) notified all last four events in time.
Thirty-five (70%) of the HS with paramedical agents had transferred data in time, for those with medical agents 21 (78%) did timely data transfer (p = 0.467). Routine data transfer was timely by 9 (69%) BHC1, 44 (73%) BHC2 and 3 (75%) PCRC (p = 0.950) respectively.
Technological evaluation
The geographical mobile phone network coverage by each of the three available providers (Airtel, Telma, Orange) detected during evaluation of the 80 HS is illustrated in Fig. 2 (Mobile phone network coverage at/around HS (N = 80), south and south-east, Madagascar, 2014). Between 39 (49%) and 42 (53%) HS had mobile phone coverage within their structure depending on the provider; this proportion slightly increased when the area around the HS was explored for coverage (up to 58%). Coverage was slightly higher with Airtel, the currently used IDSR network provider, compared to the other two mobile phone companies’ networks. However, 23 (29%) of the evaluated HS were not covered by the Airtel network at all.
Fig. 2.
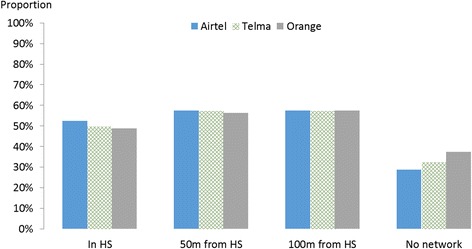
Mobile phone network coverage at/around HS (N = 80), south and south-east, Madagascar, 2014. Bar chart illustrating the coverage by each of the three available mobile phone network providers within the HS and at 50 and 100 m distance
Sixty-three percent (50/80) of the mobile phones used by the 80 interviewed HS agents during our evaluation came from WHO, who originally provided them for the reinforced IDSR. Two HS (3%) did not know the phone’s origin and one did not have a phone. For 49 (61%) HS agents, there had been no mobile phone changes or replacements since their start on the position, 31% had had one replacement, 7% more than one. Nearly three quarters (31/42) could easily handle a mobile phone under observation, whereas 24% had some or greater difficulty with this.
Eighty-one problems with mobile phones were reported, with 8% (6/80) of HS mentioning more than one. Of these, 63% (51/81) were related to diverse aspects of mobile phone charging: electricity cuts or problems (42%), lack of or broken charger (7%) or faulty phone battery (14%).
Some HS used more than one energy source, the most frequently used one was solar energy (43/87, or 49%), followed by grid electricity (29%), electric generator (20%) and car battery (2%). Seventeen (21%) of the HS reported not having had a problem to charge the mobile phone, for 36% the last problem was more than 6 months ago, while 38% reported having had problem with this within the last month (Table 3).
Discussion
The evaluation of the reinforced IDSR strategy in the south and southeast of Madagascar allowed us to assess the system’s functioning and identify challenges to be addressed before introduction of mobile health data collection in further districts in Madagascar.
Simplicity
The evaluation of the IDSR activities at HS level raised a number of issues regarding knowledge of terms of reference, surveillance procedures, and case definitions. These could be due to the lack of guidelines and documents, for example TOR and case definitions, in the HS. In some HS the turnover of agents is high, and not all receive IDSR training.
Knowledge of case definitions was better for frequent diseases/syndromes like malaria and diarrhoea. In a similar way, HS agents in regions where DLS is prevalent were more familiar with the clinical case definition. Similar issues related to lack of guidelines, training, and supervision have been identified in other countries [10, 11].
Data collection, compilation and writing (in SMS form) was not straightforward and time-consuming depending on peoples’ familiarity with the procedures and dexterity with mobile phones. More than half of the agents used more than one tool for the weekly data compilation. On average, the preparation and sending of the data each week takes the interviewed HS agents 35 min, even if this differed by region and took agents in the southeast longer. This and the larger proportion of erroneous data from the southeast might be due to its more recent inclusion. We compared results according to data collection method for indicators to explore potential bias (ease of execution of surveillance activities). There was no evidence for a difference between results from HS visited in person vs. those interviewed by telephone.
In order for disease surveillance systems to be effective, it is crucial they are simple to understand and perform [2]. In principle, electronic data transfer is supposed to improve data quality [12], but we found many problems that might be related to the case ascertainment (case definition knowledge) and data compilation steps.
Regular training and supervision would allow improving knowledge of IDSR methods and activities, and standardisation of data compilation in a simple manner across HS would be a solution to increase HS agents’ mastering of IDSR activities [13].
Data quality
The quality of the data collected within the reinforced IDSR surveillance shows there is room for improvement. Albeit better for rare diseases, half of the HS transferred data with missing observations within the ten-week period assessed during the evaluation. Another issue undermining the reliability of the surveillance results was the amount of erroneous data transferred by the HS. Only a small proportion of transferred SMS had no mistakes. This does not seem to be related to the type of HS or training level of the responsible agent, even though the numbers might have been too small to detect a difference. The data quality problems are also related to points discussed under simplicity, notably lack of guidelines and training [10, 13]. They could further be explained by the small number of supervision visits that took place in the year preceding the evaluation, as well as the already mentioned high agent turnover. Colleagues in Madagascar recently evaluated the national sentinel influenza surveillance system that includes 34 HS and is also based on SMS transmission of aggregated data. It performed well regarding the quality of the data collected, but pointed out a need for improving staff training [14].
Completeness & timeliness
Completeness and timeliness were too low to respond to the surveillance objectives. This concerns in particular the detection of unexpected health events. HS agents reported a high workload and technical problems as the main challenges they face with regards to routine data transfer. We could not assess completeness of alert notification, since there was no reliable system or register to which the transferred data could have been compared. Timeliness of alert notification was poor, and early detection of disease outbreaks in the evaluated areas is not ensured.
Simplification of data compilation and transfer, as well as ensuring working technologies (chargeable mobile phone and functioning android application), could help with improving these two attributes [15]. Closer supervision and support of HS IDSR activities could also help with improving these attributes’ outcome, but these would come at a price and cost-effectiveness might need to be evaluated [16].
Technology evaluation
Not all aspects of the evaluation could be verified for those HS that were interviewed by telephone.
While more industrialised countries are most implementing electronic medical records and/or data transfer, this remains a financial and logistical challenge in many African states [17]. The increase in new technologies that can support epidemiological surveillance has made a positive difference in performance and data quality [15, 18].
Finally, we are convinced that regular results’ feedback to those who provide the surveillance data could help raising interest, dedication and motivation of HS agents responsible of IDSR. This could have a positive impact on several of the surveillance attributes we evaluated, notably simplicity, data quality, completeness and timeliness [13].
We believe that the reinforced IDSR surveillance should not be limited to one mobile network provider but that the choice of these should be based on network availability at each HS, to increase realistic coverage.
Recommendations
Following our evaluation, we recommended to the IDSR collaborators and the Ministry of Health to:
Revisit choice of HS included in the system according to mobile phone network coverage
Produce and distribute simple, understandable TOR and case definition guidelines that can be displayed within the HS
Reinforce capacities of the persons involved in surveillance activities through supervisory training
Improve data collection, compilation and transfer by rendering it electronic
Add other mobile phone network providers to increase coverage of HS in the regions
Conclusion
Early detection of unexpected health events is crucial to minimise the impact of epidemics [10, 19]. The IDSR approach is suitable for this, but it needs to be adapted to each specific context. Simple procedures, physical presence of guidelines and support material, as well as training and supervision are key to making it a success.
In Madagascar’s southern regions, SMS transfer has improved IDSR data completeness, but timeliness and data quality remain a problem. Healthcare staff needs training on IDSR guidelines and case definitions. Since May 2016, data are collected and managed electronically in several pilot districts in Madagascar to reduce errors and improve the system’s performance. Since April 2017, a weekly surveillance bulletin is circulated to central level, regional and district health offices. We hope this bulletin will also be accessible to the data providers, to show them the use and benefit of their IDSR-related work activities.
Acknowledgements
We wish to thank all the evaluation team members and HS agents who participated in this project and who helped us understand the situation and make improvement for the rollout of the electronic data collection that is now ongoing. This work would not have been possible without the support of the colleagues from the IOC Health Surveillance Unit and the Epidemiological Surveillance Department of Madagascar, who have hugely facilitated all administrative and logistical aspects.
Funding
The funding for the project, of which this evaluation was part, came from the Agence Française de Développement. The agency had no part in the design of the study and collection, analysis, and interpretation of data and in writing this manuscript.
Availability of data and materials
The datasets used and analysed during the current study are available from the corresponding author on reasonable request.
Abbreviations
- AFP
Acute flaccid paralysis
- ARI
Acute respiratory infection
- BCH
Basic Healthcare Centre
- CERF
Central emergency response fund
- DHO
District Health Office
- DLS
Dengue-like syndrome
- DVSSE
Direction de Veille Sanitaire et Surveillance Epidémiologique (Epidemiological Surveillance Department)
- HS
Health structure (any level)
- IDSR
Integrated disease surveillance and response strategy
- IHR
International health regulations
- IOC
Indian Ocean Commission
- PCRC
Primary Care Reference Centre
- PH
Public health
- SARI
Severe acute respiratory syndrome
- SMS
Short message service
- TOR
Terms of reference
- WHO (AFRO)
World Health Organization (Regional Office for Africa)
Appendix
Appendix 1
Table 4.
Description of the SMS-reinforced IDSR strategy. Table describing characteristics of the reinforced IDSR strategy in southern Madagascar including objectives, indicators, data source, collection, transfer and use
| Characteristic | Description |
|---|---|
| PH importance of diseases/ syndromes under surveillance | Diseases under surveillance constitute the biggest part of basic healthcare consultations such as Acute Respiratory Infections (ARI), malaria, diarrhoea |
| Available interventions | 23/35 of the diseases and syndromes under surveillance have a defined response foreseen in the national health action plan |
| IDSR objectives | Follow the trend of endemic and/or epidemic diseases and syndromes |
| Detect cases of highly epidemic diseases or diseases subject to elimination or eradication programmes as well as unexpected events in a timely manner | |
| Provide IHR data to the WHO | |
| Performance indicators used | Weekly number of cases and deaths by disease, syndrome or event, and by HS |
| Proportional morbidity: Number of consultations by disease, syndrome or event/ Number of total consultations | |
| Completeness: Number of reports received/Number of expected surveillance reports | |
| Timeliness: Number of reports received within 48 h after the week in question/Number of expected surveillance reports | |
| Information collected | Number of cases and deaths for three groups of diseases/syndromes/ events |
| • Endemic and potential epidemic diseases: Acute Respiratory Infections (ARI), diarrhoeal diseases, malnutrition, malaria, tuberculosis, Human Immunodeficiency Virus (HIV), Sexually Transmitted Infections (STI), maternal deaths | |
| • Highly epidemic diseases: cholera, bacterial dysentery, meningitis, plague, yellow fever, viral haemorrhagic fever, chikungunya, dengue-like syndrome (DLS), rabies, foodborne outbreaks, severe acute respiratory syndrome (SARS), avian influenza, Rift Valley fever, chickenpox, West Nile virus | |
| • Diseases subject to eradication or elimination programmes: poliomyelitis & acute flaccid paralysis (AFP), leprosy, measles, neonatal tetanus, filariasis, malaria | |
| Data source | HS patient consultation register |
| Data collection, entry and transfer | Compilation of weekly number of total consultations, and cases and deaths per disease/ syndrome or event (including zero reporting) before sending them per SMS to the DHO. At the DHO, the surveillance focal point enters the data into an Excel spreadsheet. |
| Database set-up | One observation (line) per week and per district |
| Data analysis and thresholds | Weekly analyses based on defined thresholds, for example: |
| • Disease for which one case = epidemic, such as meningitis, acute flaccid paralysis, neonatal tetanus, measles, SARI, avian influenza, cholera, plague, haemorrhagic fever, human rabies | |
| • Malaria: doubling of cases over three consecutive weeks | |
| • Brutal increase in comparison with other diseases/ syndromes | |
| • Completeness and timeliness of data transfer | |
| Communication | No routine communication of analysis results to stakeholders (2016) |
| Use of data and analyses results | Weekly monitoring of performance indicators (completeness, timeliness), investigation of and response to potential identified or notified signals |
Appendix 2
Fig. 3.
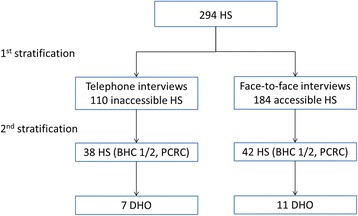
Selection of HS included in the reinforced IDSR strategy evaluation, Madagascar. Flowchart describing the selection of HS included in the evaluation following the stratification criteria described in the methods section
Authors’ contributions
RR1 was a fellow of the Indian Ocean Field Epidemiology Training Programme and within this frame in charge of the evaluation. He largely led the methodological preparation and execution of the project, and analysed and interpreted the collected data. RR1, GR, NV and RR2 were part of the evaluation teams who collected the data from the HS. HR1, HR2, RL, LF and AH from the IOC Health Surveillance Unit were part of the conceptual team and supervised all steps of the project.
ALR from the WHO in Madagascar is the main collaborator of the Health Ministry in this and ongoing IDSR projects, and was equally part of the study’s conceptual team. AH wrote the draft manuscript. All authors read and approved the final manuscript.
Ethics approval and consent to participate
Our project constitutes a surveillance system evaluation, whose aim it was to assess if the system responds to its objectives and how it could be improved if necessary. As such, research ethics committee approval was not required. The necessary permissions were obtained from the Ministry of Health at national as well as regional level. All interviewees were employees of the Ministry of Health, half of them were interviewed face-to-face, the other half by phone. The purpose of the project was explained to them beforehand and their verbal consent was obtained prior to collecting responses on their surveillance related activities. Last but not least, no names were recorded and all analysed data were anonymous.
Consent for publication
Not applicable.
Competing interests
The authors declare that they have no competing interests.
Publisher’s Note
Springer Nature remains neutral with regard to jurisdictional claims in published maps and institutional affiliations.
Contributor Information
Rado Randriamiarana, Email: randriamiarana_rado@yahoo.fr.
Grégoire Raminosoa, Email: rgregoiremarieflora@yahoo.fr.
Nikaria Vonjitsara, Email: niikria@yahoo.fr.
Rivo Randrianasolo, Email: reevu2001@yahoo.fr.
Harena Rasamoelina, Email: harena.rasamoelina@coi-ioc.com.
Harimahefa Razafimandimby, Email: rhmahefa2@gmail.com.
Arthur Lamina Rakotonjanabelo, Email: rakotonl@who.int.
Richard Lepec, Email: rm.lepec@gmail.com.
Loïc Flachet, Email: l.flachet@epiconcept.fr.
Ariane Halm, Email: arianehalm@gmail.com.
References
- 1.AbouZahr C, Boerma T. Health information systems: the foundations of public health. Bull World Health Organ. 2005;83(8):578–583. [PMC free article] [PubMed] [Google Scholar]
- 2.Mutale W, Chintu N, Amoroso C, Awoonor-Williams K, Phillips J, Baynes C, et al. Improving health information systems for decision making across five sub-Saharan African countries: implementation strategies from the African health initiative. BMC Health Serv Res. 2013;13(Suppl 2):S9. doi: 10.1186/1472-6963-13-S2-S9. [DOI] [PMC free article] [PubMed] [Google Scholar]
- 3.World Health Organization RO for A, Centers for Disease Control and Prevention C for GH. Technical Guidelines for Integrated Disease Surveillance and Response in the African Region - WHO | Regional Office for Africa, 2nd edition 2010. http://www.afro.who.int/publications/technical-guidelines-integrated-disease-surveillance-and-response-african-region-0, http://www.afro.who.int/sites/default/files/2017-06/IDSR-Technical-Guidelines_Final_2010_0.pdf. Accessed 17 Oct 2016.
- 4.World Health Organization. An integrated approach to communicable disease surveillance. Relevé Épidémiologique Hebd Sect Hygiène Secrétariat Société Nations / Wkly Epidemiol Rec Health Sect Secr Leag Nations. 2000;75(1):1–7. [PubMed]
- 5.WHO | International Health Regulations (2005). http://www.who.int/ihr/9789241596664/en/. Accessed 10 Jan 2017.
- 6.Kasolo F, Yoti Z, Bakyaita N, Gaturuku P, Katz R, Fischer JE, et al. IDSR as a platform for implementing IHR in African countries. Biosecurity Bioterrorism Biodefense Strategy Pract Sci. 2013;11(3):163–169. doi: 10.1089/bsp.2013.0032. [DOI] [PMC free article] [PubMed] [Google Scholar]
- 7.WHO | Evaluating a national surveillance system. http://www.who.int/hiv/pub/surveillance/2013package/module7/en/. Accessed 10 Jan 2017.
- 8.German RR, Lee LM, Horan JM, Milstein RL, Pertowski CA, Waller MN, et al. Updated guidelines for evaluating public health surveillance systems: recommendations from the guidelines working group. MMWR Recomm Rep Morb Mortal Wkly Rep Recomm Rep Cent Dis Control. 2001;50(RR13):1–35. [PubMed] [Google Scholar]
- 9.CDC. Guidelines for Evaluating Surveillance Systems 1998. https://www.cdc.gov/mmwr/preview/mmwrhtml/00001769.htm. Accessed 10 Jan 2017.
- 10.Adokiya MN, Awoonor-Williams JK, Beiersmann C, Müller O. The integrated disease surveillance and response system in northern Ghana: challenges to the core and support functions. BMC Health Serv Res. 2015;15:288. doi: 10.1186/s12913-015-0960-7. [DOI] [PMC free article] [PubMed] [Google Scholar]
- 11.Nsubuga P, Brown WG, Groseclose SL, Ahadzie L, Talisuna AO, Mmbuji P, et al. Implementing integrated disease surveillance and response: four African countries’ experience, 1998-2005. Glob Public Health. 2010;5(4):364–380. doi: 10.1080/17441690903334943. [DOI] [PubMed] [Google Scholar]
- 12.Awoonor-Williams JK, Bawah AA, Nyonator FK, Asuru R, Oduro A, Ofosu A, et al. The Ghana essential health interventions program: a plausibility trial of the impact of health systems strengthening on maternal & child survival. BMC Health Serv Res. 2013;13(Suppl 2):S3. doi: 10.1186/1472-6963-13-S2-S3. [DOI] [PMC free article] [PubMed] [Google Scholar]
- 13.Phalkey RK, Yamamoto S, Awate P, Marx M. Challenges with the implementation of an integrated disease surveillance and response (IDSR) system: systematic review of the lessons learned. Health Policy Plan. 2015;30(1):131–143. doi: 10.1093/heapol/czt097. [DOI] [PubMed] [Google Scholar]
- 14.Rakotoarisoa A, Randrianasolo L, Tempia S, et al. Evaluation of the influenza sentinel surveillance system in Madagascar, 2009–2014. Bull World Health Organ. 2017;95(5):375–381. doi: 10.2471/BLT.16.171280. [DOI] [PMC free article] [PubMed] [Google Scholar]
- 15.Agarwal S, LeFevre AE, Lee J, L’Engle K, Mehl G, Sinha C, et al. Guidelines for reporting of health interventions using mobile phones: mobile health (mHealth) evidence reporting and assessment (mERA) checklist. BMJ. 2016;352:i1174. doi: 10.1136/bmj.i1174. [DOI] [PubMed] [Google Scholar]
- 16.Huaman MA, Araujo-Castillo RV, Soto G, Neyra JM, Quispe JA, Fernandez MF, et al. Impact of two interventions on timeliness and data quality of an electronic disease surveillance system in a resource limited setting (Peru): a prospective evaluation. BMC Med Inform Decis Mak. 2009;9:16. doi: 10.1186/1472-6947-9-16. [DOI] [PMC free article] [PubMed] [Google Scholar]
- 17.Williams F, Boren SA. The role of the electronic medical record (EMR) in care delivery development in developing countries: a systematic review. Inform Prim Care. 2008;16(2):139–145. doi: 10.14236/jhi.v16i2.685. [DOI] [PubMed] [Google Scholar]
- 18.Simba DO, Mwangu M. Application of ICT in strengthening health information systems in developing countries in the wake of globalisation. Afr Health Sci. 2004;4(3):194–198. [PMC free article] [PubMed] [Google Scholar]
- 19.Adokiya MN, Awoonor-Williams JK, Barau IY, Beiersmann C, Mueller O. Evaluation of the integrated disease surveillance and response system for infectious diseases control in northern Ghana. BMC Public Health. 2015;15:75. doi: 10.1186/s12889-015-1397-y. [DOI] [PMC free article] [PubMed] [Google Scholar]
Associated Data
This section collects any data citations, data availability statements, or supplementary materials included in this article.
Data Availability Statement
The datasets used and analysed during the current study are available from the corresponding author on reasonable request.