

Vitamin A deficiency leads to virus persistence in the upper respiratory tract
Keywords: cytokine, parainfluenza virus, respiratory tract, Treg, vitamin A deficiency
Abstract
The World Health Organization (WHO) estimates that 250 million children under the age of five suffer from vitamin A deficiencies (VAD). Individuals with VAD experience higher rates of mortality and increased morbidity during enteric and respiratory infections compared with those who are vitamin A sufficient. Previously, our laboratory has demonstrated that VAD mice have significantly impaired virus-specific IgA and CD8 + T-cell responses in the airways. Here, we demonstrate that VAD mice experience enhanced cytokine/chemokine gene expression and release in the respiratory tract 10 days following virus infection compared with control vitamin A sufficient animals. Cytokines/chemokines that are reproducibly up-regulated at the gene expression and protein levels include IFNγ and IL-6. Despite previous indications that cytokine dysregulation in VAD animals might reflect low forkhead box P3 (FoxP3)-positive regulatory T-cell frequencies, we found no reduction in FoxP3 + T cells in VAD respiratory tissues. As an alternative explanation for the high cytokine levels, we found that the extent of virus infection and the persistence of viral antigens were increased on day 10 post-infection in VAD animals compared with controls, and consequently that respiratory tract tissues had an increased potential to activate virus-specific T cells. Results encourage cautious management of viral infections in patients with VAD, as efforts to enhance FoxP3 + T cell frequencies and quell immune effectors could potentially exacerbate disease if the virus has not been cleared.
Introduction
Vitamin A deficiency (VAD) is one the most serious nutritional problems facing the world today. In 2004, over 600000 deaths in children under the age of five were attributed to VAD ( 1 ), due in part to increased susceptibility to infectious diseases. Vitamin A is obtained from dietary sources in the form of retinol, beta-carotene or retinyl esters. Vitamin A is primarily stored in the liver in the ester form, which can be de-esterified into the alcohol form (retinol) and released into the blood stream. Retinol is then converted to retinal by alcohol dehydrogenases, a group of enzymes commonly found in most cell types. Further conversion of retinal to retinoic acid (RA), an active metabolite of vitamin A, is mediated by retinaldehyde dehydrogenases (RALDHs). These enzymes were originally discovered in gut dendritic cells (DCs) ( 2 ), leading to the belief that DCs were the main distributors of RA. More recently, macrophages ( 3 ) and epithelial cells ( 4–6 ) have been shown to express this class of enzymes, expanding the repertoire of cells able to convert retinal to RA.
RA has long been recognized as a key regulator of immune function, altering the activity of innate and adaptive immune cells alike. Historically, research efforts to define RA influences on the immune response have largely focused on the intestinal tract. Studies have shown that RA supports normal migratory and antigen-presenting activities of DCs ( 7 , 8 ), as well as phagocytic activities of macrophages ( 9 , 10 ). B- and T-cell activities are also influenced by vitamin A, both directly and indirectly. Vitamin A supports: (i) B-cell activation, stability and class switching, which is essential for the normal appearance of IgA and IgA antibody-forming cells (AFCs) in the intestinal tract ( 11 , 12 ), (ii) DC-mediated imprinting of effector T cells with tissue-specific homing integrins (e.g. α4β7) to assist trafficking of T cells to gut tissues ( 2 ) and (iii) the development and stability of forkhead box P3 (FoxP3 + ) regulatory T cells (Tregs), which can play an important role in contraction of immune responses and maintenance of homeostasis ( 13–17 ).
There are numerous examples of dysregulated cytokine expression and inflammation under VAD conditions that improve upon supplementation with vitamin A. These results are often ascribed to the induction of FoxP3 + T cells by vitamin A ( 18–27 ). In a mouse model of acute, small-intestinal inflammation Tregs treated in vitro with vitamin A were able to suppress inflammation upon transfer into afflicted animals ( 28 ). Similarly, in a mouse model for colitis, treatment with vitamin A resulted in increased FoxP3 and decreased IL-6 expression in colonic tissues and ameliorated disease symptoms ( 29 ). In vitro , RA can promote the differentiation of naive T cells into FoxP3 + inducible regulatory T cells (iTreg) in the presence of TGFβ ( 16 , 30 ). Activity is mediated in part by RA binding to the retinoic acid receptor (RAR) subunit of the RAR/RXR (retinoid X receptor) heterodimer in conjunction with the binding of non-RA agonists to the RXR subunit ( 14–16 , 31 ). Importantly, FoxP3 expression directly inhibits the transcriptional activity of RAR-related orphan receptors RORα and RORγt that would otherwise drive the development of pro-inflammatory T h 17 cells ( 32 , 33 ). In the absence of exogenous vitamin A, naive T cells treated with IL-6 and TGFβ in vitro exhibit decreased FoxP3 expression ( 34 ) and are driven toward the pro-inflammatory T h 17 cell lineage ( 35 ).
Previously, we have examined virus-specific immune responses in the upper respiratory tract (URT) of VAD animals, a key site of entry for respiratory pathogens. We identified similarities between immune activities in the URT and those previously reported in studies of the small intestine. For example, we found that IgA expression and CD8 + T cells were reduced in VAD animals infected with a respiratory virus ( 36 , 37 ). Here, we expand upon those findings by analyzing cytokine/chemokine activity following respiratory virus infection. We discovered that VAD animals experience enhanced cytokine activity in nasal tissues following viral infection, as compared with controls. Unexpectedly, we observed no reduction in the frequency of FoxP3 + T cells in the respiratory tract of VAD animals. Seeking an alternative explanation for the observed enhanced cytokine response led us to more closely examine the course of respiratory virus infection in VAD animals. Despite previously detecting little to no difference in viral load during peak infection times (day 7) ( 36 ), here we demonstrate that at 10 days post-infection, when infection begins to wane, increased amounts of infectious virus and viral antigens can be detected in the nasal tissues of VAD mice as compared with controls. URT tissues from infected VAD animals also exhibited an increased potential to trigger cytokine expression by virus-specific CD4 + T cells. Data suggest that an under-active rather than over-active immune response resulted in delayed viral clearance and a consequent up-regulation of cytokines.
Our results emphasize that caution should be taken when treating respiratory virus infections in patients with vitamin deficiencies. Simple efforts to avoid cytokine/chemokine over-expression by enhancing Treg frequencies and down-regulating immune effectors may be counterproductive if virus has not been cleared.
Methods
Animals and VAD
The C57BL/6 (H2 b ) mice used throughout the study were purchased from Jackson Laboratories (Bar Harbor, ME, USA) as pregnant females. Mice were housed as specified by the Association for Assessment and Accreditation for Laboratory Animal Care (AALAC) guidelines and all protocols were approved by the Institutional Animal Care and Use Committee (IACUC). Day 4–5 estrus pregnant females were placed on either a control or VAD diet (Harlan Laboratories, Madison, WI, USA) upon their arrival in the animal facility at St. Jude Children’s Research Hospital, as previously described ( 36 , 37 ). VAD (cat. no. TD.10762) and control (cat. no. TD.10764) diets differed only in vitamin A content, containing either 0 or 15 IU g −1 vitamin A palmitate, respectively. Mice remained on their assigned diets throughout their pregnancies and while nursing. Weaned pups were continued on the appropriate diets until adulthood and throughout experimentation. Vitamin A levels were evaluated in the VAD mouse model by serum testing at the Texas Veterinary Diagnostic Laboratory (Fort Collins). Control animals exhibited levels of serum retinol of ≥20 µg dl −1 and VAD animals exhibited undetectable levels of serum retinol. Experiments were conducted with both male and female adult mice in test and control groups. Potential differences between male and female mice were not evaluated. Mice were sacrificed by anesthetization with tribromoethanol (avertin) followed by exsanguination or by carbon dioxide asphyxiation followed by cervical dislocation.
Infections and viral titers
Mice were anesthetized with avertin followed by intra-nasal (IN) inoculations with 250 pfu of Sendai virus (SeV; Enders strain). This low dose was selected to limit pathology and ensure mouse survival. The same dose was used in our previous studies of virus-specific IgA and CD8 + T-cell responses ( 36 , 37 ). A slightly higher dose of 500 pfu was previously used to evaluate virus titers on day 7 and weight loss from days 0 to 10, revealing no stark differences between VAD and control animals, and no death during the 10-day observation period ( 36 ). At indicated time points, mice were sacrificed and tissues were harvested for titering. Nasal tissue was harvested by removing skin, lower jaws, soft palates, muscles, cheek bones and incisors from the head. Nasal and lung tissues were homogenized in 1 and 3ml PBS, respectively, and then serially diluted in DMEM/0.1% BSA + 5 µg ml −1 Acetylated Trypsin. Dilutions were plated on MK-2 cells (200 µl well −1 ) in sextuplicate. Plates were incubated at 37°C for 4 days at which point 50 µl were removed from each well, mixed with 50 µl of chicken red blood cells (1:200 dilution of packed red blood cells) and incubated at 4°C for 45min. Plates were scored for hemagglutination and TCID 50 were calculated using the Reed–Muench formula ( 38 ).
LacZ-inducible T-cell hybridomas
SeV-specific T-cell hybridomas were generated as previously described ( 39 , 40 ). Briefly, lymphocytes were isolated from the mediastinal lymph nodes of SeV-infected C57BL/6 mice 10 days after infection. Blast cells were fused with BWZ.36 cells, which contain the lacZ gene fused to the NFAT-activated enhancer of the IL-2 gene. The T-cell clone used in this study (H5204-H5) was specific for amino acids 421–436 of the SeV HN protein (VYIYTRSSGWHSQLQIG). The control HIV envelope-specific hybridoma (HUGP3-25) was generated as previously described ( 41 ) and was specific for the envelope peptide IVGNIRQAHCNVSKA.
Antigen persistence T-cell hybridoma assay
Antigen-presenting cells (APCs) were prepared from naive mouse spleen cells by depleting T cells with an anti-mouse Thy1.2 antibody (AT83) on ice for 30 min and complement (1:5 ratio of rabbit:guinea pig complement) in complete tumor medium [CTM; consists of Modified Eagles Medium (Invitrogen, Grand Island, NY, USA) with dextrose (500 µg ml −1 ), glutamine (2mM), 2-mercaptoethanol (30 µM), essential and non-essential amino acids, sodium pyruvate, sodium bicarbonate and antibiotics] plus 0.1% BSA at 37°C for 1h. Cells were irradiated with 3000 rad. APCs (5×10 5 cells well −1 ) along with hybridoma cells (10 5 cells well −1 ) were added to 96-well flat-bottom plates along with either serial dilutions of tissue from infected mice or hybridoma-specific peptides as appropriate. Serial dilutions of peptides started at 10 µg ml −1 . Nasal tissue was collected from infected mice and an emulsification was performed by pulverizing the tissue with a syringe plunger in 1000 µl of CTM supplemented with 10% FBS, followed by straining through a 70 µM cell strainer. Two-fold serial dilutions of emulsified tissues were added to the 96-well plates containing APCs and hybridoma cells beginning at 12.5 µl well −1 . Cultures were incubated overnight at 37°C and the following morning an X-gal assay was performed to identify responding hybridomas. The co-cultured APCs and hybridoma cells were first washed with PBS and then fixed with 2% formaldehyde and 0.2% glutaraldehyde in PBS for 5min at 4°C. After fixing, cells were washed again with PBS and then β-galactosidase activity was detected by adding 50 μl of PBS containing 5mM potassium ferrocyanide, 5mM potassium ferricyanide, 2mM MgCl 2 and 1mg ml −1 of the substrate 5-bromo-4-chloro-3-indolyl-β- d -galactopyranoside (X-gal) to each well. Plates were incubated at 37°C for at least 8h to overnight. Blue cells were counted using a tissue culture inverted microscope. Statistical analyses were performed using GraphPad Prism. To calculate P values, an unpaired t -test was performed on the values from the lowest dilution (12.5 µl) of tissue added to the hybridoma cells.
Cytokine assays
Nasal washes were performed with euthanized, SeV-infected mice by rinsing nasal cavities with 200 µl PBS. Wash samples were centrifuged to remove cellular material, and the supernatants were tested for the presence of 32 different cytokines, using a Milliplex MAP Kit (Millipore; cat. no. MCYTOMA-70K-PX32). Cytokines/chemokines examined included: G-CSF, Eotaxin, GM-CSF, IFNγ, IL-1α, IL-1β, IL-2, IL-3, IL-4, IL-5, IL-6, IL-7, IL-9, IL-10, IL-12(p40), IL-12(p70), LIF, IL-13, LIX, IL-15, IL-17, IP-10, KC, MCP-1, MIP-1α, MIP-1β, M-CSF, MIP-2, MIG, RANTES, VEGF, TNFα. Samples, controls and standards were prepared and processed as described in the Milliplex Handbook and read on a Luminex 200 Multiplexing Instrument using xPonent software. Data were processed using Milliplex Analyst software and statistical analyses were performed using Excel software. Area under a curve (AUC) calculations were performed with GraphPad Prism Software.
Gene expression profiling by microarray analysis
Control and VAD mice ( n = 3 per group) were infected with 250 pfu SeV. Nasal tissues were harvested at 10 days post-infection and combined for each group. Tissue was treated with collagenase (4mg ml −1 in PBS) for 30min at 37°C, and then passed through a 70 µM cell strainer with a syringe plunger. Cell suspensions were layered onto a 40/75% discontinuous Percoll gradient and centrifuged at 1800 r.p.m. for 30min. Lymphocytes were collected from the gradient interface (nasal tissue-associated lymph tissue [NALT]) and washed 1× with PBS. RNA was then isolated from cells using an RNeasy Microkit (Qiagen) and quantitated using a Nanodrop 1000 spectrophotometer (Thermo). RNA was collected and analyzed from three separate experiments.
Twenty nanograms of total RNA were converted to cDNA using the NuGEN Ovation Pico WTA v2 system and then labeled with biotin using the NuGEN Encore Biotin module (NuGEN Technologies, Inc., CA, USA). Biotinylated cDNA targets were hybridized to an Affymetrix HT MG-430 PM array which interrogates >39000 mouse transcripts. Processing of the hybridized arrays was performed using the Affymetrix GeneTitan system. Signals from scanned arrays were summarized using the RMA algorithm (Affymetrix Expression Console v1.1). Differential expression in VAD and control samples was determined using Gene Set Enrichment Analysis (GSEA) as described ( 42 , 43 ). GSEA software v2.06 was obtained from the Broad Institute ( http://www.broadinstitute.org/gsea/index.jsp ). A total of 1606 canonical pathways were obtained from the Broad’s Molecular Signature Database (c2.cp.v3.1), from Ingenuity Pathways (Ingenuity Systems, CA, USA) and from MetaCore (GeneGO, Thomas Reuters, CA, USA). Gene annotations (na33, December 2012) obtained from the Affymetrix NetAffx website were used to collapse the data set to unique gene symbols according to the maximum signal observed across redundant probe sets. Ranking of gene expression in VAD samples versus control samples was calculated using the signal to noise ratio algorithm in the GSEA software. A P -value for each Gene Set enrichment score (ES) was calculated by comparing the observed ES to those obtained from a null distribution generated from 1000 permutations of genes within gene sets. The false discovery rate (FDR) was calculated as previously described ( 43 ) and an FDR threshold <0.05 was established to identify significantly differentially expressed pathways. Differentially expressed transcripts were identified using the Local Pooled Error (LPE) t -test with the FDR estimated by the Benjamini–Hochberg method ( 44 ). Functional enrichment analysis of gene lists was performed using the DAVID bioinformatics databases ( http://david.abcc.ncifcrf.gov/ ) ( 45 ).
Nasal tissue immunohistochemical staining
Nasal tissues from VAD and control mice were fixed in 10% neutral buffered formalin, decalcified, embedded in paraffin, sectioned (4 µm) and stained with hematoxylin and eosin stain. Immunohistochemical detection of FoxP3 + cells required epitope retrieval. Briefly, sections were incubated in citrate buffer pH 6.0 (Invitrogen) in a pressurized decloaking chamber (Biocare Medical) at 110°C for 15min. A rat anti-mouse FoxP3 antibody (eBioscience) was used at a 1:100 dilution for 2h with Background Sniper (Biocare Medical) added as a protein block to reduce nonspecific labeling. Following washes, slides were incubated with biotinylated rabbit anti-rat immunoglobulin (Vector, 1:200) for 30min, then with horseradish peroxidase labeled streptavidin (Thermo Fisher) for 10min, and finally with 3,3-diaminobenzidine (Thermo Shandon) for 5min. Sections were then counterstained with hematoxylin 1:10 for 3min. Sendai virus antigen was detected by first performing antigen retrieval in citrate buffer pH 6.0 at 98°C for 30min in a pressurized decloaking chamber. A chicken anti-Sendai virus polyclonal antibody (AbCam; 1:16000) was added for 30min followed by a goat anti-chicken antibody (Vector, 1:200) for 30min, and finally a rabbit anti-goat antibody (Vector, 1:200) was added for 30min. Next a rabbit-on-rodent polymer labeled with HRP (Biocare Medical, 1:200) was added for 30min (a detection system developed for binding rabbit antibodies on mouse tissue). This was followed as above with the 3,3-diaminobezidine chromogenic substrate and a light hematoxylin counterstain. Slides were analyzed by a pathologist in the Veterinary Pathology Core Department of St. Jude Children’s Research Hospital.
FACS analysis
NALT was collected from control and VAD mice as described above. First, Fc block (CD16/CD32) was applied to cells for 20min on ice. Cells were then stained with CD4 PerCPCy5.5 (1:400; BD Biosciences) and CD25 allophycocyanin (1:200; BD Biosciences) for 20min on ice. Stain was removed and cells were re-suspended in FoxP3 fixation/permeabilization solution (eBioscience) and left overnight at 4°C. Permeabilization solution was then removed and cells were stained with FoxP3 PE (1:100; eBioscience) for 30min at RT. Cells were then washed twice, re-suspended in 1%FCS in PBS and evaluated on a FACSCalibur (Becton Dickson) Instrument. Cells were first gated for the lymphocyte population as determined by forward and side scatter, and then a second gate for CD4-positive cells was applied. CD25 and FoxP3 staining was then evaluated within the CD4 + lymphocyte population. Analysis was performed using FlowJo software and statistic values were calculated using Excel.
Results
Increased cytokine gene expression following respiratory virus infection in VAD mice
A battery of tests was conducted on VAD and control mice after an intra-nasal infection with 250 pfu SeV, as outlined in Fig. 1 . Our first studies examined global differences in RNA isolated from URT (NALT) 10 days after infection of VAD and control animals. RNA was reverse transcribed to cDNA and gene expression data were generated using the Affymetrix Gene Titan platform. GSEA of the microarray profiles clearly demonstrated cytokine/chemokine gene up-regulation in VAD mice compared with controls. Overall, 37 immune-related pathways were significantly activated in VAD mice (FDR < 0.05). Figure 2 shows the top four pathways up-regulated in VAD mice. Pathways all typified an inflammatory response, including ‘graft-versus-host disease’ ( Fig. 2A ), ‘chemokine receptor binding’ ( Fig. 2B ), ‘cytokine receptor interactions’ ( Fig. 2C ) and ‘cytokine pathways’ ( Fig. 2D ). For each pathway the top 10 ranking genes are shown. We identified the recurring top-ranked genes across the 37 activated pathways by performing “leading edge” analysis within the GSEA software. The 100 top ranked genes on the basis of the number of occurrences in the GSEA-identified pathways are shown in Table 1 . Figure 2E shows a heat map of the top 15 occurring genes ordered by relative increase in expression. Notably, among the 37 gene sets significantly up-regulated in VAD mice the top recurring genes were IFNγ, TNFα, IL-6 and IL-4.
Fig. 1.

Experimental design and timeline. Animals were infected with 250 pfu of SeV intra-nasally and samples were collected for various analyses at the indicated times post-infection.
Fig. 2.

Expression of cytokine/chemokine genes is up-regulated in VAD mice compared with controls after Sendai virus infection. RNA was purified from cells isolated from the URT of Sev-infected (250 pfu) control and VAD mice at day 10 post-infection and evaluated for changes in gene expression using the Affymetrix platform. The top four activated pathways in VAD animals are shown (A–D). For each pathway a list of the top 10 up-regulated genes is provided. A heat map of the top 15 recurring genes as identified by GSEA analysis (E) and an overview of the entire data set with transcripts differentially regulated (FDR < 0.05 by LPE t -test) in VAD animals highlighted in red (F) are shown.
Table 1.
Top 100 ranked genes on the basis of the number of occurrences in leading edge analysis of GSEA results
| Gene symbol | No. of gene sets | Gene symbol | No. of gene sets | Gene symbol | No. of gene sets | Gene symbol | No. of gene sets |
|---|---|---|---|---|---|---|---|
| IFNG | 18 | CSF2 | 6 | HLA-A | 5 | IL5RA | 3 |
| TNF | 15 | CCR1 | 6 | CCL4 | 5 | IL4R | 3 |
| IL4 | 14 | CXCL6 | 6 | CXCL13 | 5 | IL1RAP | 3 |
| IL6 | 14 | CCL11 | 6 | CXCR2 | 5 | LY96 | 3 |
| NFKB1 | 13 | IL2 | 6 | CXCR5 | 5 | FPR1 | 3 |
| IL10 | 11 | CXCL11 | 6 | LTA | 5 | FPR2 | 3 |
| IL1A | 11 | CCL7 | 6 | CD80 | 5 | IL7R | 3 |
| HLA-DRA | 10 | IL12RB2 | 6 | IL2RG | 5 | STAT4 | 3 |
| NFKB2 | 10 | CD86 | 6 | IL2RB | 5 | CCBP2 | 3 |
| IFNB1 | 9 | STAT5A | 5 | MAP2K3 | 4 | IL18R1 | 3 |
| IL1B | 9 | CCR8 | 5 | GZMB | 4 | CSF3R | 3 |
| REL | 9 | CCR7 | 5 | STAT3 | 4 | IL15RA | 3 |
| CD28 | 8 | CCR6 | 5 | TLR2 | 4 | SOCS1 | 3 |
| STAT1 | 8 | NOS2 | 5 | HLA-G | 4 | CSF2RA | 3 |
| RELA | 8 | IL12A | 5 | IL12RB1 | 4 | KNG1 | 3 |
| FAS | 7 | CSF3 | 5 | XCL1 | 4 | TNFRSF9 | 3 |
| HLA-DOB | 7 | PRF1 | 5 | IFNGR2 | 4 | TNFRSF1B | 3 |
| CXCL1 | 7 | CXCL3 | 5 | PTGS2 | 3 | ANXA1 | 3 |
| CCL20 | 7 | CXCL2 | 5 | SYK | 3 | TNFSF9 | 3 |
| IL18 | 7 | CXCL9 | 5 | PDYN | 3 | PNOC | 3 |
| CXCL10 | 7 | CCL25 | 5 | IL1R2 | 3 | EPOR | 3 |
| IL2RA | 7 | STAT2 | 5 | IL23A | 3 | JAK3 | 3 |
| CD40 | 6 | IL15 | 5 | NPB | 3 | OSMR | 2 |
| NFKBIE | 6 | IL11 | 5 | MAP2K1 | 3 | ADORA1 | 2 |
| NFKBIA | 6 | SOCS3 | 5 | PENK | 3 | S1PR3 | 2 |
In addition to performing GSEA analyses, we performed transcript-level comparisons using the LPE t -test. Overall, 243 probe sets were identified as differentially expressed between VAD and control mice (FDR < 0.05; Fig. 2F ). These probe sets corresponded to 97 unique genes up-regulated and 91 unique genes down-regulated in VAD mice. We used the Database for Annotation, Visualization and Integrated Discovery (DAVID) program to perform a gene ontology (GO) enrichment analysis of the differentially expressed genes and found significant functional enrichment (FDR < 0.05) in up-regulated, but not down-regulated, genes ( Table 2 ). Supporting our GSEA analyses, we found the top three enriched GO terms in our study were: ‘cytokine and chemokine mediated signaling’, ‘immunity and defense’, and ‘immune response’. Approximately one-third of all genes found to be significantly up-regulated in VAD mice were identified as being involved in immunity and defense. Thus, the results of our GSEA and DAVID analyses together demonstrated that vitamin A is a key regulator of immune-related gene expression in response to respiratory virus infection and that in its absence, cytokine and chemokine signaling is up-regulated.
Table 2.
Top-ranked biological processes enriched within transcripts significantly up-regulated in VAD versus control mice (FDR < 0.05 by LPE t -test)
| Term | Category | No. of of genes | % of genes | P -value |
|---|---|---|---|---|
| BP00107: Cytokine and chemokine mediated signaling pathway | PANTHER_BP_ALL | 17 | 17.2 | 2.55E-14 |
| BP00148: Immunity and defense | PANTHER_BP_ALL | 33 | 33.3 | 2.76E-13 |
| GO:0006955: Immune response | GOTERM_BP_FAT | 17 | 17.2 | 7.43E-10 |
| BP00288: Granulocyte-mediated immunity | PANTHER_BP_ALL | 9 | 9.1 | 1.58E-09 |
| GO:0006935: Chemotaxis | GOTERM_BP_FAT | 10 | 10.1 | 2.86E-09 |
| GO:0042330: Taxis | GOTERM_BP_FAT | 10 | 10.1 | 2.86E-09 |
| BP00122: Ligand-mediated signaling | PANTHER_BP_ALL | 14 | 14.1 | 1.60E-08 |
| GO:0009611: Response to wounding | GOTERM_BP_FAT | 13 | 13.1 | 1.08E-07 |
| GO:0006954: Inflammatory response | GOTERM_BP_FAT | 11 | 11.1 | 1.38E-07 |
| GO:0007626: Locomotory behavior | GOTERM_BP_FAT | 10 | 10.1 | 2.44E-06 |
| BP00155: Macrophage-mediated immunity | PANTHER_BP_ALL | 8 | 8.1 | 3.90E-06 |
| GO:0031424: Keratinization | GOTERM_BP_FAT | 5 | 5.1 | 1.01E-05 |
| GO:0006952: Defense response | GOTERM_BP_FAT | 12 | 12.1 | 1.07E-05 |
| BP00255: Cytokine/chemokine mediated immunity | PANTHER_BP_ALL | 7 | 7.1 | 1.26E-05 |
| GO:0006953: Acute-phase response | GOTERM_BP_FAT | 5 | 5.1 | 1.34E-05 |
| GO:0007610: Behavior | GOTERM_BP_FAT | 11 | 11.1 | 2.69E-05 |
| GO:0030216: Keratinocyte differentiation | GOTERM_BP_FAT | 5 | 5.1 | 8.92E-05 |
| GO:0009913: Epidermal cell differentiation | GOTERM_BP_FAT | 5 | 5.1 | 1.13E-04 |
| BP00274: Cell communication | PANTHER_BP_ALL | 16 | 16.2 | 2.57E-04 |
| GO:0030595: Leukocyte chemotaxis | GOTERM_BP_FAT | 4 | 4 | 3.08E-04 |
| GO:0060326: Cell chemotaxis | GOTERM_BP_FAT | 4 | 4 | 3.08E-04 |
| GO:0008544: Epidermis development | GOTERM_BP_FAT | 6 | 6.1 | 3.72E-04 |
| GO:0007398: Ectoderm development | GOTERM_BP_FAT | 6 | 6.1 | 4.95E-04 |
| GO:0002526: Acute inflammatory response | GOTERM_BP_FAT | 5 | 5.1 | 6.75E-04 |
| BP00103: Cell surface receptor mediated signal transduction | PANTHER_BP_ALL | 23 | 23.2 | 7.09E-04 |
| BP00156: Interferon-mediated immunity | PANTHER_BP_ALL | 5 | 5.1 | 1.14E-03 |
| GO:0050900: Leukocyte migration | GOTERM_BP_FAT | 4 | 4 | 1.23E-03 |
| BP00071: Proteolysis | PANTHER_BP_ALL | 13 | 13.1 | 2.95E-03 |
| BP00287: Cell motility | PANTHER_BP_ALL | 7 | 7.1 | 4.38E-03 |
Increased cytokine protein production in VAD animals following respiratory virus infection
To determine if changes in transcription resulted in measurable differences in protein expression, we examined cytokine production in nasal washes of VAD and control mice using the Luminex platform. Samples were collected on days 0, 3, 6, 10, 17 and 25 post-infection. Thirty-two cytokines and chemokines were evaluated at each time point. Of the 32 proteins tested, all but 7 (IL-2, IL-3, IL-5, IL-7, IL-12 p70, IL-13 and IL-17) were detectable at some point during the course of infection. In general, cytokine levels increased in both VAD and control animals by 3 days post-infection and returned to baseline levels by 25 days post-infection. Cytokines typically peaked at day 6 in control mice, but many remained elevated past this time point in VAD mice, peaking instead at day 10. Several cytokines, including IFNγ and IL-4, were expressed at levels several fold higher at day 10 than ever observed in control mice at any point during infection. This suggests that VAD both elevates and prolongs cytokine expression during respiratory virus infection ( Fig. 3 ).
Fig. 3.
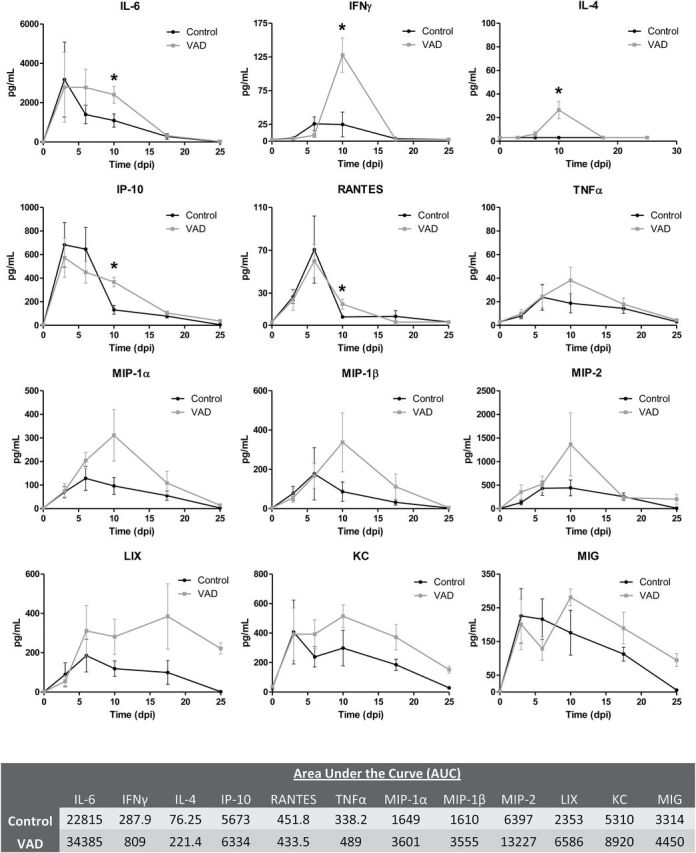
Cytokine expression is elevated and prolonged in the URT mucosa of VAD animals during viral infection. Nasal washes from uninfected and SeV-infected (250 pfu) control and VAD mice were collected at days 3, 6, 10, 17 and 25 post-infection ( n = 3 per group per time point). Nasal wash samples were examined for cytokine expression using the Luminex platform. Asterisks indicate significantly up-regulated cytokines at day 10 post-infection ( P < 0.05 by unpaired t -test). AUC was calculated for VAD and control mice and values are listed by cytokine in the table below the plots. Any values below the limit of detection were set to that limit for statistical purposes. Data shown are the averages of two separate experiments, except for day 25 which was evaluated in a single experiment.
Cytokines that exhibited reproducible and significant differences in the nasal washes of VAD and control mice at 10 days post-infection included IL-6, IFNγ, IL-4, IP-10 and RANTES ( Fig. 3 ). An additional seven cytokines, including TNFα, trended toward enhanced expression in VAD mice compared with controls at this time point. Thus, several of the top genes identified in the GSEA analyses were also found to be up-regulated on the protein level at the mucosal surface in VAD mice. When AUC was calculated it was found that every cytokine elevated in VAD mice at day 10, except for RANTES, had an increased AUC compared with controls. Notably, the AUCs for IFNγ, IL-4, MIP-1α, MIP-1β, MIP-2 and LIX were increased 200% or more in VAD mice ( Fig. 3 ).
Cytokines that exhibited no reproducible differences between VAD and control animals on day 10 are shown in Supplementary Figure 1 , available at International Immunology Online. Not all of the cytokines/chemokines identified as up-regulated at the gene expression level in VAD mice were measurably different at the protein level, which may be the result of reduced sensitivity in the Luminex assay or retention of proteins in nasal tissues. No significant differences ( P < 0.05) were detected in cytokine levels between control and VAD mice at day 6 post-infection, though VAD mice did exhibit decreased MCP-1 expression ( P = 0.06) at this time point ( Supplementary Figure 1 is available at International Immunology Online). Though not statistically significant, VAD mice also exhibited decreased levels of GM-CSF throughout the course of infection. Calculation of the AUC for these cytokines revealed approximately a 50% decrease in expression in VAD mice compared with controls ( Supplementary Figure 1 is available at International Immunology Online). These results confirmed that there was an overall dysregulation of cytokine/chemokine expression in VAD mice compared with controls following virus infection of the respiratory tract.
Increased cytokine production in VAD animals is not associated with reduced numbers of FoxP3 + T cells in nasal tissues of VAD mice
To determine if FoxP3 + T cells were lacking in respiratory tissues of VAD mice, URT tissue sections were prepared and stained for FoxP3 on days 0, 3, 10, 17 and 25 days post-infection and scored by a veterinary pathologist. FoxP3 + cells were observed at low frequencies in the nasal tissues in both control and VAD mice prior to infection ( Fig. 4A and B ). As early as 3 days post-infection the number of FoxP3 + T cells increased, but remained infrequent in the sub-mucosa and within the olfactory and respiratory epithelium at sites of infection ( Fig. 4C and D ). Similar numbers of FoxP3 + cells were observed in control and VAD mice at day 3. By day 10, increased numbers of FoxP3 + cells could be observed in both control and VAD mice ( Fig. 4E and F ). However, by day 17 post-infection FoxP3 + cell numbers waned in control mice ( Fig. 4G ), but remained elevated in VAD ( Fig. 4H ). By day 25, T-cell numbers waned in both animal sets ( Fig. 4I and J ). This temporal pattern of FoxP3 + cell appearance and disappearance follows that of cytokine expression. FoxP3 + cell numbers wane only after cytokines wane in both control and VAD mice. In addition to our immunohistochemical (IHC) studies, we also quantitated total numbers of FoxP3 + cells in the NALT of infected animals at the height of infection by flow cytometry. As shown in Fig. 5 , CD4 + CD25 + FoxP3 + T cells were observed at elevated frequencies in VAD mice at 6 days post-infection compared with controls. Altogether, these results demonstrate that at no point during respiratory virus infection do VAD animals exhibit decreased FoxP3 + T-cell numbers and suggest that although vitamin A is supportive of the generation of FoxP3 + T cells in vitro ( 35 ), it is not a strict requirement for generation of FoxP3 + T cells in vivo . Clearly, the high cytokine/chemokine profiles observed during infection cannot be explained simply by reduced numbers of FoxP3 + T cells in the nasal tissues of VAD animals.
Fig. 4.
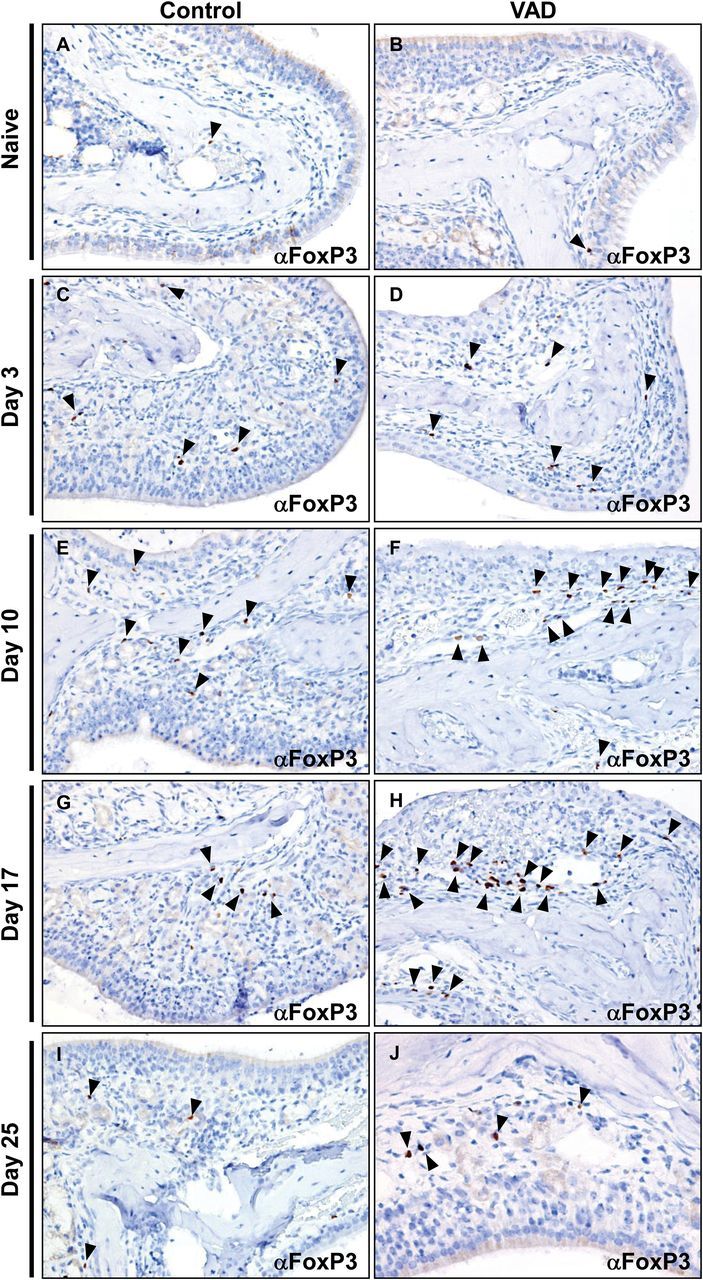
Regulatory T cells are observed at similar or elevated frequencies at days 10 and 17 post-infection in the URT of VAD mice compared with controls. Nasal tissues from SeV-infected (250 pfu) control and VAD mice were stained by immunohistochemistry for FoxP3. FoxP3 staining is shown in naive mice (A, B) and at days 3 (C, D), 10 (E, F), 17 (G, H) and 25 (I, J) post-infection. Slides were counterstained with hematoxylin. Images were taken with a 40× objective. For each time point, slides from two animals from each of two separate experiments ( n = 4 total per group) were evaluated. Arrowheads point to FoxP3 + cells.
Fig. 5.

Increased frequencies of regulatory T cells can be observed by FACS analysis in the URT of VAD compared with control mice during viral infection. Lymphocytes from the NALT were isolated from SeV-infected (250 pfu) control and VAD mice, and analyzed by flow cytometry for expression of CD4, CD25 and FoxP3 at day 6 post-infection ( n = 6–7 per group per experiment). Cells were gated on CD4 expression and then further evaluated for CD25 and FoxP3 expression. Representative plots from an individual control and VAD mouse are shown with CD25 + FoxP3 + cells circled and the percent positive among CD4 + cells listed. Data from two separate experiments are summarized in a table below plots. Abbreviations: Average (Avg); Standard deviation (SD).
Viral infection persists longer in the upper and lower respiratory tract of VAD mice
In an effort to understand why VAD mice experience increased cytokine expression at 10 days post-infection, we decided to take a closer look at the course of viral infection in these animals. Our previous experiments showed little difference in viral titers between VAD and control animals at 7 days post-infection when infection is at its peak for virus production ( 36 ). Given the results of our cytokine study, we decided to extend our analyses to examine viral titers on days 10, 15 and 25 post-infection ( Fig. 6 ). Not surprisingly, the greatest difference in viral titers was detected in the nasal tissue of infected animals at 10 days post-infection. Notably, viral titers were approximately a log higher in the nasal tissues of VAD animals compared with controls ( P = 0.004) and an increased frequency of lung infection was detectable ( P = 0.08) at this time point ( Fig. 6A ). By day 15, virus was cleared from the lungs of both VAD and control animals, but some virus persisted in nasal tissues ( Fig. 6B ). At the end of the time course on day 25, there was no detectable virus in either animal group (data not shown). A summary of the results in Fig. 6C emphasizes that higher virus loads were detected in the nasal tissues of VAD animals on day 10 post-infection and suggests that VAD animals experience delayed viral clearance during respiratory infection.
Fig. 6.

Infectious virus and antigen persist in the URT of VAD mice. Nasal turbinates and lungs were collected from SeV-infected (250 pfu) control and VAD mice ( n = 9–10 per group) at 10 (A) and 15 (B) days post-infection. Tissues were titered on MK-2 cells and scored for virus using an agglutination assay. Each dilution was evaluated in sextuplicate and a TCID 50 for each tissue was determined using the Excel Dose 50 Calculator (Reed–Muench formula). P -values were determined using that Mann–Whitney U test. (C) The geometric mean for each time point was calculated and plotted for both nasal and lung tissues. (D, E) Nasal tissues were harvested from SeV-infected (250 pfu) control and VAD mice at days 3 and 10 post-infection. Tissue sections were stained by immunohistochemistry for SeV. Slides from two animals from each of two separate experiments ( n = 4 per group total) were evaluated.
In addition to measuring infectious virus, we used IHC to examine the persistence of SeV antigens in nasal tissues of infected mice at days 3, 10, 17 and 25 post-infection. Nasal tissues from SeV-infected VAD and control animals was fixed, sectioned and stained for SeV. By day 3 post-infection SeV antigen could be detected ubiquitously throughout the respiratory epithelium in the nasal tissue of both VAD and control mice ( Fig. 6D ). At 10 days post-infection control mice had cleared most SeV antigen from nasal tissues, whereas VAD mice retained large clusters of SeV-positive cells ( Fig. 6E ). Representative images of antigen-positive airway epithelial cells are shown for both control and VAD animals, with arrows highlighting observed differences in antigen abundance. Increased amounts of SeV-positive cellular debris were also noted in the airways of VAD mice compared with controls, indicating a greater extent of damage to the airway epithelium. Only small amounts of antigen could be detected in either control or VAD mice by day 17 post-infection, and antigen was fully cleared from all animals by day 25 (data not shown). These data suggest an important role for vitamin A in the clearance of both infectious virus and viral antigens during respiratory virus infection.
Nasal tissues in VAD mice exhibit increased T-cell activation potential
To assess the activation potential of lingering viral antigen in VAD mice, we harvested nasal tissue from SeV-infected VAD and control mice and performed a hybridoma-based T-cell activation assay. Briefly, we employed the use of a CD4 + T-cell hybridoma that was specifically responsive to a SeV peptide. This hybridoma was generated by inserting a lacZ gene fused to a portion of the IL-2 promoter, allowing cells triggered by antigen to be easily quantified in an X-gal assay. Assays were supplemented with splenocytes from unprimed mice as a source of APCs. As a negative control, infected tissues and APCs were co-cultured with an HIV-specific hybridoma.
Nasal tissues harvested from VAD and control animals 10 days after SeV infection were homogenized, serially diluted and added into the T-cell activation assay as a source of antigen. Corroborating our IHC and titer data, we observed that the SeV-specific hybridoma was activated by tissues from both control and VAD mice, but VAD tissues induced higher frequencies of activated hybridomas compared with controls consistent with a greater antigen burden ( Fig. 7A and B ). As expected, neither control nor VAD SeV-infected tissues activated the HIV-specific hybridoma ( Fig. 7C and D ) and both hybridomas were activated by their appropriate peptide ( Fig. 7E and F ). In total, it appears that delayed viral clearance and lingering viral antigens in VAD nasal tissues likely result in greater T-cell activation potential, thus providing a simple explanation for the enhanced cytokine activity observed during respiratory virus infection in VAD animals compared with controls.
Fig. 7.

Virus-specific T-cell hybridomas are more highly responsive to nasal tissues from Sendai virus-infected VAD mice compared with controls. Nasal tissues from SeV-infected (250 pfu) control and VAD mice were harvested at day 10 post-infection and homogenized in medium ( n = 2–3 per group per experiment). (A, B) Serial dilutions (1:2) of nasal tissues from control or VAD mice were added to APCs and CD4 + T-cell hybridoma cells recognizing an SeV-specific peptide ( P = 0.0289 by unpaired t -test). (C, D) A hybridoma specific for an HIV peptide was used as a negative control. (E, F) Hybridomas were incubated with serial dilutions (1:2) of positive-control viral peptides starting at 10 µg ml −1 . Following an overnight incubation with nasal tissues or peptides, hybridoma cells were fixed and an X-gal assay was performed to quantify activated cells. Each sample dilution was evaluated in 2–4 wells. Data shown are from one representative experiment of two independent experiments.
Discussion
High levels of virus and viral antigens in the respiratory tract of VAD animals associate with up-regulated cytokine expression
Experiments presented in this report demonstrated that VAD mice experience increased cytokine/chemokine gene expression and production in nasal tissues following respiratory virus infection. Cytokine activity in VAD mice generally peaked at 10 days post-infection, waned by day 17, and returned to baseline by day 25. Increases in both T h 1 and T h 2 cytokines were observed. On the basis of the previous literature we tested the possibility that the observed cytokine storm was the direct result of a failure of VAD animals to generate FoxP3 + T cells. Surprisingly, we found no reduction in FoxP3 + T cells in VAD nasal tissues, but instead detected similar or increased frequencies of FoxP3 + T cells in infected VAD mice compared with controls during respiratory virus infection. Further investigation into the kinetics of infection revealed that VAD mice bore a heavier burden of infectious virus and viral antigens at a late stage following initial infection, and an increased potential for T-cell activation. Hence, the observed elevated cytokine expression is likely due in large part to the increased load of infectious virus and viral antigen detected in VAD animals at late times following initial infection compared with controls. The failure of VAD animals to clear virus efficiently is not surprising as VAD impairs virus-specific IgA ( 37 ) and CD8 + T-cell ( 36 ) responses during respiratory virus infection. Defective IgA responses persist even a month after infection and likely for the lifetime of the animal. The virus dose chosen here and previous studies was non-lethal and both VAD and control mice generally cleared these infections. However, in ongoing preliminary studies with a high dose of influenza virus, VAD mice suffer significantly increased frequencies of weight loss and death compared with controls.
Very recently, our laboratory has demonstrated a correlation between vitamin A levels and the amount of total IgA in the sera of humans ( 46 ). This may explain in part why VAD individuals experience increased morbidity and mortality from infectious diseases. If, like our VAD animals, humans have decreased IgA and CD8 + T-cell responses, they may also experience prolonged infections, enhanced inflammation, increased tissue damage, and possible death.
The generation of FoxP3 + T cells in a low vitamin A setting
In vitro studies have shown that vitamin A can drive the induction of FoxP3 + T cells in the presence of TGFβ ( 14 , 35 ), spawning our original hypothesis that a failure to generate FoxP3 + T cells could lead to the observed dysregulation of cytokine expression in the URT of VAD mice. The results we present in this report demonstrate that in vivo , VAD does not impair FoxP3 + T cell appearance in mouse nasal tissues in response to viral infection. Our results are supported by other in vivo studies, which have detected FoxP3 + T cells in VAD animals or animals lacking RARα, a critical receptor for RA-mediated signaling ( 24 , 47 , 48 ). Despite the presence of FoxP3 + cells in the nasal tissues of VAD mice in our study, it remains possible that the cells were not fully functional in their roles as immunosuppressors. FoxP3 + T cells can be highly diverse by origin (natural versus induced), function and differentiation ( 49 ) and may be inhibited by cytokines such as IL-6 ( 47 , 50 ). Nonetheless, Kang et al. ( 48 ) demonstrated that animals fed a diet low in vitamin A had increased numbers of FoxP3 + T cells in the lung and intestine that were shown to have enhanced suppressive activity in vitro compared with animals fed a vitamin A sufficient diet. Of note, the presence of Treg activity in the VAD animals in our study followed a predictable time course (heightened when cytokine expression was waning), which could indicate inhibitory function. Consistent with results of Cha et al. ( 51 ), we saw no indication of IL-17 up-regulation in either our microarray or nasal cytokine analysis, as would be predicted if naive T cells were driven toward T h 17 rather than Treg development in VAD animals. Overall, our data emphasize that the dependency of FoxP3 + T-cell development (versus T h 17 development) on vitamin A is not absolute in vivo , and that the high cytokine expression we observed on day 10 post-respiratory virus infection in VAD animals could not be explained by a lack of FoxP3 + T cells.
Striking a balance between beneficial and destructive immune responses in VAD individuals
Balancing the benefits and risks of a potent, robust immune response is extremely difficult in the context of highly complex processes associated with a respiratory virus infection ( 52 ). A poor response fails to clear virus whereas an overactive response, at its extreme, can lead to asphyxiation and death. This phenomenon has perhaps been best illustrated in the respiratory syncytial virus (RSV) field. Though RSV load is a direct predictor of disease severity in infants ( 53 ), immune cells can also contribute to adverse events associated with RSV disease. In some cases, immune-mediated disease (e.g. asthma) may exist long after the virus has been cleared. In the 1960s, the adverse events caused by an RSV-specific immune response were clearly visualized when two children died and many others were hospitalized from natural exposure to RSV after receiving a formalin-inactivated vaccine. It is hypothesized that formalin treatment of the vaccine destroyed key epitopes for the generation of neutralizing antibodies ( 54 ). Additionally, virus-specific CD8 + T cells were lacking, which is typical of responses to inert vaccines ( 55 ). Poor antibody and CD8 + T-cell responses likely allowed the virus to traffic to the lungs, promoting the infiltration of T cells, eosinophils and neutrophils, which were associated with blocked airways, morbidity and mortality.
The VAD condition described here may share features with events following vaccinations with the formalin-treated RSV vaccine. In VAD mice, the IgA antibody response of the URT, a first line of defense against virus, is lacking. Virus-specific CD8 + T cells that normally clear virus-infected cells are also infrequent. The outcome is increased infectious virus and viral antigens that can drive CD4 + T cells to secrete cytokines. In vivo , this may prompt circular events such that each round of cell infiltration, activation and cytokine release may induce another. This is an important point to consider as new therapies involving the induction of regulatory T-cell responses to combat excessive inflammation are being investigated ( 56 ). Our results suggest that this type of therapy might in some cases be harmful to a VAD individual, as the inhibition of immune reactivity could facilitate virus proliferation and trafficking, exacerbating rather than ameliorating disease. Facilitation of a rapid and robust immune response may instead be desirable so that virus may be cleared to eliminate persistent triggers for cytokine release. Clearly, the interplay of virus, immune effectors, and regulatory cells is complex and deserves continued study to ensure the best management of VAD patients with infectious disease.
Funding
National Institutes of Health (R01 AI088729 and P30 CA21765); the American Lebanese Syrian Associated Charities (ALSAC).
Conflict of interest statement: The authors declared no conflict of interests.
Supplementary Material
References
- 1. Black R. E., Allen L. H., Bhutta Z. A., et al. .; Maternal and Child Undernutrition Study Group . 2008. . Maternal and child undernutrition: global and regional exposures and health consequences . Lancet 371 : 243 . [DOI] [PubMed] [Google Scholar]
- 2. Iwata M. Hirakiyama A. Eshima Y. Kagechika H. Kato C. and Song S. Y . 2004. . Retinoic acid imprints gut-homing specificity on T cells . Immunity 21 : 527 . [DOI] [PubMed] [Google Scholar]
- 3. Denning T. L. Wang Y. C. Patel S. R. Williams I. R. and Pulendran B . 2007. . Lamina propria macrophages and dendritic cells differentially induce regulatory and interleukin 17-producing T cell responses . Nat. Immunol . 8 : 1086 . [DOI] [PubMed] [Google Scholar]
- 4. Rudraraju R. Jones B. G. Surman S. L. Sealy R. E. Thomas P. G. and Hurwitz J. L . 2014. . Respiratory tract epithelial cells express retinaldehyde dehydrogenase ALDH1A and enhance IgA production by stimulated B cells in the presence of vitamin A . PLoS One 9 : e86554 . [DOI] [PMC free article] [PubMed] [Google Scholar]
- 5. Frota-Ruchon A. Marcinkiewicz M. and Bhat P. V . 2000. . Localization of retinal dehydrogenase type 1 in the stomach and intestine . Cell Tissue Res . 302 : 397 . [DOI] [PubMed] [Google Scholar]
- 6. Lampen A. Meyer S. Arnhold T. and Nau H . 2000. . Metabolism of vitamin A and its active metabolite all-trans-retinoic acid in small intestinal enterocytes . J. Pharmacol. Exp. Ther . 295 : 979 . [PubMed] [Google Scholar]
- 7. Darmanin S., Chen J., Zhao S., et al. . 2007. . All-trans retinoic acid enhances murine dendritic cell migration to draining lymph nodes via the balance of matrix metalloproteinases and their inhibitors . J. Immunol . 179 : 4616 . [DOI] [PubMed] [Google Scholar]
- 8. Geissmann F., Revy P., Brousse N., et al. . 2003. . Retinoids regulate survival and antigen presentation by immature dendritic cells . J. Exp. Med . 198 : 623 . [DOI] [PMC free article] [PubMed] [Google Scholar]
- 9. Goldman R . 1984. . Effect of retinoic acid on the proliferation and phagocytic capability of murine macrophage-like cell lines . J. Cell. Physiol . 120 : 91 . [DOI] [PubMed] [Google Scholar]
- 10. Lo H. M. Wang S. W. Chen C. L. Wu P. H. and Wu W. B . 2014. . Effects of all-trans retinoic acid, retinol, and β-carotene on murine macrophage activity . Food Funct . 5 : 140 . [DOI] [PubMed] [Google Scholar]
- 11. Mora J. R. and von Andrian U. H . 2008. . Differentiation and homing of IgA-secreting cells . Mucosal Immunol . 1 : 96 . [DOI] [PubMed] [Google Scholar]
- 12. Mora J. R. and von Andrian U. H . 2009. . Role of retinoic acid in the imprinting of gut-homing IgA-secreting cells . Semin. Immunol . 21 : 28 . [DOI] [PMC free article] [PubMed] [Google Scholar]
- 13. Papatriantafyllou M . 2013. . Regulatory T cells: keeping the numbers steady . Nat. Rev. Immunol . 13 : 618 . [DOI] [PubMed] [Google Scholar]
- 14. Coombes J. L., Siddiqui K. R., Arancibia-Cárcamo C. V., et al. . 2007. . A functionally specialized population of mucosal CD103 + DCs induces Foxp3 + regulatory T cells via a TGF-beta and retinoic acid-dependent mechanism . J. Exp. Med . 204 : 1757 . [DOI] [PMC free article] [PubMed] [Google Scholar]
- 15. Sun C. M., Hall J. A., Blank R. B., et al. . 2007. . Small intestine lamina propria dendritic cells promote de novo generation of Foxp3 T reg cells via retinoic acid . J. Exp. Med . 204 : 1775 . [DOI] [PMC free article] [PubMed] [Google Scholar]
- 16. Benson M. J. Pino-Lagos K. Rosemblatt M. and Noelle R. J . 2007. . All-trans retinoic acid mediates enhanced T reg cell growth, differentiation, and gut homing in the face of high levels of co-stimulation . J. Exp. Med . 204 : 1765 . [DOI] [PMC free article] [PubMed] [Google Scholar]
- 17. Zhou X., Kong N., Wang J., et al. . 2010. . Cutting edge: all-trans retinoic acid sustains the stability and function of natural regulatory T cells in an inflammatory milieu . J. Immunol . 185 : 2675 . [DOI] [PMC free article] [PubMed] [Google Scholar]
- 18. Cantorna M. T. Nashold F. E. and Hayes C. E . 1994. . In vitamin A deficiency multiple mechanisms establish a regulatory T helper cell imbalance with excess T h 1 and insufficient T h 2 function . J. Immunol . 152 : 1515 . [PubMed] [Google Scholar]
- 19. Carman J. A. and Hayes C. E . 1991. . Abnormal regulation of IFN-gamma secretion in vitamin A deficiency . J. Immunol . 147 : 1247 . [PubMed] [Google Scholar]
- 20. Carman J. A. Pond L. Nashold F. Wassom D. L. and Hayes C. E . 1992. . Immunity to Trichinella spiralis infection in vitamin A-deficient mice . J. Exp. Med . 175 : 111 . [DOI] [PMC free article] [PubMed] [Google Scholar]
- 21. Iwata M. Eshima Y. and Kagechika H . 2003. . Retinoic acids exert direct effects on T cells to suppress T h 1 development and enhance T h 2 development via retinoic acid receptors . Int. Immunol . 15 : 1017 . [DOI] [PubMed] [Google Scholar]
- 22. Long K. Z., Santos J. I., Rosado J. L., et al. . 2006. . Impact of vitamin A on selected gastrointestinal pathogen infections and associated diarrheal episodes among children in Mexico City, Mexico . J. Infect. Dis . 194 : 1217 . [DOI] [PubMed] [Google Scholar]
- 23. Miyagawa N. Homma T. Kagechika H. Shudo K. and Nagai H . 2003. . Effect of synthetic retinoid, TAC-101, on experimental autoimmune disease . Pharmacology 67 : 21 . [DOI] [PubMed] [Google Scholar]
- 24. Mora J. R. Iwata M. and von Andrian U. H . 2008. . Vitamin effects on the immune system: vitamins A and D take centre stage . Nat. Rev. Immunol . 8 : 685 . [DOI] [PMC free article] [PubMed] [Google Scholar]
- 25. Racke M. K., Burnett D., Pak S. H., et al. . 1995. . Retinoid treatment of experimental allergic encephalomyelitis. IL-4 production correlates with improved disease course . J. Immunol . 154 : 450 . [PubMed] [Google Scholar]
- 26. Reifen R. Nur T. Ghebermeskel K. Zaiger G. Urizky R. and Pines M . 2002. . Vitamin A deficiency exacerbates inflammation in a rat model of colitis through activation of nuclear factor-kappaB and collagen formation . J. Nutr . 132 : 2743 . [DOI] [PubMed] [Google Scholar]
- 27. Zunino S. J. Storms D. H. and Stephensen C. B . 2007. . Diets rich in polyphenols and vitamin A inhibit the development of type I autoimmune diabetes in nonobese diabetic mice . J. Nutr . 137 : 1216 . [DOI] [PubMed] [Google Scholar]
- 28. Menning A., Loddenkemper C., Westendorf A. M., et al. . 2010. . Retinoic acid-induced gut tropism improves the protective capacity of Treg in acute but not in chronic gut inflammation . Eur. J. Immunol . 40 : 2539 . [DOI] [PubMed] [Google Scholar]
- 29. Bai A. Lu N. Guo Y. Liu Z. Chen J. and Peng Z . 2009. . All-trans retinoic acid down-regulates inflammatory responses by shifting the Treg/T h 17 profile in human ulcerative and murine colitis . J. Leukoc. Biol . 86 : 959 . [DOI] [PubMed] [Google Scholar]
- 30. Ross A. C . 2012. . Vitamin A and retinoic acid in T cell-related immunity . Am. J. Clin. Nutr . 96 : 1166S . [DOI] [PMC free article] [PubMed] [Google Scholar]
- 31. Takeuchi H., Yokota-Nakatsuma A., Ohoka Y., et al. . 2013. . Retinoid X receptor agonists modulate Foxp3 + regulatory T cell and T h 17 cell differentiation with differential dependence on retinoic acid receptor activation . J. Immunol . 191 : 3725 . [DOI] [PubMed] [Google Scholar]
- 32. Kimura A. and Kishimoto T . 2010. . IL-6: regulator of Treg/T h 17 balance . Eur. J. Immunol . 40 : 1830 . [DOI] [PubMed] [Google Scholar]
- 33. Weaver C. T. and Hatton R. D . 2009. . Interplay between the T h 17 and TReg cell lineages: a (co-)evolutionary perspective . Nat. Rev. Immunol . 9 : 883 . [DOI] [PubMed] [Google Scholar]
- 34. Takaki H., Ichiyama K., Koga K., et al. . 2008. . STAT6 inhibits TGF-beta1-mediated Foxp3 induction through direct binding to the Foxp3 promoter, which is reverted by retinoic acid receptor . J. Biol. Chem . 283 : 14955 . [DOI] [PMC free article] [PubMed] [Google Scholar]
- 35. Mucida D., Park Y., Kim G., et al. . 2007. . Reciprocal T h 17 and regulatory T cell differentiation mediated by retinoic acid . Science 317 : 256 . [DOI] [PubMed] [Google Scholar]
- 36. Rudraraju R. Surman S. L. Jones B. G. Sealy R. Woodland D. L. and Hurwitz J. L . 2012. . Reduced frequencies and heightened CD103 expression among virus-induced CD8(+) T cells in the respiratory tract airways of vitamin A-deficient mice . Clin. Vaccine Immunol . 19 : 757 . [DOI] [PMC free article] [PubMed] [Google Scholar]
- 37. Surman S. L. Rudraraju R. Sealy R. Jones B. and Hurwitz J. L . 2012. . Vitamin A deficiency disrupts vaccine-induced antibody-forming cells and the balance of IgA/IgG isotypes in the upper and lower respiratory tract . Viral Immunol . 25 : 341 . [DOI] [PMC free article] [PubMed] [Google Scholar]
- 38. Reed L. J. and Muench H . 1938. . A simple method of estimating fifty percent endpoints . Am. J . Hyg . 27 : 493 . [Google Scholar]
- 39. Sanderson S. and Shastri N . 1994. . LacZ inducible, antigen/MHC-specific T cell hybrids . Int. Immunol . 6 : 369 . [DOI] [PubMed] [Google Scholar]
- 40. Usherwood E. J. Hogg T. L. and Woodland D. L . 1999. . Enumeration of antigen-presenting cells in mice infected with Sendai virus . J. Immunol . 162 : 3350 . [PubMed] [Google Scholar]
- 41. Surman S., Lockey T. D., Slobod K. S., et al. . 2001. . Localization of CD4 + T cell epitope hotspots to exposed strands of HIV envelope glycoprotein suggests structural influences on antigen processing . Proc. Natl Acad. Sci. U. S. A . 98 : 4587 . [DOI] [PMC free article] [PubMed] [Google Scholar]
- 42. Mootha V. K., Lindgren C. M., Eriksson K. F., et al. . 2003. . PGC-1alpha-responsive genes involved in oxidative phosphorylation are coordinately downregulated in human diabetes . Nat. Genet . 34 : 267 . [DOI] [PubMed] [Google Scholar]
- 43. Subramanian A., Tamayo P., Mootha V. K., et al. . 2005. . Gene set enrichment analysis: a knowledge-based approach for interpreting genome-wide expression profiles . Proc. Natl Acad. Sci. U. S. A . 102 : 15545 . [DOI] [PMC free article] [PubMed] [Google Scholar]
- 44. Benjamini Y. and Hochberg Y . 1995. . Controlling the false discovery rate: a practical and powerful approach to multiple testing . J. Roy. Stat. Soc. Ser. B 57 : 289 . [Google Scholar]
- 45. Huang d. a. W. Sherman B. T. and Lempicki R. A . 2009. . Systematic and integrative analysis of large gene lists using DAVID bioinformatics resources . Nat. Protoc . 4 : 44 . [DOI] [PubMed] [Google Scholar]
- 46. Jones B. G., Oshansky C. M., Bajracharya R., et al. . 2015. . Retinol binding protein and vitamin D associations with serum antibody isotypes, serum influenza virus-specific neutralizing activities, and airway cytokine profiles . Clin. Exp. Immunol . doi:10.1111/cei.12718 [DOI] [PMC free article] [PubMed] [Google Scholar]
- 47. Cassani B. Villablanca E. J. De Calisto J. Wang S. and Mora J. R . 2012. . Vitamin A and immune regulation: role of retinoic acid in gut-associated dendritic cell education, immune protection and tolerance . Mol. Aspects Med . 33 : 63 . [DOI] [PMC free article] [PubMed] [Google Scholar]
- 48. Kang S. G. Wang C. Matsumoto S. and Kim C. H . 2009. . High and low vitamin A therapies induce distinct FoxP3 + T-cell subsets and effectively control intestinal inflammation . Gastroenterology 137 : 1391e1 . [DOI] [PMC free article] [PubMed] [Google Scholar]
- 49. Tang Q. and Bluestone J. A . 2008. . The FoxP3 + regulatory T cell: a jack of all trades, master of regulation . Nat. Immunol . 9 : 239 . [DOI] [PMC free article] [PubMed] [Google Scholar]
- 50. Korn T., Reddy J., Gao W., et al. . 2007. . Myelin-specific regulatory T cells accumulate in the CNS but fail to control autoimmune inflammation . Nat. Med . 13 : 423 . [DOI] [PMC free article] [PubMed] [Google Scholar]
- 51. Cha H. R., Chang S. Y., Chang J. H., et al. . 2010. . Downregulation of T h 17 cells in the small intestine by disruption of gut flora in the absence of retinoic acid . J. Immunol . 184 : 6799 . [DOI] [PubMed] [Google Scholar]
- 52. Pommerenke C., Wilk E., Srivastava B., et al. . 2012. . Global transcriptome analysis in influenza-infected mouse lungs reveals the kinetics of innate and adaptive host immune responses . PLoS One 7 : e41169 . [DOI] [PMC free article] [PubMed] [Google Scholar]
- 53. DeVincenzo J. P. El Saleeby C. M. and Bush A. J . 2005. . Respiratory syncytial virus load predicts disease severity in previously healthy infants . J. Infect. Dis . 191 : 1861 . [DOI] [PubMed] [Google Scholar]
- 54. Openshaw P. J. Culley F. J. and Olszewska W . 2001. . Immunopathogenesis of vaccine-enhanced RSV disease . Vaccine 20 (Suppl. 1): S27 . [DOI] [PubMed] [Google Scholar]
- 55. Olson M. R. and Varga S. M . 2007. . CD8 T cells inhibit respiratory syncytial virus (RSV) vaccine-enhanced disease . J. Immunol . 179 : 5415 . [DOI] [PubMed] [Google Scholar]
- 56. Bluestone J. A . 2005. . Regulatory T-cell therapy: is it ready for the clinic? Nat. Rev. Immunol . 5 : 343 . [DOI] [PubMed] [Google Scholar]
Associated Data
This section collects any data citations, data availability statements, or supplementary materials included in this article.