
Figure 5.
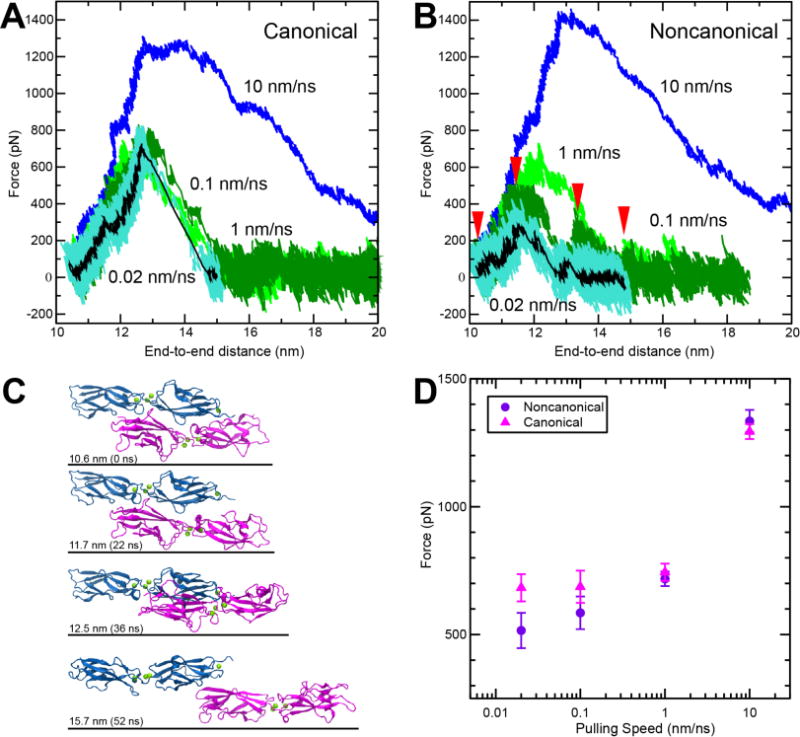
SMD simulations predict that the complex formed by cdh23 and pcdh15(N2) can be weaker than the complex formed with pcdh15(N1). (A-B) Force vs. end-to-end distance for (A) canonical complex formed by cdh23 and pcdh15(N1) (simulations S3b to S3e, Table S1) and (B) noncanonical complex formed by cdh23 and pcdh15(N2) (simulations S1b to S1e) at pulling speeds of 10 nm/ns (blue); 1 nm/ns (light green); 0.1 nm/ns (dark green); and 0.02 nm/ns (cyan; running average of 1 ns in black). (C) Snapshots from simulation S1d (0.1 nm/ns; Table S1) during unbinding at timepoints indicated by red arrows in (B). (D) Plot of average peak force vs. pulling speed for both variants (Table S1). Bars represent the standard error.