
Figure 5. Psoas Density is a Better Predictor of Poor Outcomes than Psoas Area.
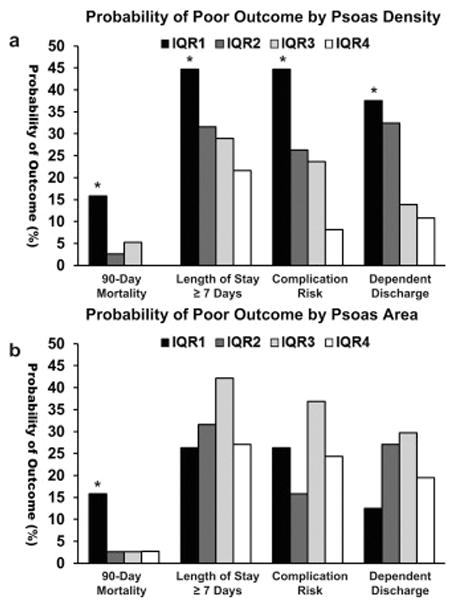
a. When the cohort is grouped into interquartile ranges by HUAC, those in the sarcopenia group (IQR1) have significantly increased probability of mortality (p = 0.008), length of stay = 7 (p = 0.047), complication (p = 0.002), and dependent discharge (p = 0.03).
Decreasing density from a higher quartile increases probability of poor outcome, indicating a density-dependent effect.
b. When the cohort is grouped into interquartile ranges by PI, those in the sarcopenia group have significantly increased probability of mortality only (p = 0.008).
IQR1; 1st – 25th percentile, IQR2; 26th – 50th percentile, IQR3; 51st – 75th percentile, IQR4; 76th – 100th percentile, HUAC; Hounsfield Unit Average Calculation, PI; Psoas Index, * marks significance below a = 0.05