

SUMMARY
Pancreatic ribonuclease (RNase) is a secreted enzyme critical for host defense. We discover an intrinsic RNase function, serving as a ligand for epidermal growth factor receptor (EGFR), a member of receptor tyrosine kinase (RTK), in pancreatic ductal adenocarcinoma (PDAC). The closely related bovine RNase A and human RNase 5 (angiogenin/ANG) can trigger oncogenic transformation independently of their catalytic activities via direct association with EGFR. Notably, high plasma ANG level in PDAC patients is positively associated with response to EGFR inhibitor erlotinib treatment. These results identify a role of ANG as a serum biomarker, which may be used to stratify patients for EGFR-targeted therapies, and offer insights into the ligand-receptor relationship between RNase and RTK families.
Graphical abstract
INTRODUCTION
EGFR is an effective target for anticancer therapies in certain clinical settings (Avraham and Yarden, 2011; Lee et al., 2015). Notably, EGFR tyrosine kinase inhibitors (TKIs) have been approved to treat both lung and pancreatic cancers (Moore et al., 2007; Shepherd et al., 2005). EGFR-activating mutations identified in lung cancers have been well demonstrated to predict response to EGFR-TKI. Moreover, EGFR-mutated lung cancers are often addicted to EGFR activation and sensitive to EGFR-TKI, resulting in prolonged lifespan of a number of lung cancer patients (Rosell et al., 2012). However, those mutations are infrequent in PDAC (Tzeng et al., 2007; Wang et al., 2015), and EGFR-TKI erlotinib has shown only marginal benefit in general without any predictive biomarkers (Troiani et al., 2012). Thus, identification of predictive biomarkers for PDAC could benefit a subpopulation of patients who may be more likely to respond to erlotinib treatment.
The human RNase A superfamily, including human RNase 5 (hRNase5) and human RNase 1 (hRNase1), harbors antimicrobial activity and is generally recognized as part of the host defense system against pathogens (Cho et al., 2005). Of interest, several RNases exert microbicidal function but are not catalytically competent (Sorrentino, 2010), suggesting that RNases may be associated with certain intrinsic functions other than their enzymatic activities. hRNase5 was previously identified as an oncogenic protein that induces blood vessel formation in vitro and in vivo to promote angiogenesis; hence, it was also named angiogenin (hereinafter referred to as ANG) (Hu et al., 1997). More recently, ANG was reported to regulate hematopoietic regeneration by simultaneously promoting stem cell quiescence and progenitor cell proliferation (Goncalves et al., 2016). Interestingly, elevated level of serum ANG was previously reported to correlate with pancreatic cancer aggressiveness (Shimoyama et al., 1996).
RESULTS
Bovine RNase A binds to EGFR extracellular domain and transmits EGFR downstream signaling
Extracellular RNAs, which can act as signaling molecules to regulate cellular functions, have been reported to serve as disease biomarkers. To understand how extracellular RNAs affect cellular processes, we performed a pilot experiment by treating cells with bRNaseA to broadly degrade single-stranded RNA (Raines, 1998). Unexpectedly, catalytically active bRNaseA (Figures S1A and S1B) induced epithelial-mesenchymal transition (EMT)-like morphological changes in different cancer types (Figures S1C-S1E), as indicated by the alteration in the expression of EMT markers (Figures S1F-S1H). In addition, bRNaseA (100 μg/ml) enhanced cell mobility (Figures S1I), and migration and invasion (Figure S1J) whereas the increase in cell number and viability was more apparent with 20 μg/ml bRNaseA (Figures S1K-S1M). To study how bRNaseA induces oncogenic phenotypes, we asked whether bRNaseA triggers receptor phosphorylation and activation since the tyrosine kinase cascades are associated with oncogenesis. Analysis of the phospho-tyrosine (p-Tyr) profile indicated that bRNaseA promoted signaling cascades of Tyr phosphorylation in multiple types of cancer cells; in particular, the p-Tyr content that corresponded to an RTK-equivalent MW of 170-200 kDa was substantially increased by bRNaseA treatment (Figures S1N-S1Q). We then performed an unbiased antibody array for human phospho-RTKs with EGF treatment as a control (Figure S1R). bRNaseA treatment increased phosphorylation of EGFR and ErbB2 in both cervical (HeLa) and pancreatic (AsPC-1) cancer cells (Figures 1A, S1S, and S1T). Moreover, between EGFR and ErbB2, only EGFR was the direct target of bRNaseA as knockdown EGFR but not ErbB2 blocked phosphorylation of both EGFR and ErbB2 (Figures S1U and S1V). MDA-MB-453 cells, which express ErbB2 but not EGFR, did not respond to bRNaseA stimulation (Figure S1W). Several well-recognized EGFR downstream molecules, such as Akt and ERK1/2, were also phosphorylated in response to bRNaseA as shown by the phospho-kinase array analysis (Figures 1B, S1X, and S1Y). Pretreating cells with EGFR-TKI, gefitinib or AG1478, abolished Akt and ERK1/2 activation (Figure 1C), indicating that bRNaseA triggers EGFR downstream signaling in an EGFR kinase-dependent manner.
Figure 1. bRNaseA and ANG associate with EGFR and trigger EGFR signaling.
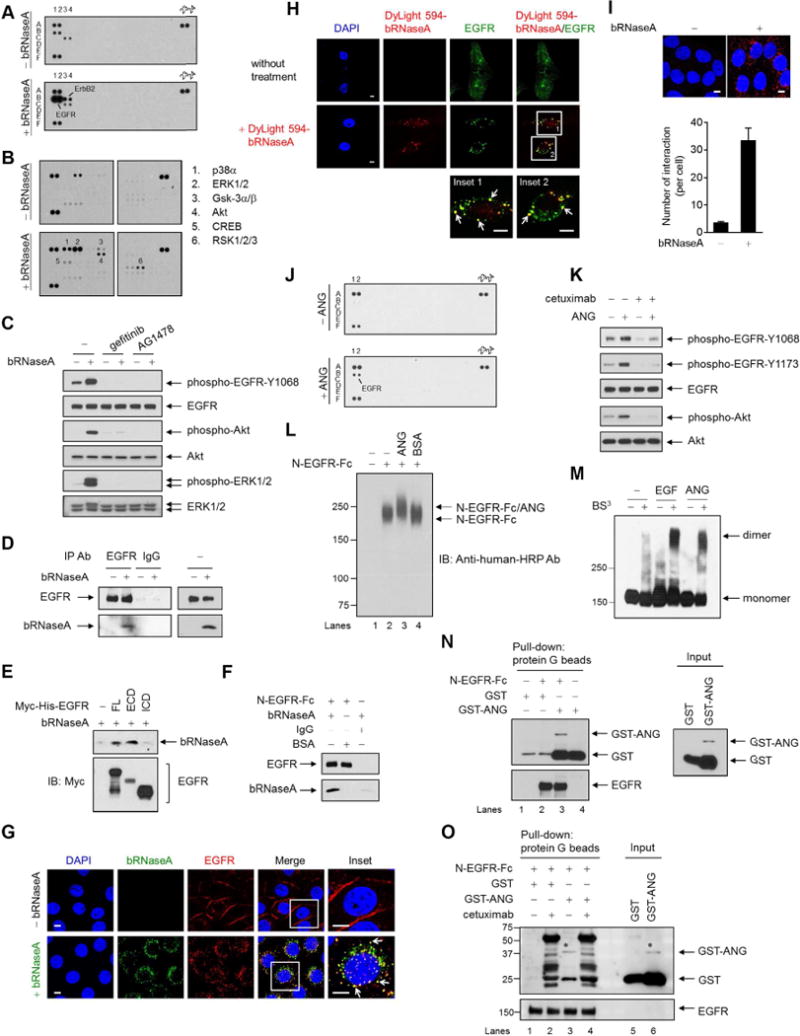
(A) Human phospho-RTK antibody array analysis of HeLa cells serum-starved for 24 hr, followed by bRNaseA (100 μg/ml) treatment for 5 min.
(B) Human phospho-kinase antibody array analysis of HeLa cells treated with or without bRNaseA for 5 min.
(C) HeLa cells pretreated with gefitinib and AG1478 followed by bRNaseA treatment and immunoblot (IB) with the indicated antibodies.
(D) Immunoprecipitation of HeLa cells with antibodies targeting EGFR or normal IgG. Right, input lysates.
(E) In vivo binding assay of bRNaseA in 293T cells transfected with Myc-His-tagged EGFR containing full-length (FL), extracellular domain (ECD), or intracellular domain (ICD) expression plasmid. His beads were used for pull-down.
(F) In vitro binding assay of bRNaseA and N-EGFR-Fc, an N-terminal EGFR recombinant protein. Pull-down was performed using protein G beads. Negative control, normal IgG and BSA.
(G and H) Confocal microscopy of untreated HeLa cells and those treated with bRNaseA (G) or DyLight 594-bRNaseA (H) for 15 min stained with DAPI and the indicated antibodies. Insets, 6.5× magnification. Bar, 5 μm.
(I) HeLa cells stained with EGFR and bRNaseA antibodies and subjected to Duolink in situ PLA. Bar, 5 μm. Bar diagrams, the number of interactions per cell. Error bars represent mean ± SD.
(J) Human phospho-RTK antibody array analysis of HeLa cells serum-starved for 6 hr followed by ANG (1 μg/ml) treatment for 4 min.
(K) HeLa cells pretreated with cetuximab followed by ANG treatment for 5 min and then subjected to IB with the indicated antibodies.
(L) In vitro binding assay of N-EGFR-Fc with ANG cross-linked with DSP and followed by IB under a non-reducing and non-denaturing condition. BSA, negative control.
(M) Dimerization assay of HeLa cells cross-linked with BS3 and followed by IB under a non-reducing and non-denaturing condition. EGFR antibody was used to detect EGFR monomers and dimers.
(N) In vitro binding assay of N-EGFR-Fc incubated with GST-tagged plasmid expressing ANG (GST-ANG) or empty vector (GST). Protein G beads were used for pull-down. Right, input lysates. The 26-kDa GST band is a product of GST-ANG degradation.
(O) In vitro binding assay of N-EGFR-Fc incubated with GST-ANG or GST and cetuximab. *binding and expression of GST-ANG similar to that shown in lane 3 in (N). Non-specific bands in lanes 2 and 4 were mainly from heavy and light chains of cetuximab mAb, which recognizes N-EGFR-Fc. Protein G beads were used for pull-down. These non-specific bands did not appear in (N).
See also Figure S1.
The above results prompted us to ask whether bRNaseA acts as an EGFR ligand and binds to EGFR to transduce signaling. Co-immunoprecipitation by an EGFR antibody (Figure 1D) indicated that bRNaseA interacted with EGFR primarily through the extracellular domain (ECD) of EGFR (Figure 1E), which was further validated by using purified recombinant N-terminal EGFR chimera (N-EGFR-Fc; Figure 1F). Using confocal fluorescence microscopy, we detected co-localization of internalized EGFR and bRNaseA in the cytoplasm (yellow, merged images; Figures 1G and S1Z. The EGFR-bRNaseA co-localization was also demonstrated using bRNaseA recombinant proteins labeled with DyLight 594 fluorescence dye (Figures 1H and S1AA. To further validate their association, we performed Duolink in situ proximity ligation assay (PLA) and detected numerous EGFR-bRNaseA signals representing bRNaseA in close proximity to EGFR (Figure 1I). The signals for co-localization (magenta, merged image) of bRNaseA (red) and internalized EGFR (blue) was detected at 30-min treatment of bRNaseA but declined after 60 min, suggesting that dissociation between bRNaseA and EGFR occurred within this time frame after bRNaseA treatment (arrows in the insets; Figure S1AB). Meanwhile, most of the detected EGFR were recycled back to the cell membrane at 60 min (arrowheads; Figure S1AB. The bRNaseA (red) and EGFR (blue) signals detected at 60 min following treatment co-localized with LysoTracker (green), as indicated by yellow (top; arrows in the insets; Figure S1AC and white (bottom; arrows in the insets; Figure S1AC) merged signals, respectively, suggesting that the dissociation of bRNaseA and EGFR may occur in the lysosomal compartment. Disrupting the interaction between the N-terminal ligand-binding domain of EGFR and bRNaseA by competition with cetuximab (an EGFR-specific monoclonal antibody), N-EGFR-Fc, or EGFR-ECD also attenuated bRNaseA-induced EGFR activation (Figures S1AD-S1AF). Collectively, these results demonstrated that bRNaseA associates with EGFR in vitro and in vivo to induce EGFR internalization and downstream signal pathways and revealed bRNaseA as an EGFR ligand to convey intracellular EGFR signaling.
ANG binds to EGFR via Q93 and binding requires EGFR domains I and III
To identify the human counterpart of bRNaseA that may also function as an EGFR ligand, we tested hRNase1 and ANG, both of which are closely related to bRNaseA (Cho et al., 2005), for their ability to induce RTK activation. Similar to bRNaseA, ANG also induced EGFR phosphorylation and activated its downstream pathways (Figures 1J and S1AG-S1AI). In contrast, hRNase1 did not stimulate phosphorylation of EGFR (data not shown). Thus, we focused on ANG. Pretreatment with cetuximab or EGFR-TKI (erlotinib or gefitinib) blocked ANG-mediated EGFR activation (Figures 1K and S1AJ-S1AL). Purified ANG or bRNaseA formed a complex with recombinant EGFR directly as demonstrated by a higher band shift in a cross-linking assay (Figures 1L and S1AM-S1AO). Similar to EGF, ANG also induced endogenous EGFR dimerization (Figure 1M), which is required for ligand-dependent EGFR activation. In addition, the binding of GST-ANG to EGFR (lane 3, Figure 1N) was attenuated by cetuximab competition as indicated by the disappearance of the ANG band in the presence of cetuximab (lane 3 vs. lane 4, Figure 1O), suggesting a competitive binding site on EGFR between ANG and cetuximab.
To identify the region of ANG required for EGFR binding, we deleted the C-terminal region of ANG (amino acids 74-123) and found that its association with EGFR was abolished (Figures 2A and 2B), suggesting that the C-terminus of ANG is required for EGFR binding. Next, we performed a primary sequence alignment of the C-terminal region between human EGF and ANG (Figure 2C), and identified four conserved residues, including two cysteines (C81 and C92), which are generally crucial for protein structure, and a glutamine (Q93) and a tyrosine (Y94) corresponding to the side chains in human EGF reported to bind to EGFR (Li et al., 2005). When the latter two were mutated to alanine (Q93A and Y94A), the association of each mutant with EGFR was inhibited (Figure 2D), suggesting that they may play a role in binding of ANG to EGFR. The decreased binding of ANG-Q93A to EGFR was further validated in vivo by incubating N-EGFR-Fc with conditioned medium (CM) containing secreted ANG-WT or ANG-Q93A mutant following transfection (Figures 2E and 2F). Interestingly, the ANG-Y94A mutant was not detected in the medium after transfection as the mutation may have affected its secretion (Figure 2E). As expected, in an ANG-Q93A stable clone with reduced binding ability to EGFR, EGFR auto-phosphorylation level also decreased (Figure 2G). Together, these data indicated that Q93 of ANG is required for efficient binding and activation of EGFR. To determine whether domains I and III of EGFR ECD, which are known to bind EGF, are also required for ANG binding, we generated a deletion construct of EGFR-domain I (EGFR-Δ1; amino acids 1-165 deletion) and a critical EGF-binding EGFR domain III mutant, EGFR-D355T/F357A (Li et al., 2005; Voigt et al., 2012), and examined the binding ability EGFR for ANG (Figure 2H). The association of EGFR-Δ1 with ANG was significantly reduced, compared with that of EGFR-WT (Figure 2I). Compared with EGFR-WT, EGFR-D355T/F357A exhibited a 70% loss of binding to ANG and a complete loss of binding to EGF (Figures 2J and 2K). Together, these results suggested that EGFR domains I and III are involved in ANG binding and the epitope of ANG binding to EGFR partially overlaps with the EGF-EGFR binding region. A co-crystal structure to determine whether a direct contact exists between ANG and EGFR is important and worthwhile to be further pursued.
Figure 2. ANG binds to EGFR via Q93 and acts as a high-affinity EGFR ligand, requiring of EGFR domains I and III.
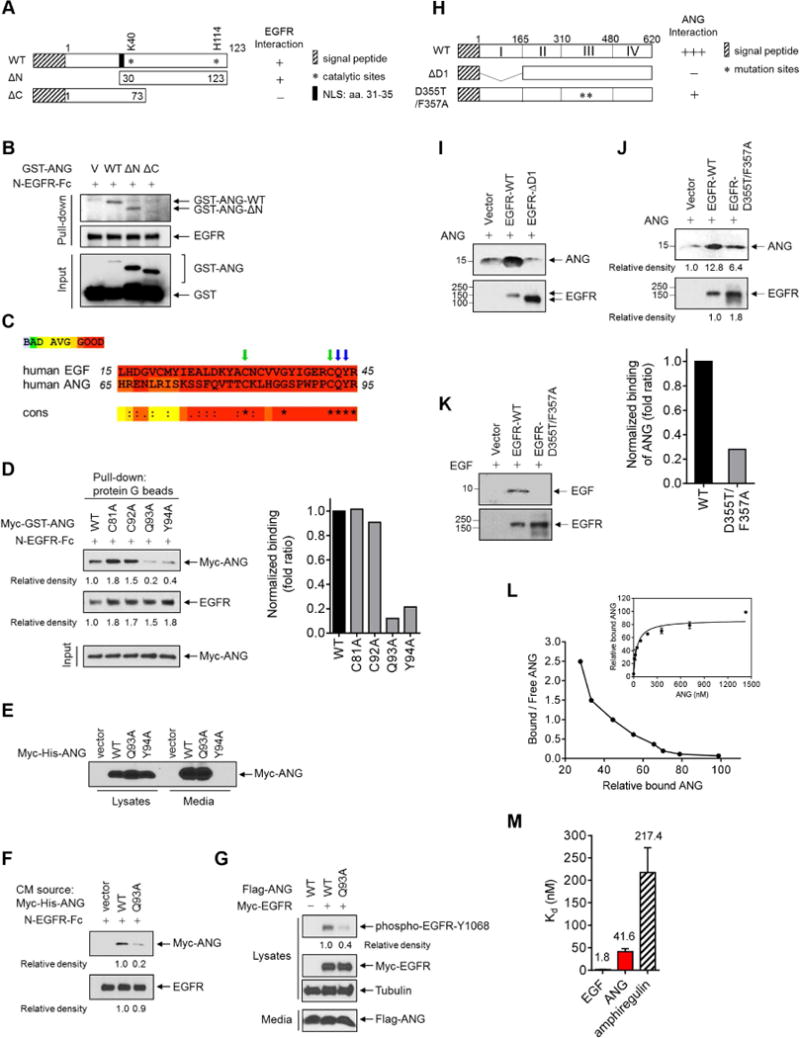
(A) Schematic diagram of wild-type (WT), N-terminal deletion (ΔN), and C-terminal deletion (ΔC) constructs of GST-ANG. The numbers represent amino acid residues. NLS, nuclear localization sequence.
(B) In vitro binding assay of N-EGFR-Fc incubated with the indicated construct. Protein G beads were used for pull-down.
(C) Sequence alignment of human ANG and human EGF. *indicates 100% identity, and colons and dots partial identity.
(D) Left, in vitro binding assay of N-EGFR-Fc with Myc-tagged ANG containing the indicated construct. Protein G beads were used for pull-down. Relative density of Myc-GST was quantified using the ImageJ software program (version 1.38×; NIH), and signals representing ANG-WT were set as 1. Right, normalized fold ratio of ANG bound to EGFR.
(E) IB of 293T cells expressing WT, Q93A, or Y94A Myc-His-ANG, or empty vector in the lysates and in the media.
(F) Binding assay of N-EGFR-Fc with the collected media from 293T cells transfected with the indicated construct. Protein G beads were used for pull-down.
(G) IB of cell lysates and secreted proteins (media) in NIH-3T3 stable transfectants expressing the indicated ANG and EGFR plasmids.
(H) Schematic diagram of wild-type (WT), domain I deletion (ΔD1), and domain III mutation (D355T/F357A) constructs of EGFR (His-EGFR-ECD). The numbers represent amino acid residues.
(I–K) In vivo binding assay of ANG (I and J) or EGF (K) incubated with the indicated EGFR constructs. His beads were used for pull-down. (J) Top, signals quantified using ImageJ. Signals representing ANG-WT were set as 1. Bottom, normalized fold ratio of ANG bound to EGFR.
(L) Scatchard plot of ANG binding to EGFR. Data transformed from Kd values determined by saturation binding assay in A431 cell lysates (right inset).
(M) Bar diagram comparing Kd values derived from ANG, EGF, and amphiregulin binding to EGFR. Each experiment was performed twice in triplicate. All error bars represent mean ± SD.
See also Figure S2.
Human ANG acts as a high-affinity EGFR ligand
To characterize the significance of the ligand-receptor relationship between ANG and EGFR, we examined the dissociation constants (Kd) of ANG binding to EGFR in comparison with known EGFR ligands, such as EGF (a high-affinity ligand) and amphiregulin (AREG, a weak-affinity ligand). The estimated Kd of EGF (1.8 nM) and AREG (217.4 nM) for EGFR were consistent with published values and that of ANG (41.6 nM) for EGFR was within the range of those in the class of high-affinity EGFR ligands, with a Kd value between 1 and 100 nM (Sanders et al., 2013) (Figures 2L and 2M). Interestingly, the binding affinity of bRNaseA to EGFR (Kd = 885.3 nM; Figure S2A) was about 21-fold less than that of ANG to EGFR, which is likely due to its non-human origin. To determine whether ANG competes with EGF for EGFR binding and vice versa, we further performed a competitive binding assay. In the presence of ANG, the affinity of EGF binding to EGFR was markedly reduced, suggesting that EGF-EGFR binding was attenuated by ANG competition (Figure S2B). Similarly, in the presence of EGF, the binding affinity of ANG for EGFR was decreased by competition (Figure S2C). Together, these results demonstrated that ANG competes with EGF for EGFR binding.
The RNase catalytic activity is not required for EGFR ligand-like function
To determine whether the intrinsic enzyme activity of RNase is required for this ligand-like function, we treated cells with secreted wild-type bRNaseA and its catalytic-deficient mutants (K41A and H119A) from the CM of both transiently transfected cells (Figures 3A–3D) and stable transfectants (Figures 3E–3G) and observed similar levels of EGFR activation and binding. To rule out the possibility of contamination with any associated proteins from cellular lysates, we utilized the purified GST-fusion proteins from bacterial lysates and compared cells treated with GST-tagged wild-type bRNaseA (GST-bRNaseA-WT) with those treated with the catalytic-deficient mutant (GST-bRNaseA-H119A). We found similar patterns of morphological changes, ZEB-1 induction, and activation of EGFR and p-Tyr (Figures 3H–3J and S3A-S3C). Consistently, wild-type ANG and its catalytic-deficient counterparts (K40A and H114A) from CM of stable transfectants exhibited comparable EGFR activation and interaction (Figures 3K–3M). Together, these results indicated that bRNaseA and ANG bind to EGFR to activate EGFR signaling independently of its catalytic activity.
Figure 3. Catalytic activity of RNase is not required for activation of and binding to EGFR.
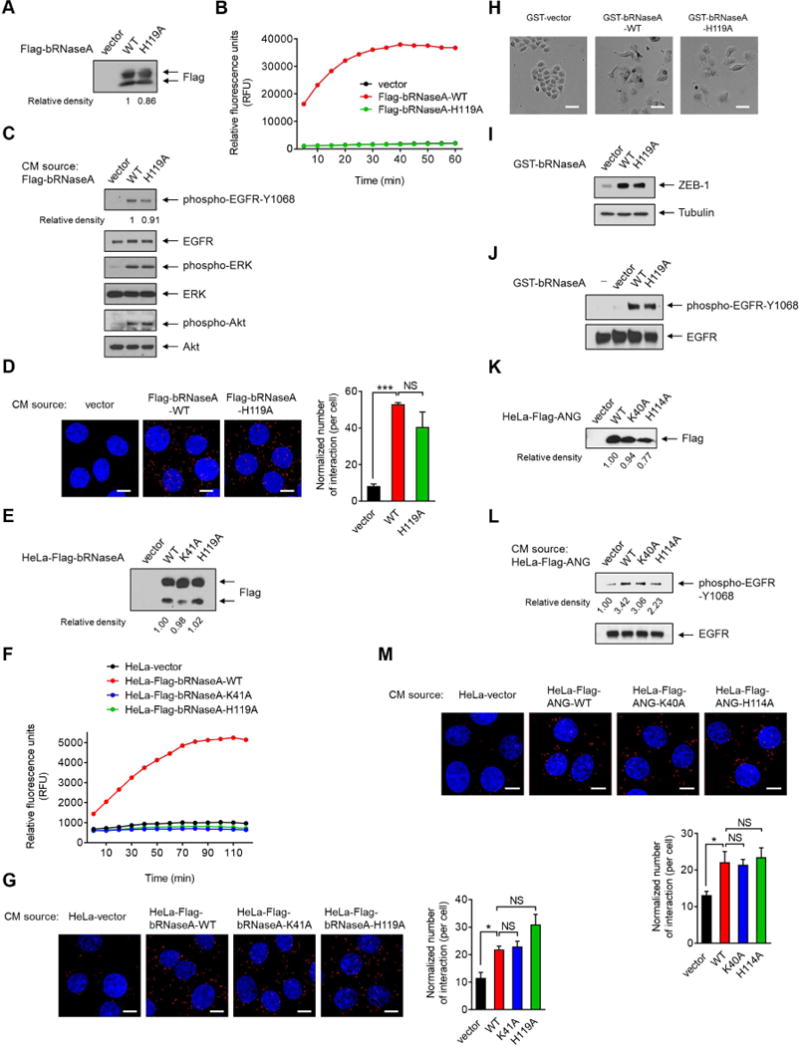
(A) IB of secreted proteins from conditioned media (CM) in HeLa cells transiently transfected with the indicated plasmids. Signals were quantified using ImageJ. Relative density of Flag-bRNaseA-WT was set as 1.
(B) Detection of RNase enzyme activity in CM-secreted proteins collected from (A). Following the addition of fluorescent substrate, the mixtures were subjected to RNaseAlert® Lab Test kit. Signals were monitored by a BioTek Synergy™ Neo real-time fluorometer.
(C) HeLa cells were treated with secreted proteins from CM as described in (A) for 5 min and subjected to IB with the indicated antibodies.
(D) HeLa cells were treated with CM-secreted proteins as described in (A) for 15 min, fixed and stained with EGFR and bRNaseA antibodies, and subjected to Duolink in situ PLA. Bar, 10 μm. Right, the number of interactions per cell normalized to the amount of the secreted proteins.
(E) IB of CM-secreted proteins in HeLa stable transfectants as indicated. Signals were quantified using ImageJ. Relative density of HeLa-Flag-bRNaseA-WT was set as 1.
(F) Detection of RNase enzyme activity in CM collected from (E).
(G) HeLa cells were treated with CM-secreted proteins as described in (E) for 15 min, fixed and stained with EGFR and Flag antibodies, and subjected to Duolink in situ PLA. Bar, 10 μm. Right, the number of interactions per cell normalized to the amount of the secreted proteins.
(H) Cell morphological changes of HeLa cells treated with the indicated proteins for 3 days. Bar, 50 μm.
(I) IB of HeLa cells lysates extracted from (H).
(J) IB of HeLa cells treated with the indicated proteins or water (−) for 5 min.
(K) IB of CM-secreted proteins in HeLa stable transfectants expressing the indicated plasmids. Signals were quantified using ImageJ. Relative density of HeLa-Flag-ANG-WT was set as 1.
(L) HeLa cells were treated with CM-secreted proteins as indicated in (K) for 5 min and subjected to IB with the indicated antibodies. These experiments were performed in duplicate.
(M) HeLa cells were treated with CM-secreted proteins as indicated in (K) for 15 min, fixed and stained with EGFR and Flag antibodies and subjected to Duolink in situ PLA. Bar, 10 μm. Bottom, the number of interactions per cell normalized to the amount of the secreted proteins.
All error bars represent mean ± SD. *p < 0.05, ***p < 0.001, Student’s t-test. NS, not significant. Data are representative of 3 independent experiments, randomly chosen in 3 different fields.
See also Figure S3.
Ligand internalization is an important cell signaling event via a receptor-mediated endocytic process (Avraham and Yarden, 2011). Similar to the results showing that bRNaseA can enter cells (Chao and Raines, 2011), we also detected increased cellular uptake of bRNaseA with increased amount of protein added to the cells (Figures S3DS3F). A 41-62% loss of bRNaseA internalization was observed after knocking down EGFR by siRNAs (Figure S3G), which strongly supported a critical role of EGFR, at least partially, in bRNaseA internalization. In addition, pretreating cells with erlotinib followed by bRNaseA treatment restricted a small portion of co-localization of EGFR and bRNaseA to the cell membrane (Figure S3H; yellow signals/arrows in the merged inset) whereas most of bRNaseA signals (red) were still internalized. These results suggested that certain pathways other than EGFR endocytosis by clathrin-coated pits exist for bRNaseA internalization, consistent with a previous report (Chao and Raines, 2011).
ANG induces in vivo tumorigenesis dependent on EGFR kinase activity
To validate the biological activity of this ANG-EGFR ligand-receptor interaction in vivo, we utilized the NIH-3T3 model system lacking intrinsic EGFR expression, in which both ectopic expression of EGFR and its cognate ligand EGF are required for accelerated cell growth and tumorigenesis (Di Fiore et al., 1987). We established NIH-3T3 stable clones, including those ectopically expressing ANG, wild-type EGFR (EGFR WT), or kinase-dead mutant EGFR (EGFR KD) alone, and ANG combined with EGFR WT or EGFR KD (Figure 4A), and then compared their growth rate by cell number and tumor formation capability. Cell number was significantly higher in cells expressing ANG and EGFR WT compared with those expressing ANG or EGFR WT alone or those expressing both EGFR KD and ANG (Figures 4B and 4C). Tumor growth in mice injected with cells expressing ANG combined with EGFR WT was much more aggressive than in those with cells expressing either ANG or EGFR WT alone or ANG with EGFR KD (Figure 4D). Activation of the ANG-EGFR axis rendered tumors more sensitive to erlotinib treatment (Figure 4E). Together with the additional evidence showing that ANG induced cell viability (Figure S4A), these results supported ANG as a bona fide EGFR ligand that promotes in vivo tumorigenesis, requiring EGFR kinase activity. Notably, we estimated that about 10% of ANG was localized in the cells (Figure S4B), likely due to protein biogenesis and internalization in an autocrine manner via EGFR, which was supported by a positive correlation between ANG levels in tumor tissues and their matched plasma (Figure S4C p = 0.03). Moreover, cytoplasmic ribonuclease/angiogenin inhibitor 1 has been reported to associate with and inactivate intracellular ANG to prevent random cleavage of cellular RNA (Pizzo et al., 2013), suggesting that the role of intracellular ANG is not attributed to the RNase catalytic activity.
Figure 4. ANG triggers EGFR kinase activity-dependent in vivo tumorigenesis.
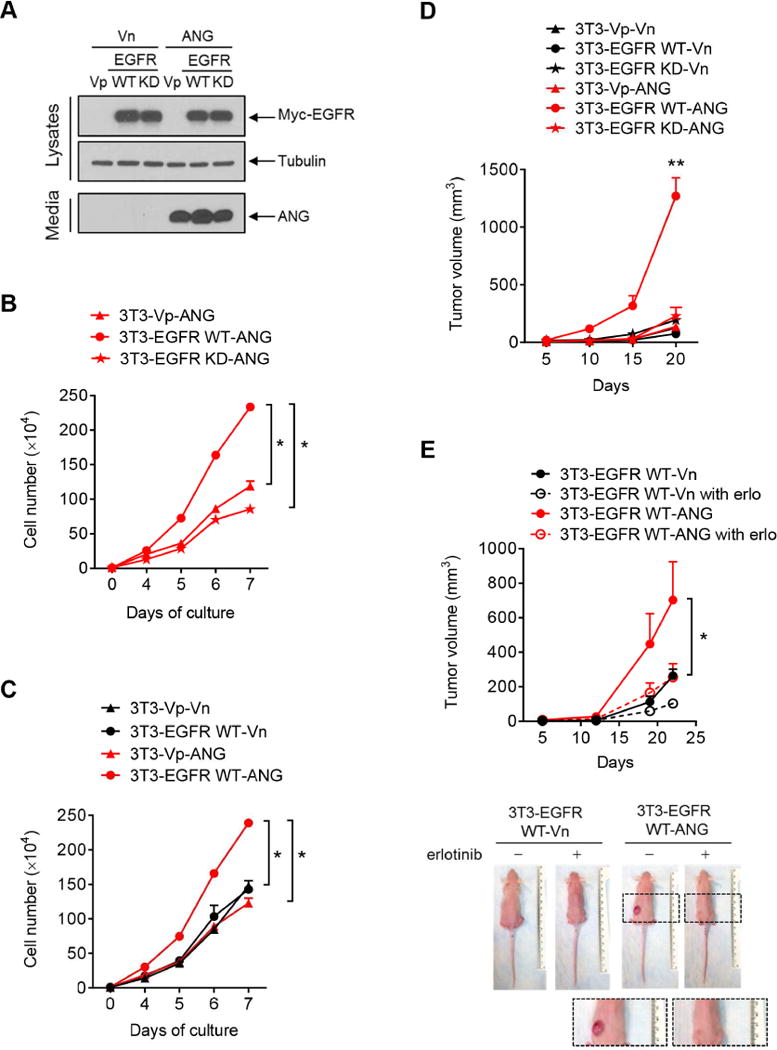
(A) IB of lysates and secreted proteins from CM in NIH-3T3 stable transfectants expressing the indicated plasmids. Vp, puromycin-resistant vector; Vn, neomycin-resistant vector.
(B and C) The numbers of 3T3 stable cells were counted at the indicated time points. Each experiment was performed twice in triplicate.
(D) Tumor growth of mice subcutaneously injected with 3T3 stable cell lines at the indicated time points. n = 5 mice per group.
(E) Tumor growth of mice subcutaneously injected with 3T3 stable cell lines at the indicated time points, followed by treatment with or without erlotinib. n = 5 mice per group. Representative images are shown below.
All error bars represent mean ± SD. *p < 0.05, **p < 0.01, Student’s t-test. NS, not significant.
See also Figure S4.
The level of ANG is elevated in plasma samples from both pancreatic cancer patients and iKras; Trp53L/+ mice
Higher serum ANG expression is correlated with poorer survival in pancreatic cancer (Shimoyama et al., 1996), and EGFR plays a pivotal role in PDAC tumorigenesis (Ardito et al., 2012; Navas et al., 2012). Hence, we investigated the potential role of the ANG-EGFR axis in pancreatic cancer development. We first re-evaluated RNase expression in blood samples (plasma) from pancreatic cancer patients for comparison with samples from normal individuals (Table S1). Consistent with the previous report (Shimoyama et al., 1996), analysis of two independent experiments indicated a significant increase in plasma ANG levels in the cancer group (p= 0.014; p = 0.011) compared with the normal group (Figures 5A and S5A). The mean concentrations of plasma hRNase1 between the normal and cancer groups were not significantly different (p = 0.83; p = 0.45) (Figures S5B and S5C). It is worth mentioning that there were no significant differences in levels of traditional EGFR ligands, EGF and TGF-α, between these two groups; the mean concentrations in patients were 3 orders of magnitude lower than that of plasma ANG (Figures 5B and S5D Table S1). Together, the results suggested that ANG but not hRNase1 is expressed in and may be related to human pancreatic cancer. To investigate whether ANG is detectable in the plasma during PDAC development, we utilized a doxycycline (Dox) inducible KrasG12D-driven (iKras;Trp53L/+) PDAC mouse model (Ying et al., 2012) to measure ANG levels. Similar to the results observed in human PDAC samples (Figure 5A), the levels of plasma ANG were also higher in iKras;Trp53L/+ mice than in littermate controls starting from the 2nd week after Dox induction. No significant differences in ANG levels between the two groups during the 1st week on Dox were observed for the time point prior to PanIN lesions (Figure 5C). The ANG levels were further reduced after Kras inactivation by 3 weeks of Dox withdrawal (Figure S5E). We speculated that such tumor shrinkage after 1 week of Dox withdrawal (Ying et al., 2012) likely resulted in ANG decline. Notably, elevated ANG levels at 3 weeks on Dox in iKras;Trp53L/+ mice were decreased significantly after erlotinib treatment (Figure 5D). Altogether, these results supported a critical role of ANG-EGFR axis in pancreatic cancer.
Figure 5. ANG level is elevated in plasma samples from pancreatic cancer patients and PDAC mouse model.
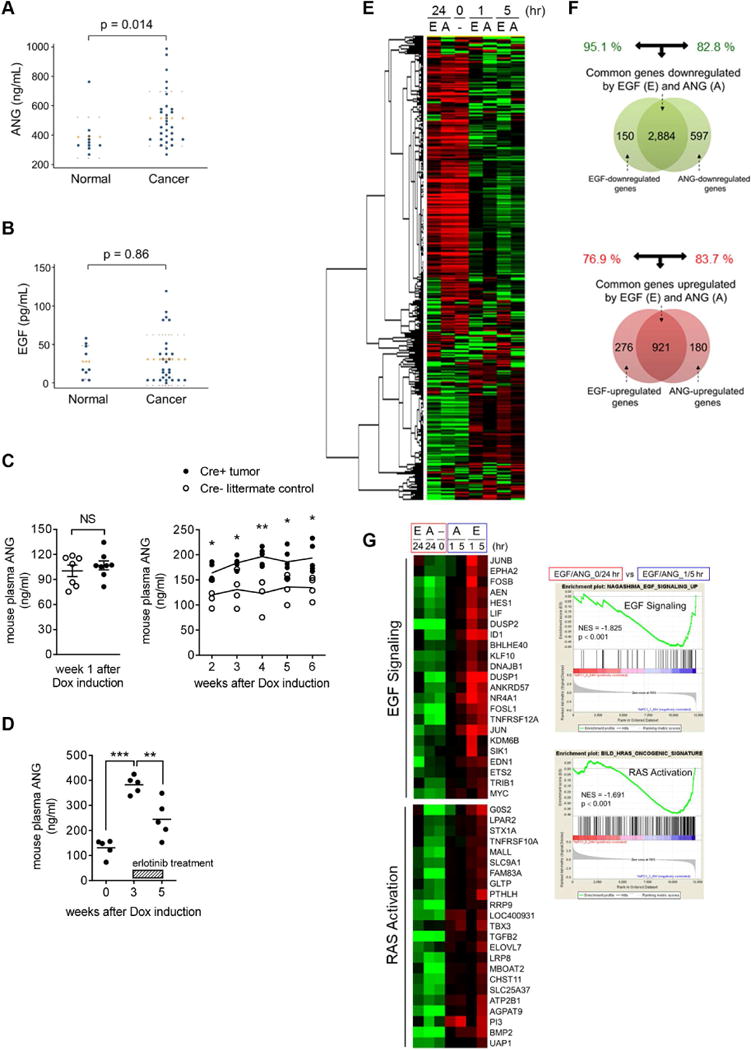
(A and B) Enzyme-linked immunosorbent assay (ELISA) in plasma samples of pancreatic cancer patients for comparison with a normal control group of ANG (A; n = 30 vs. n = 10) and EGF (B; n = 28 vs. n = 9). Error bars (dotted lines) represent mean ± SD.
(C) ELISA of ANG level in plasma samples of iKras;Trp53L/+ PDAC mice (Cre+ tumor) for comparison with the Cre− littermate controls. Left, error bars represent mean ± SD, Student’s t-test. NS, not significant. Right, lines represent the mean. *p < 0.05, **p < 0.01, Multiple t-tests.
(D) ELISA of ANG level in plasma samples of iKras;Trp53L/+ PDAC mice (Cre+ tumor), followed by erlotinib treatment (50 mg/kg/day). The lines represent the mean. **p < 0.01, ***p < 0.001, Student’s t-test.
(E) Heat map of the top 5,000 genes expressed in AsPC-1 cells under A (ANG) and E (EGF) treatment.
(F) Venn diagram highlighting the similarities and differences in genes that are significantly downregulated (top) and upregulated (bottom) by ANG and EGF treatment for the 1 hr or 5 hr cluster in AsPC-1 cells.
(G) Left, heat maps showing the expression of genes in EGF signaling and RAS activation under EGF and ANG treatment at the indicated time points in AsPC-1 cells. Right, representative GSEA results showing the activated signaling pathways under EGF and ANG treatment (1/5-hr cluster vs. 0/24-hr cluster). NES, normalized enrichment score.
Whole transcriptome analysis of ANG and EGF treatment reveals a globally similar pattern of transcriptional changes
To gain further mechanistic insights into the role of ANG as an EGFR ligand, whole-transcriptome analysis was performed by deep sequencing of RNAs extracted from AsPC-1 pancreatic cancer cells. A high similarity in transcriptome changes was observed between EGF and ANG treatment (Figure 5E) such that a common set of genes was upregulated or downregulated by both EGF and ANG at 1 and 5 hr after treatment. By 24 hr after treatment, most changes were largely reversed. Venn diagram analysis of the affected genes indicated a high percentage of overlap (~80%) between ANG and EGF treatment, suggesting that ANG resembles EGF in modulating cellular functions (Figure 5F and Table S2). Gene Set Enrichment Analysis (GSEA) further showed that both EGF and ANG activated the EGF signaling pathway at 1 and 5 hr after treatment. Both stimuli also activated RAS signaling as indicated by the increase in RAS gene expression signature (Figure 5G). Other genes, such as those in response to hypoxia-inducible factor 1α (HIF1α) or interleukin-1α (IL-1α), were also activated by both stimuli (Figure S5F). All of these results indicated that ANG elicits signaling events that are similar to EGF to control gene transcription in pancreatic cancer cells.
Pathological relevance between ANG expression level and EGFR activation in human pancreatic tissue microarray and iKras;Trp53L/+ mice
To further address the pathological relevance between EGFR activation and ANG expression in pancreatic cancer, we performed a human pancreatic tumor tissue microarray analysis with results indicating a positive association between the level of phospho-EGFR-Y1068, representing EGFR activation, and ANG expression (p = 0.03; Figure 6A) with relatively low degree of intratumor heterogeneity. A similar positive association (p = 0.001; Figure 6B) was observed in an additional cohort using an established tissue microarray from patient-derived xenograft tumors (Roife et al., 2016). Interestingly, in addition to tumor cells, we also detected positive signals representing ANG in fibroblasts, macrophages, and endothelial cells, but not in lymphocytes or normal pancreas (Figure S6A). Analysis of tumor tissues from iKras;Trp53L/+ mice also indicated a pathological relevance between mouse ANG and EGFR activation with relatively low level of intratumor heterogeneity (Figure 6C). In this iKras;Trp53L/+ PDAC mouse model, Dox induction induces acinar-to-ductal metaplasia and PanIN lesions within 2 weeks (Ying et al., 2012). Our results showed that the levels of plasma ANG (Figure 5C) and tissue ANG (Figure 6C) in iKras;Trp53L/+ mice correlated well with the tumor growth starting from the 2nd week after Dox induction. Thus, the increased ANG occurred during the early stage of PDAC and was not related to tumor stage, consistent with the previous findings in human serum samples (Shimoyama et al., 1996).
Figure 6. Pathological relevance of ANG expression and EGFR activation in pancreatic cancer.
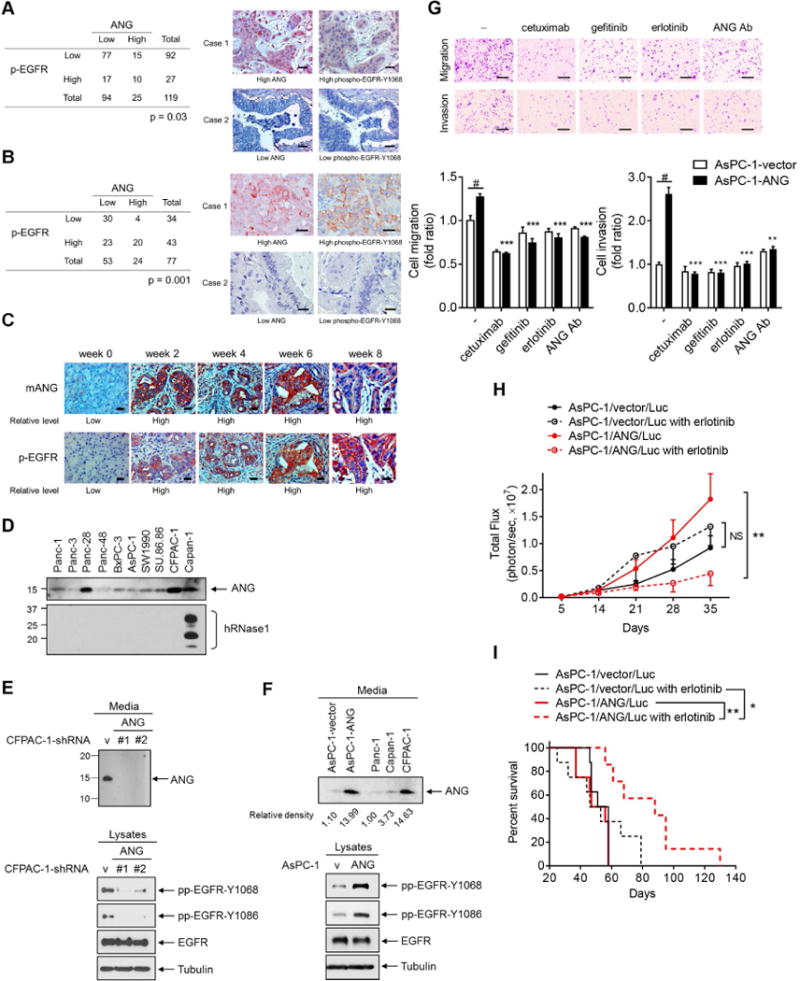
(A and B) Quantification and two representative cases of immunohistochemical staining for the correlation between ANG and phospho-EGFR-Y1068 (p-EGFR) using human pancreatic tumor tissue microarray analysis (A) or an established pancreatic cancer tissue microarray from patient-derived xenograft tumors (B). Bar, 50 μm. Cases with Histoscore higher than average were considered as high expression and those with H-score equal to or less than average as low expression. Fisher’s exact test.
(C) Immunohistochemical staining of sections from iKras;Trp53L/+ PDAC mice treated with doxycycline for the indicated weeks with antibodies against ANG and p-EGFR. Bar, 50 μm.
(D) Analysis of the expression level of ANG and hRNase1 proteins secreted in pancreatic cancer cells.
(E and F) IB of secreted proteins from CM (top) and cell lysates (bottom) in CFPAC-1 stable transfectants with ANG knockdown (CFPAC-1-sh-ANG #1 and CFPAC-1-sh-ANG #2) and empty vector (CFPAC-1-sh-vector) (E); in AsPC-1 stable transfectants expressing ANG (AsPC-1-ANG) and empty vector (AsPC-1-vector), compared with those in other pancreatic cancer cell lines (F).
(G) Representative images of cell migration and invasion assays of AsPC-1 stable transfectants expressing ANG (AsPC-1-ANG) treated with cetuximab, gefitinib, erlotinib, or an ANG neutralization antibody (ANG Ab; 5 μg/ml). Bar, 500 μm. Quantification is shown below. Data represent 3 independent experiments in duplicate. Error bars represent mean ± SD. **p < 0.01, ***p < 0.001, compared with the ratio in AsPC-1-ANG cells without treatment, Student’s t-test. #p < 0.001, compared with the fold ratio between AsPC-1-vector and AsPC-1-ANG cells without treatment, Student’s t-test.
(H) Luciferase activity representing tumor volume by in vivo imaging. Mice were orthotopically injected with the indicated pancreatic cancer cell lines followed by erlotinib treatment. Error bars represent mean ± SD. n = 8 per group except for the AsPC-1/ANG/Luc with erlotinib group (n = 7). **p < 0.01, NS, not significant, ANOVA analysis.
(I) Survival analysis of the indicated groups in (H). *p < 0.05, **p < 0.01, Log-rank (Mantel-Cox) test.
See also Figure S6.
EGFR activation is responsible for ANG-triggered oncogenic functions
To determine whether EGFR activation mediates ANG-triggered oncogenic functions in pancreatic cancer, we first screened a panel of 10 pancreatic cancer cell lines to measure levels of secreted ANG and hRNase1. Most cells secreted various levels of ANG whereas hRNase1 was detected only in Capan-1 cells (Figures 6D and S6B). ANG was knocked down by individual small hairpin RNA (shRNA) targeting ANG in CFPAC-1 cells, which secrete relatively higher levels of ANG compared with the other cells. Cells that exhibited successful ANG knockdown demonstrated decreased EGFR phosphorylation without changes in total EGFR expression (Figure 6E). We also generated AsPC-1 stable transfectants ectopically expressing ANG (AsPC-1-ANG) at a level comparable to CFPAC-1 cells (Figures 6F and S6C) for comparison. ANG-expressing stable AsPC-1 cells exhibited higher levels of EGFR phosphorylation than vector control (Figure 6F) and enhanced cell migration and invasion, which can be repressed by pretreating cells with cetuximab, gefitinib, erlotinib, or an ANG neutralizing antibody (ANG Ab) (Figures 6G and S6D for Panc-1). To validate these results in vivo, we orthotopically injected AsPC-1/ANG/Luc or AsPC-1/vector/Luc stable cells into mice and then treated the mice with or without erlotinib. Mice injected with AsPC-1/ANG/Luc cells developed larger tumors than those injected with vector cells but were much more sensitive to erlotinib treatment such that tumor suppression was more effective even when the tumor size was larger (Figure 6H) and exhibited significantly better survival than the control group (Figure 6I). These results suggested that activation of EGFR by ANG rendered cells more sensitive to EGFR-TKI.
Knockdown of ANG decreases sensitivity to erlotinib treatment
Analogous to the EGFR-activating mutations in lung cancer patients, identifying PDAC addicted to EGFR activation, and thus sensitive to EGFR-TKI, could be a key to EGFR-TKI response. To this end, we evaluated the ANG-induced tumorigenesis involving EGFR activation in response to an approved EGFR-TKI erlotinib (Moore et al., 2007). We established an ANG-knockdown system by individual shRNA targeting ANG in HPAC-1 and CFPAC-1 pancreatic cancer cells (Figures 6E and 7A). Both HPAC-1 and CFPAC-1 are sensitive to erlotinib treatment (Buck et al., 2006). Knockdown of ANG successfully impeded colony formation, and cell viability, growth, and mobility compared with vector control cells (Figures 7B, S7A, and S7B. More strikingly, the size of tumor in mice injected with ANG-knockdown cells decreased more substantially compared with those with vector control (see later in Figures 7I, 7J, S7M). These results suggested an oncogenic role of ANG in PDAC, which was further validated by the reconstitution of ANG (Flag-ANG) in the HPAC-1-sh-ANG and CFPAC-1-sh-ANG clones, showing restored cell viability, colony formation, and tumor weight (Figures 7C, 7D, and S7C-S7F). Consistently, ANG Ab significantly decreased the viability of HPAC-1 and CFPAC-1 cells as well as two PDAC cells (MDA-PATC50 and MDA-PATC53) established from the patient-derived tumor xenografts (Kang et al., 2015) (Figures S7G and S7H). Furthermore, the tumor volume decreased significantly after ANG Ab treatment compared with PBS or mIgG in two PDAC mouse models (Figures 7E and S7I). In addition, immunohistochemistry staining of HPAC-1 tumors showed inhibition of EGFR phosphorylation and acceleration of apoptosis as evidenced by the increased levels of caspase 3 activation (cleaved caspase 3) after ANG Ab treatment compared with PBS or mIgG (Figure S7J). These results further validated the contribution of ANG to PDAC tumorigenicity.
Figure 7. Knockdown of ANG decreases sensitivity to erlotinib treatment in pancreatic cancer cells.
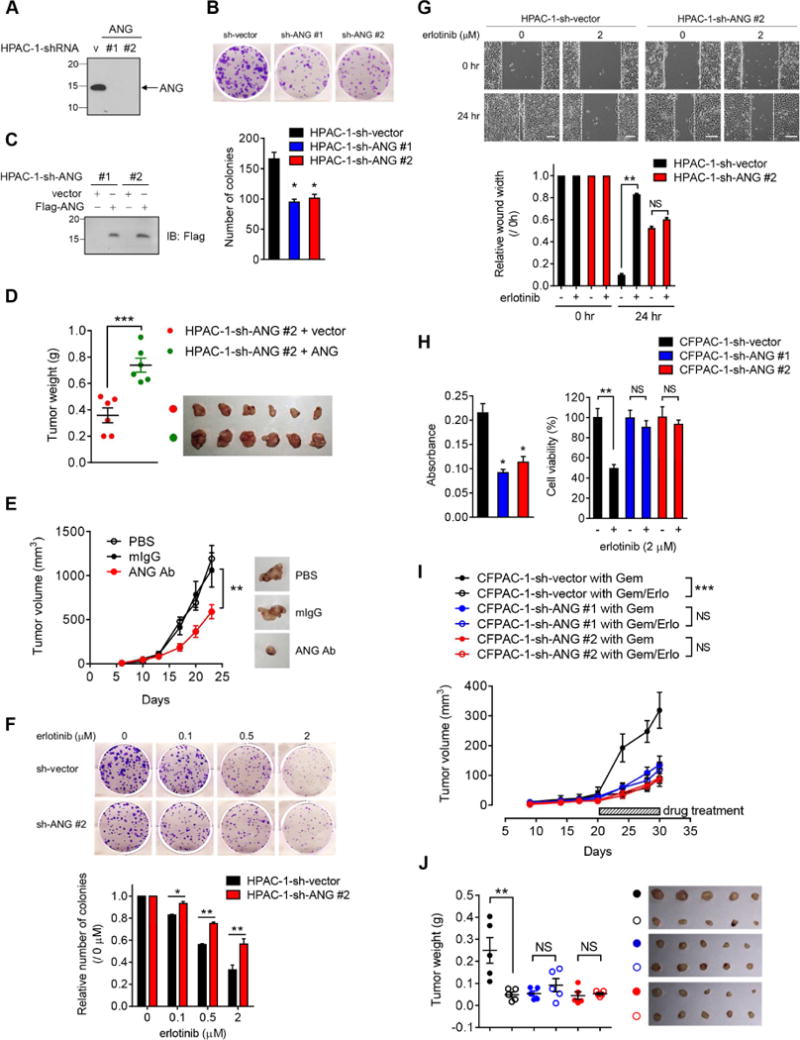
(A) IB of secreted proteins in HPAC-1 stable transfectants with ANG knockdown (HPAC-1-sh-ANG #1 and HPAC-1-sh-ANG #2) and empty vector (HPAC-1-sh-vector).
(B) Top, representative images of colony formation capability of HPAC-1 stable transfectants in 6-well plates at day 10. Bottom, quantification of colony formation capability. Each experiment was performed three times in duplicate.
(C) IB of the reconstitution of ANG (Flag-ANG) to restore expression in two independent HPAC-1-sh-ANG stable clones.
(D) Tumor weight analysis of the indicated groups in (C). n = 6 mice per group. Lines represent mean ± SD.
(E) Tumor growth of mice subcutaneously injected with HPAC-1 cells followed by treatment with PBS, mouse IgG (mIgG), or ANG Ab. Representative images shown. n = 6 mice per group.
(F) Top, representative images of colony formation capability of HPAC-1 stable transfectants treated with increasing concentrations of erlotinib in 6-well plates at day 10. Bottom, quantification of colony formation capability. Each experiment was performed three times in duplicate. The number of colonies at the indicated erlotinib concentration was normalized against that without erlotinib treatment (0 μM).
(G) Top, representative images of wound healing assay of HPAC-1 stable ransfectants treated with or without erlotinib for 24 hr. Bar, 500 μm. The distance of the wound gaps was determined using ImageJ. Wound width normalized against that at time 0 is shown in the plot.
(H) Cell viability of CFPAC-1 stable transfectants measured by MTT assay. Left, absorbance was measured at 595 nm with a reference wavelength of 650 nm. Quantification of MTT viability assay of CFPAC-1 stable transfectants treated with or without erlotinib (2 μM) for 72 hr. The percentage of cell viability in CFPAC-1 stable transfectant with erlotinib treatment was normalized against that without erlotinib treatment.
(I) Tumor growth of mice subcutaneously injected with the indicated CFPAC-1 cells followed by treatment with gemcitabine plus either erlotinib (Gem/Erlo) or a matched vehicle (Gem). n = 5 mice per group.
(J) Tumor weight analysis of the indicated groups in (I). n = 5 mice per group. Lines represent mean ± SD.
All error bars represent mean ± SD. *p < 0.05, **p < 0.01, ***p < 0.001, NS, not significant, Student’s t-test. Tumor growth was evaluated by ANOVA analysis, **p < 0.01, ***p < 0.001, NS, not significant.
See also Figure S7.
Knocking down ANG decreased sensitivity to erlotinib treatment and maintained colony formation, and cell viability and mobility (Figures 7F–7H, S7K, and S7L). Notably, the effects of ANG-induced activation of EGFR rendered PDAC cells highly sensitive to gemcitabine/erlotinib treatment compared with gemcitabine alone in both CFPAC-1 and HPAC-1 cells in vivo (Figures 7I, 7J, and S7M), suggesting that ANG plays a role in erlotinib sensitivity in pancreatic cancer. Consistent with the in vivo data (Figures 7J and S7M), immunohistochemistry staining of tumors showed that the inhibitory ratio of EGFR phosphorylation was lower in ANG knockdown cells compared with the vector control cells after erlotinib treatment (Figures S7N and S7O). Notably, erlotinib treatment accelerated apoptosis as indicated by the increased cleaved caspase 3 and end-labeled fragmented DNA using the TUNEL in vector control cells compared to that without treatment (Figures S7N and S7O, first and second column). In contrast, erlotinib treatment did not significantly increase the number of apoptotic cells in ANG knockdown cells compared to that without treatment (Figures S7N and S7O, third and fourth column). These results suggested that the enhanced apoptosis is partially attributed to ANG-induced erlotinib sensitivity. We further validated ANG-enhanced erlotinib sensitivity in a 19636 mouse cell line from a p48Cre+;LSL-KrasL/+;Trp53L/+ model in B6 background by knocking down mAng1, a murine homologue of ANG, by individual shRNA (Figure S7P). Consistently, efficient knockdown of mAng1 decreased sensitivity to erlotinib treatment and maintained cell viability in vitro (Figure S7Q). Moreover, B6 mice injected with 19636-sh-mAng1 #2 cells exhibited better survival than the control group (Figure S7R; median, 26.5 days vs. 17.5 days) but were less sensitive to either erlotinib or gemcitabine/erlotinib treatment, suggesting that mAng1 indeed plays a role in the overall survival and erlotinib sensitivity in PDAC mice model.
To address the off-target effects of erlotinib, we examined viability of CFPAC-1 cells (Figures S7S and S7T) using two additional EGFR-TKIs, AG1478 and gefitinib. Similar to the above findings, CFPAC-1 ANG knockdown cells exhibited significantly decreased sensitivity to AG1478 and gefitinib, and maintained the viability, suggesting that ANG-mediated EGFR activation indeed regulates erlotinib response in pancreatic cancer cells.
Higher levels of plasma ANG render PDAC patients more sensitive to erlotinib in a small cohort of patients
In addition to ANG mRNA and serum levels (Shimoyama et al., 1996), high ANG protein expression in pancreatic tumor tissues also correlated with poorer outcome (Figure 8A). Our results demonstrating the elevated ANG in pancreatic cancer raised a question of whether ANG has the potential to serve as a predictive biomarker and to be utilized to identify the most responsive patient group to EGFR-targeted therapies, similar to EGFR-activating mutations in lung cancer. This oncogenic addiction effect was further demonstrated in patient plasma samples (Figures 8B–8F). Among the patients who received erlotinib (n = 45) and those did not receive erlotinib (n = 25) for which no significant differences were found in the mean concentration of ANG (Figure S8A), an estimated hazard ratio (HR) of 0.74 was shown for the overall survival without any biomarkers between the erlotinib and non-erlotinib arms (p = 0.245; Figure 8B). This result represents a 26% reduction in the risk of death, which supports the beneficial effects of erlotinib (Moore et al., 2007). We next evaluated the ANG concentrations in patients (n = 70) and divided them into high- or low-ANG group using the median value as optimal cutoff (434.2 ng/ml). Notably, in patients with high (> 434.2 ng/ml) levels of ANG, the addition of erlotinib treatment resulted in a decline in HR from 0.74 to 0.49, representing a statistically significant reduction in the risk of death from 26% to 51% (Figure 8C; p = 0.030; median, 9.5 months for erlotinib vs. 5.6 months for non-erlotinib). Of interest, among patients with low (< 434.2 ng/ml) levels of ANG, erlotinib therapy led to shorter survival compared with those who did not receive erlotinib treatment (Figure 8D; p = 0.163; median, 7.0 months for erlotinib vs. 11.3 months for non-erlotinib; HR, 1.67). These opposing results using ANG as a predictive biomarker may provide an explanation for the limited benefit of erlotinib/gemcitabine therapy previously reported without any biomarkers to stratify patients (Moore et al., 2007). Our findings were further demonstrated in patient plasma samples in which patients with high levels of ANG responded better to erlotinib treatment than those with low levels of ANG in two independent cohorts of erlotinib-treated patients (Figure 8E; p = 0.036; Figure S8B; p = 0.029). In contrast, patients with high levels of ANG subgroup who did not receive erlotinib treatment had poorer outcome (Figure 8F). Such effects were not observed for EGF or TGF-α (Figures S8C and S8D). Using the mean value (441.3 ng/ml) as cutoff to divide patients into high- or low-ANG group based on their ANG concentrations, we observed similar results (Figures S8E-S8H). These results strongly suggested that higher levels of plasma ANG rendered PDAC more sensitive to EGFR-TKI, likely due to the oncogenic addiction effects, and that ANGhigh status has the potential to serve as an effective biomarker to predict erlotinib response in pancreatic cancer patients.
Figure 8. ANG enhances sensitivity to erlotinib treatment in pancreatic cancer.
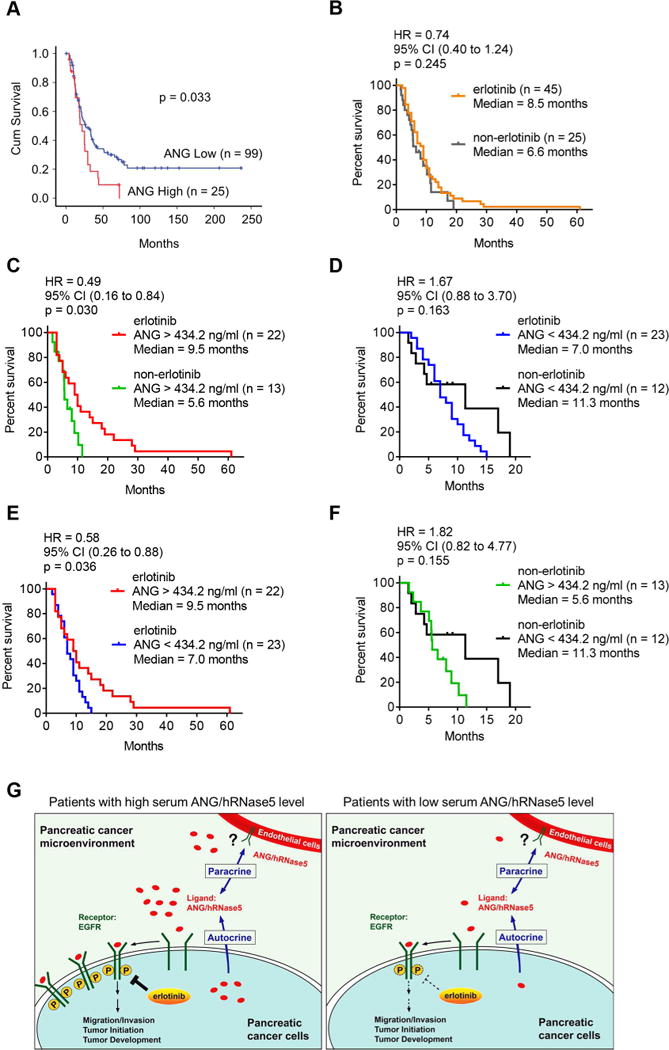
(A) Kaplan-Meier overall survival analysis for human pancreatic tumor tissue microarray in the indicated groups with different ANG levels.
(B) Log-rank (Mantel-Cox) test for overall survival of pancreatic cancer patients who received therapy with (erlotinib) or without erlotinib (non-erlotinib). Hazard Ratio (HR) and 95% CI were determined by Log-rank analysis.
(C and D) Log-rank (Mantel-Cox) test for overall survival of pancreatic cancer patients harboring higher levels of ANG with or without erlotinib therapy (C); lower levels of ANG with or without erlotinib therapy (D). HR (95% CI), Log-rank analysis.
(E and F) Log-rank (Mantel-Cox) test for overall survival of pancreatic cancer patients who received therapy with (E) or without (F) erlotinib in the indicated groups with different levels of ANG. Cohort size for each group is indicated. HR (95% CI), Log-rank analysis.
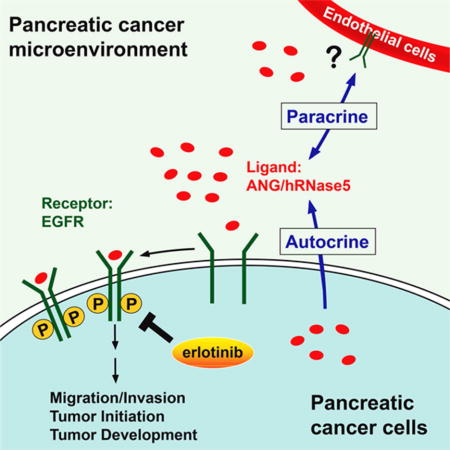
(G) The proposed model of elevated ANG as an EGFR ligand in the sensitization to erlotinib therapy in pancreatic cancer. In brief, higher levels of ANG induces its binding to EGFR and activates EGFR signaling, which in turn promotes tumorigenesis and increases erlotinib sensitivity in PDAC patients.
See also Figure S8.
ANG expression is critically driven via the PTEN/PI3K/Akt activating pathway
Next, we asked whether the major EGFR/KRAS activating pathways, such as PI3K/Akt and RAF/MEK/ERK, are involved in the regulation and mechanism of ANG expression in PDAC. To this end, we treated CFPAC-1 cells with various inhibitors of KRAS downstream pathways, including PI3K (GDC-0941), Akt (MK-2206), and MEK (GSK1120212; PD-0325901). We found that the activating pathway PI3K/Akt, but not MEK/ERK, positively regulated ANG expression (Figure S8I). In addition, alteration of the PTEN/PI3K/Akt pathway is a common event in PDAC development and functions (Ying et al., 2011). We knocked down PTEN by individual shRNA in Panc-1 and HeLa cells, and found that successful PTEN loss and subsequent Akt activation increased ANG levels (Figures S8J and S8K). Together, we demonstrated that the PTEN/PI3K/Akt activating signaling plays a critical role in driving ANG expression in tumor cells.
We then asked whether KRAS is necessary for the increased expression of ANG. Interestingly, ANG levels were not significantly affected when we depleted KRAS by a siRNA knockdown in HPAC-1 and CFPAC-1 cells compared with control cells (Figures S8L and S8M). Similar levels of ANG were also observed in HeLa cells ectopically expressing KRAS WT and KRAS G12D (Figure S8N). Together with the lack of significant clinical correlation between ANG/p-EGFR expression and KRAS status (p = 0.786; Figure S8O), these results suggested that wild-type or mutant KRAS is not directly involved in ANG expression or the ANG-EGFR axis in PDAC patients. This was also supported by our data showing various levels of ANG secreted in a panel of 10 PDAC cell lines which all harbor activated KRAS mutations (Figure 6D).
DISCUSSION
On the basis of our findings, we present a model (Figure 8G) showing that higher levels of ANG observed in the pancreatic cancer microenvironment induces its binding to EGFR and activates EGFR signaling in an autocrine or paracrine manner, which in turn promotes tumorigenesis and increases erlotinib sensitivity. ANG increases endothelial cell migration and proliferation by initiating intracellular signaling pathways, such as PLCγ, Akt, and ERK (Gao and Xu, 2008). After entry into recipient cells via endocytosis, ANG translocates into the nucleus and increases rRNA transcription (Ibaragi et al., 2009). Both α-actin and a putative 170-kDa cell surface receptor from endothelial cells were reported to bind to ANG (Hu et al., 1997; Hu et al., 1993). This 170-kDa membrane receptor was thought to mediate ANG-induced signal transduction and angiogenic function. Tumor-associated endothelial cells express high levels of EGFR, and EGFR signaling is required for their proliferation and angiogenesis (Amin et al., 2006). Thus, it is conceivable that the 170-kDa membrane receptor from endothelial cells may be EGFR as it is also a 170-kDa protein, especially following the identification of the ANG-EGFR signaling axis in the current study. If so, secretory ANG from endothelial cells may bind to EGFR and trigger EGFR signaling in tumor-associated endothelial cells to form autocrine stimulation similar to what we demonstrated in PDAC cells in the current study. In addition, ANG can originate from stroma cells, including endothelial cells and fibroblasts (Kishimoto et al., 2005), and may also stimulate tumor-associated EGFR signaling in a paracrine manner. These findings provided a mechanistic insight into the interplay between ANG and EGFR in the modulation of PDAC microenvironment. Because ANG has been implicated in colorectal and lung cancers (Etoh et al., 2000; Yuan et al., 2009) and EGFR is well established in the etiology of these two cancer types, it would be of interest to further determine whether the ANG-EGFR axis also exists in other tumor types.
The current findings reveal ANG-EGFR as a ligand-receptor pair between the RNase and RTK family. In this regard, we speculated that other members of the human RNase A superfamily may have similar functions, serving as ligands for membrane receptors in addition to their conventional roles as ribonucleases in host immunity. In particular, ANG exhibits extremely weak RNase enzymatic activity, and human RNases 9-13, which were recently reported as non-canonical members of the human RNase A superfamily, do not harbor RNase activities (Sorrentino, 2010). Because we demonstrated ANG acts as an EGFR ligand independently of its enzymatic activity, it is worthwhile to determine whether other catalytic-deficient RNases may also have non-canonical functions as an RTK ligand. A systematic study will be required to evaluate the potential ligand-like roles of other RNases.
It is worthwhile to note that another EGFR-directed clinical trial (SWOGS0205) testing the EGFR monoclonal antibody, cetuximab, did not improve the outcome compared with patients treated with gemcitabine alone (Philip et al., 2010). As pancreatic cancer is known to progress rapidly, it is critical to identify any predictive biomarkers to increase treatment efficacy. In summary, our results provided insights into the ligand-receptor relationship between RTK and RNase families in intracellular signal transduction. Moreover, the pathological relevance between EGFR and secretory RNase in pancreatic cancer cells may have important clinical implications. The level of plasma ANG has the potential to serve as a non-invasive serum biomarker to predict response to treatment of EGFR inhibitors and to stratify pancreatic cancer patients, particularly those with ANGhigh-EGFR+ disease, for erlotinib therapy.
STAR Methods
Contact for Reagent and Resource Sharing
Further information and requests for resources and reagents should be directed to and will be fulfilled by the Lead Contact, Mien-Chie Hung (mhung@mdanderson.org).
Experimental Model and Subject Details
Cell culture and treatment
Cells purchased from the American Type Culture Collection were maintained in Dulbecco’s modified Eagle’s medium (DMEM)/F12 or RPMI 1640 medium (for pancreatic cancer cell lines) supplemented with 10% fetal bovine serum and antibiotics. Pancreatic cancer cell lines were kindly provided by Dr. Craig Logsdon (SW1990, SU.86.86) and Dr. Paul Chiao (CFPAC-1) at MD Anderson Cancer Center. Mycoplasma testing has been performed in all cell lines. Unless specified otherwise, cells were treated with bRNaseA and ANG at a concentration of 100 μg/ml in serum-starved conditions for 24 hr and at a concentration of 1 μg/ml in serum-starved conditions 6 hr, respectively. The experimental condition of treatment with hRNase1 was similar to that with ANG. The concentrations used in the in vitro experiments of cetuximab, gefitinib, erlotinib are 10 μg/ml, 10 μM, and 10 μM, respectively, unless noted otherwise.
Animal Studies
All mice procedures were conducted under the guidelines and the institutional animal care protocol (00001334-RN01; 00001250-RN01) approved by the Institutional Animal Care and Use Committee (IACUC) at The University of Texas MD Anderson Cancer Center. The experiment is not randomized and no statistical method was used to estimate sample size. For the orthotopic model, 2 groups of nude mice (Strain Name: J:NU; 4-week-old; female; from The Jackson Laboratory) were used and were injected with 1 × 10⁶ cells of AsPC-1/vector/Luc (n = 16) and AsPC-1/ANG/Luc (n = 15) stable cell lines into the pancreas of nude mice. Tumor-bearing mice from each were further divided into two groups [n = 8 per group except for the AsPC-1/ANG/Luc with erlotinib group (n = 7)] for treatment with erlotinib or a matched vehicle. Erlotinib (50 mg/kg solved in vehicle: 0.4% Tween-20, 150 mmol/L of NaCl with 0.5% carboxymethyl cellulose) was administrated on day 7 after tumor inoculation by oral gavage five times per week as one set of treatment cycle, continuing for three cycles. Luciferase activity was represented by tumor volume and measured by IVIS live imaging. For the in vivo tumorigenesis assay, 5 nude mice per group were subcutaneously injected with 2 × 10⁶ cells of NIH-3T3 stable clones as indicated. Tumor volume was monitored every 5 days and determined in vivo by external caliper; for erlotinib study in this assay, 2 groups of nude mice were used and 10 mice per group were subcutaneously injected with 1 × 10⁶ cells of NIH-3T3 stable clones as indicated. Erlotinib was administrated on day 5 after cell injection. Both groups were treated with erlotinib or a matched vehicle by oral gavage once per two days, continuing for three weeks. Tumor volume was monitored once per week after erlotinib administration on day 5 and determined in vivo by external caliper. For ANG neutralizing assay using ANG Ab (clone 26-2F, Absolute Antibody, Cat# Ab00400-1.1), HPAC-1 and CFPAC-1 were performed, respectively. For HPAC-1, 18 nude mice were subcutaneously injected with 5 × 10⁵ cells of HPAC-1 mixed with PBS (n = 6), mIgG (10 μg/dose; n = 6), or ANG Ab (0.5 mg/kg; n = 6). Mice were subsequently injected with daily treatments (PBS, mIgG, or ANG Ab) at the site of initial tumor cell injection. Tumor volume was monitored as the indicated day and determined in vivo by external caliper. For CFPAC-1, 16 nude mice were subcutaneously injected with 5 × 10⁵ cells of CFPAC-1 mixed with mIgG (10 μg/dose; n = 8) or ANG Ab (0.5 mg/kg; n = 8). Mice were subsequently injected with daily treatments (mIgG or ANG Ab) at the site of initial tumor cell injection. Tumor volume was monitored as the indicated day and determined in vivo by external caliper. For ANG knockdown assays, HPAC-1 and CFPAC-1 were performed, respectively. For HPAC-1, 2 groups of nude mice were subcutaneously injected with 5 × 10⁵ cells of HPAC-1-sh-vector (n = 10) and HPAC-1-sh-ANG #2 (n = 10) stable cell lines. Tumor-bearing mice on day 10 from each were further divided into three groups (n = 5 per group) for treatment with gemcitabine (20 mg/kg solved in 0.7% saline) plus either erlotinib (50 mg/kg; Gem/Erlo) or a matched vehicle (Gem). Erlotinib was administrated by oral gavage five times per week and gemcitabine was given intravenous injection once per week as one set of treatment cycle, continuing for three cycles. Tumor weight was measured at the end point. For CFPAC-1, 3 groups of nude mice were subcutaneously injected with 1 × 10⁶ cells of CFPAC-1-sh-vector (n = 10), CFPAC-1-sh-ANG #1 (n = 10), and CFPAC-1-sh-ANG #2 (n = 10) stable cell lines. Tumor-bearing mice on day 14 from each were further divided into three groups (n = 5 per group) and administrated intravenous gemcitabine (20 mg/kg/week) plus oral either erlotinib (50 mg/kg/day; Gem/Erlo) or a matched vehicle (Gem). Tumor volume was monitored as the indicated day and determined in vivo by external caliper. Tumor weight was measured at the end point. For mAng1 knockdown assay, we used a 19636 mouse cell line from a p48Cre+;LSL-KrasL/+;Trp53L/+ model in B6 background. Two groups of B6 mice (Strain Name: C57BL/6J; Stock No: 00064; 5-week-old; female; from The Jackson Laboratory) were subcutaneously injected with 1 × 10⁶ cells of 19636-sh-vector (n = 18) and 19636-sh-mAng1 #2 (n = 18) stable cell lines. Tumor-bearing mice on day 10 from each were further divided into three groups (n = 6 per group) and administrated oral erlotinib plus intravenous either saline (50 mg/kg/day; Erlo) or gemcitabine (20 mg/kg/week; Gem/Erlo). Mice survival was monitored.
Human plasma samples
Human plasma samples were obtained following the guidelines approved by the Institutional Review Board at The University of Texas MD Anderson Cancer Center, and written informed consent was obtained from patients in all cases at the time of blood sample withdrawal. All these clinical information validated our results without selection bias. For Experiment-1, a total of 40 human plasma samples, collected as per protocols LAB01-526, LAB10-0434 (TexGen biorepository), and LAB05-0131, were obtained from 30 patients with pancreatic adenocarcinoma, who had not been treated previously (case group: 10 males and 20 females; mean ± SD age, 58.77 ± 11.56 years; median age, 61.00 years; range, 37-77 years), and 10 plasma samples were obtained from screening patients who did not have cancer (control group: 3 males and 7 females; mean ± SD age, 51.00 ± 9.76 years; median age, 51.00 years; range, 32-54 years). No significant distinction of age (mean age, p = 0.064; median age, p = 0.067) and sex (p = 0.845) was shown between controls and cases. All plasma samples were collected before treatments. We evaluated the association of ANG and hRNase1 with surgery, radiation therapy, metastasis, tumor size, CA199 level, and CEA level in the 30 patients. We did not find any significance of ANG and hRNase1 with those variables. Wilcoxon rank sum test was used for surgery (p = 0.90 for ANG; p = 0.80 for hRNase1), radiation therapy (p = 0.70 for ANG; p = 0.57 for hRNase1), and metastasis (p = 0.95 for ANG; p = 0.43 for hRNase1); Pearson correlation test was used for tumor size (p = 0.67 for ANG; p = 0.81 for hRNase1), CA199 level (p = 0.33 for ANG; p = 0.66 for hRNase1), and CEA level (p = 0.51 for ANG; p = 0.29 for hRNase1). For Experiment-2, a total of 40 human plasma samples, collected as per protocol ID98-155, were obtained from 20 patients with pancreatic adenocarcinoma (case group: 13 males and 7 females; mean ± SD age, 63.75 ± 5.77 years; median age, 61 years; range, 55-77 years) and 20 plasma samples were obtained from screening patients who did not have cancer (control group: 13 males and 7 females; mean ± SD age, 63.60 ± 5.83 years; median age, 62 years; range, 55-77 years). No significant distinction of age (mean age, p = 0.94) and gender (p = 1.00) was shown between controls and cases. We utilized Pearson correlation test to evaluate the association of ANG and hRNase1 in the 20 patients with tumor size (p = 0.09 for ANG; p = 0.68 for hRNase1), CA199 level (p = 0.70 for ANG; p = 0.39 for hRNase1), and total bilirubin value (p = 0.52 for ANG; p = 0.88 for hRNase1). For erlotinib sensitivity experiment in pancreatic cancer patients (protocol ID98-155), a total of 70 human plasma samples were obtained, including 25 non-erlotinib and 45 erlotinib cases. This cohort for 45 erlotinib-treated samples was retrospectively selected among 1187 patients. In order to use the most homogeneous group for comparison, we set the following three criteria which identified only a total of 45 cases who have tumor tissues for KRAS mutation status determination from those 1,187 patients receiving erlotinib: 1) patients receiving erlotinib as first-line regimen with evaluable approximate length of treatment information available (81/1,187 patients); 2) patients receiving gemcitabine plus cisplatin (Gem/Cis; 60/81 patients); 3) patients having metastatic disease with radiographic stage at presentation to the GI center (45/60 patients). We utilized Pearson correlation test to evaluate the association of ANG in the 45 patients who received erlotinib with tumor size (p = 0.35), CA199 level (p = 0.51), and total bilirubin value (p = 0.45); in the 25 patients who did not receive erlotinib with tumor size (p = 0.93), CA199 level (p = 0.40), and total bilirubin value (p = 0.09). Another independent erlotinib-treated group was selected 28 erlotinib cases (protocol ID98-155; 16 males and 12 females; mean ± SD age, 61.46 ± 10.94 years; median age, 60 years; range, 42-86 years). All were presented to our institution with radiographic metastatic disease and received erlotinib as a component of first-line regimen in combination with gemcitabine plus cisplatin. We utilized Pearson correlation test to evaluate the association of ANG in the 28 patients with tumor size (p = 0.62), CA199 level (p = 0.84), total bilirubin value (p = 0.20), and ECOG performance status (p = 0.54).
Human pancreatic tumor tissue microarray
This study was approved by the Institutional Review Board at The University of Texas MD Anderson Cancer Center. Informed consent was obtained from all patients. Human tissue microarrays from 119 cases of pancreatic cancer (gender: 70 males and 49 females; mean ± SD age, 64.48 ± 10.06 years; median age, 65 years; range, 25-85 years) were analyzed by immunohistochemistry staining using phospho-EGFR-Tyr1068 (1:50, 3777, Cell Signaling) and ANG (1:50, AF265, R&D Systems) antibodies. The same patient cohort was analyzed by Kaplan-Meier overall survival analysis in the indicated groups with different ANG levels (n = 114). The difference in the total number of patients between these two experiments was due to lack of clinical survival information of five patients in the survival analysis.
Method Details
Cell lysis, immunoblot (IB), and immunoprecipitation
Cells were lysed in RIPA buffer (150 mM NaCl, 50 mM Tris [pH 7.5], 1% Nonidet P-40, and protease inhibitor mixture) and by sonication. Total lysates were collected after centrifugation at maximum speed and subjected to IB analysis with the indicated antibodies. For immunoprecipitation, cells after bRNaseA treatment were fixed with 1 mM dithiobis[succinimidylpropionate] (DSP, Thermo Scientific) at room temperature for 30 min, and the cell lysates were then immunoprecipitated with EGFR using an EGFR or normal IgG antibodies as a negative control, followed by IB analysis with the indicated antibodies.
Constructs and stable transfectants
For Myc-His-tagged constructs, ANG complementary DNA was subcloned into a pcDNA6/Myc-His-A vector (Invitrogen). For GST-tagged constructs, bRNaseA and ANG complementary DNAs were subcloned into a pGEX-6P-1 vector (GE Healthcare). The Myc-GST-tagged ANG was constructed by PCR from Myc-His-tagged ANG with a C-terminal Myc tag, and subcloned into a pGEX-6P-1 vector. For HeLa stable transfectants, bRNaseA and ANG complementary DNAs were subcloned into a modified pCDH-CMV-MCS-EF1-Puro vector (CD510B-1, System Biosciences) containing a C-terminal Flag tag. Single-point mutants were generated by site-directed mutagenesis. The lentiviral-based shRNA (TRC plasmids) used to knock down expression of human or mouse ANG was purchased from Sigma. For the reconstitution of ANG (Flag-ANG), ANG complementary DNAs were subcloned into a modified pCDH-CMV-MCS-EF1-Neo vector (CD514B-1, System Biosciences) containing a C-terminal Flag tag. For AsPC-1-ANG stable transfectants, ANG was subcloned into a pCDH-CMV-MCS-EF1-Puro vector. All stable transfectants were established by lentivirus infection and selected with puromycin.
Secreted protein preparation
Cells were maintained in a serum-starved medium for 24 hr, and media containing secreted proteins were collected. After filtration with use of 0.45-μm filters to remove cell debris, media were concentrated at 5,000 μ g for 1 hr by Amicon Ultra-15 Centrifugal Filter Units (UFC900324, Millipore) to a desired volume of secreted proteins.
RNase activity assay
RNase activity was detected with use of Ambion® RNaseAlert® Lab Test kit (Invitrogen) with a slight modification. In brief, 5 μl of 10× RNaseAlert buffer was added to one tube of fluorescent substrate, and 45 μl of the test sample was then added to the tube. The mixture was sequentially pipetted into a well of a 96-well plate and monitored at 37°C to collect real-time fluorescence data at 5-min intervals for the indicated time period using a BioTek Synergy™ Neo multi-mode reader.
Preparation of DyLight 594-bRNaseA
DyLight 594-bRNaseA was generated via fluorescent labeling of bRNaseA recombinant proteins with DyLight 594 dye using a DyLight™ 594 antibody labeling kit (53044, Thermo Scientific). We followed the manufacturer’s instruction for labeling bRNaseA with DyLight 594 Amine-Reactive Dye, which is activated with an N-hydroxysuccinimide (NHS) ester moiety to react with exposed N-terminal α-amino groups or the ε-amino groups of lysine residues to form stable amide bonds.
Confocal microscopy
Cells were fixed in 4% paraformaldehyde for 15 min, permeabilized with 0.5% Triton X-100 for 15 min, and blocked with 5% bovine serum albumin for 1 hr. After the incubation with primary antibodies overnight at 4°C, cells were then further incubated with the appropriate secondary antibodies tagged with fluorescein isothiocyanate, Texas red, or Alexa 647 (Life Technologies) for 1 hr at room temperature. Nuclei were stained with DAPI contained in the mounting reagent (Invitrogen). Confocal fluorescence images were captured using a Zeiss LSM 710 laser microscope. In all cases, optical sections were obtained through the middle planes of the nuclei, as determined with use of nuclear counterstaining.
Pretreatment of LysoTracker
Cells were starved in serum-free medium for 24 hr. After starvation, we removed the medium from the dish and added the LysoTracker Green DND-26 (L7526, Thermo Scientific) containing medium using working concentration of 100 nM at 37°C for 2 hr. Cells were treated with bRNaseA for 30 min and 60 min during the process of LysoTracker pretreatment.
Duolink in situ proximity ligation assay (PLA)
Cells were fixed with 4% paraformaldehyde for 15 min, permeabilized with 0.5% Triton X-100 for 15 min, and blocked with 5% bovine serum albumin. Cells were then incubated with mouse EGFR antibody (1:2,000; Thermo Scientific) and rabbit bRNaseA (1:400; Abcam) or Flag antibody (1:200; Cell Signaling) for 30 min. The fluorescence signals were detected by the Duolink in situ PLA probe (Axxora) according to the manufacturer’s instructions and visualized by using a Zeiss LSM 710 laser microscope.
Dimerization assay
Cells were starved in serum-free medium for 24 hr. After starvation, cold phosphate-buffered saline (PBS) containing 50 ng/ml EGF or 5 μg/ml ANG was added onto plates for 2 hr at 4°C. Then, cells were washed with cold PBS 3 times and incubated for 2 hr at 4°C with 0.5 mM cross linker bis(sulfosuccinimidyl)suberate (BS3; Thermo Scientific) in PBS. After washing 3 times with cold PBS, cross-linking reactions were stopped by incubating cells in 50 mM Tris buffer (pH 7.5) for 15 min at room temperature. Cells were subsequently lysed and cell lysates analyzed by IB in a non-reducing and non-denaturing condition.
Detection of ligands-EGFR binding affinity by ELISA
ELISA 96-well plates were captured with 3 μg/ml EGFR antibody (Abcam) or normal mouse IgG (Santa Cruz) as a negative control in 0.2 M sodium phosphate buffer (pH 6.5) at 100 μl/well overnight at room temperature. The plates were then rinsed three times with PBS with 0.05% Tween-20 (PBST) and blocked with 200 μl/well of 1% BSA solution containing 0.05% Tween-20 at 37°C for 3 hr. After rinsing three times with PBST, 100 μl/well of A431-RIPA lysates were added and incubated overnight at 4°C. The plates were then washed three times with PBST, followed by the addition of recombinant ANG, amphiregulin, or biotin-EGF at a series of diluted concentrations in RIPA buffer. After incubation overnight at 4°C, wells were washed with 400 μl/well of 1M sucrose three times with shaking for 1 min, and 100 μl/well of biotin-conjugated detection antibodies (except for the biotin-EGF set) in blocking buffer was added for incubation at room temperature for 2 hr. The plates were washed with 1M sucrose three more times with shaking, and 100 μl/well of streptavidin-conjugated HRP (1:2,000 in blocking buffer) was added and incubated at room temperature for 1 hr. The wells were washed again with 1M sucrose three times with shaking, and 100 μl/well of TMB as a peroxidase substrate was added and incubated for 30 min at room temperature. The reaction was terminated by the addition of 50 μl/well of stop solution. The optical density was determined at 450 nm, corrected by subtraction of readings at 570 nm, with use of a BioTek Synergy™ Neo multi-mode reader. The dissociation constant (Kd) was estimated by the above binding data and then transformed to create a Scatchard plot with the GraphPad Prism program (version 6; Prism Software Inc., San Diego, USA).
Colony formation assay
Cell were seeded at 1 × 10² cells/well in 6-well plates and treated with or without erlotinib with the indicated concentrations. After incubation at 37°C for 10 days, colonies were fixed with 4% paraformaldehyde at room temperature for 15 min, stained with 0.05% crystal violet at room temperature for an additional 15 min and counted.
Cell viability assay
Cell viability was assessed using 3-(4,5-dimethylthiazol-2-yl)-2,5-diphenyltetrazolium bromide (MTT) assay. In brief, cells were seeded at 2 × 10 cells/100 μl/well in 96-well plates and treated with or without erlotinib (2 μM). After incubation at 37°C for 72 hr, 10 μl of MTT (5 mg/ml in PBS) was added to each well and cells were incubated at 37°C for 3 hr. The water-insoluble purple precipitate was then solubilized in 150 μl of DMSO per well. Absorbance of the wells was measured at 595 nm with a reference wavelength of 650 nm using a BioTek Synergy™ Neo multi-mode reader.
Cell migration and invasion assays
Cell migration and invasion were performed by using BioCoat™ Control Cell Culture Insertsin and BioCoat™ Growth Factor Reduced Matrigel Invasion Chambers (BD Biosciences), respectively. Culture medium containing 10% fetal bovine serum as a chemoattractant was added to the plate, and cells (2.5 × 10⁴ cells/24-well chamber) in serum-free culture medium with the indicated treatments were added to the chamber. The chamber was then incubated at 37°C for 24 hr (for HeLa cells) or 72 hr (for AsPC-1 stable transfectants) to allow cells to penetrate an 8 μm pore size, uncoated membrane or a Matrigel-coated membrane. Cells remained on the upper surface of the membrane were removed with a cotton swab, and those on the underside of the membrane were fixed with 4% paraformaldehyde, stained with 0.5% crystal violet, and microscopically counted from three random fields of each membrane. The average cell number per field for triplicate membranes was used to calculate the mean with SD. The values of cell migration and invasion are shown as number of migrated cells and invaded cells per field, respectively. The relative fold at empty vector without treatment or the first bar was defined as 1.
Evaluation of immunohistochemical staining
For IHC staining, we used Histoscore (H-score), which was calculated by an established semiquantitative assessment of both the intensity of staining and the percentage of positive cells following an established procedure (Detre et al., 1995). For H-score assessment, 10 fields were chosen at random at 400× magnification, and the staining intensity in the malignant cell was scored as 0, 1, 2, or 3 for the presence of negative, weak, intermediate, and strong red staining, respectively. The total number of cells in each field and the number of cells stained at each intensity were counted. The average percentage of positive staining was calculated using the following formula: H-score = (% of cells stained at intensity category 1 × 1) + (% of cells stained at intensity category 2 × 2) + (% of cells stained at intensity category 3 × 3). An H-score between 0 and 300 was obtained for each staining, and the average of H-score for all the cases calculated. Cases with H-score higher than average were regarded as high expression and those with H-score equal or less than average as low expression.
RNA deep sequencing and GSEA analysis
Next-generation RNA deep sequencing for whole transcriptome analysis was performed according to the standard procedure instructed by Applied Biosystems. All RNA sequencing data were deposited to the Gene Expression Omnibus (GEO) data repository with accession number GSE109427. Briefly, total RNA was extracted from AsPC-1 cells as indicated. All RNA samples that passed quality tests with RIN-values greater than 8, as measured by Agilent Technologies Bioanalyzer, were subjected to RNA deep sequencing. SOLiD fragment colorspace transcriptome reads (50 nt) were mapped to the human genome (hg19) and assigned to ensemble transcripts using Bioscope 1.3.1 (Life Technologies). Unsupervised clustering was performed on the top 5,000 most variedly expressed genes (as determined by median absolute deviation) using Cluster and TreeView software (http://rana.lbl.gov/EisenSoftware.htm). Genes with significant change in expression after EGF/ANG treatment were identified by using R package limma with a cutoff p value of 0.05 and threshold fold change of 1.5. GSEA analysis was performed by using default conditions on AsPC-1 treated by EGF/ANG for 1 and 5 hr vs. AsPC-1 treated for 0 and 24 hr.
Quantification and Statistical Analysis
Statistical Analysis
Each sample was assayed in triplicate, except if stated otherwise. All error bars denote standard deviation (SD). Statistical analyses were performed using Prism 6 software (Graphpad Inc.). Student’s t-test was used to compare two groups of independent samples. Repeated measure ANOVA analysis was used if there were more than two data groups to compare. Kaplan-Meier analysis and Log-rank (Mantel-Cox) test were used to evaluate the statistical significance for comparison of survival curves and hazard ratio. Data was quantified using ImageJ software program (version 1.38×; National Institutes of Health). Significance of mean comparison is represented on the graphs as follow: NS, not significant; *p < 0.05; **p < 0.01; ***p < 0.001; #p < 0.001. No statistical methods were used to predetermine sample size.
Supplementary Material
Table S2. List of changed genes treated with EGF and ANG in AsPC-1 pancreatic cancer cells. Related to Figure 5. Provided as an Excel file.
SIGNIFICANCE.
EGFR ligand ANG serves as a serum biomarker to predict response to erlotinib, an EGFR tyrosine kinase inhibitor, in PDAC. Knockdown of ANG demonstrates its oncogenic role and decreases sensitivity to erlotinib treatment in vitro and in vivo. High plasma ANG level in patients is positively associated with their response to erlotinib treatment in a small patient cohort, highlighting the interplay between ANG and EGFR in PDAC. This oncogene addiction effect may be advantageous for the development of a serum biomarker-guided target therapy in malignancies. The ANG-EGFR axis also opens an avenue toward our understanding of the ligand-receptor cognate signaling between RNases and RTKs, bridging two unrelated protein families via this ligand function of RNases.
HIGHLIGHTS.
ANG acts as an EGFR ligand in a ribonuclease catalytic-independent manner
Depletion of ANG highlights an oncogenic role of the ANG-EGFR axis in PDAC
High ANG level serves as a serum biomarker to predict erlotinib response
New insight into ligand-receptor relationship between RTK and RNase families
Acknowledgments
We thank John Weinstein at MD Anderson Cancer Center for his constructive advice on bioinformatics, Han Liang at MD Anderson Cancer Center for the pipeline data processing, Tamara Locke at the Department of Scientific Publications for editing this manuscript, and the following grant support: National Institutes of Health (CCSG CA016672); The University of Texas MD Anderson-China Medical University and Hospital Sister Institution Fund; Ministry of Science and Technology, International Research-intensive Centers of Excellence in Taiwan (I-RiCE; MOST 105-2911-I-002-302); Ministry of Health and Welfare, China Medical University Hospital Cancer Research Center of Excellence (MOHW106-TDU-B-212-14403); and Center for Biological Pathways.
Footnotes
Publisher's Disclaimer: This is a PDF file of an unedited manuscript that has been accepted for publication. As a service to our customers we are providing this early version of the manuscript. The manuscript will undergo copyediting, typesetting, and review of the resulting proof before it is published in its final citable form. Please note that during the production process errors may be discovered which could affect the content, and all legal disclaimers that apply to the journal pertain.
AUTHOR CONTRIBUTIONS
Conceptualization, Methodology, and Writing - Original Draft, Y-N.W., H-H.L., and M-C.H.; Investigation, Y-N.W., H-H.L., C-K.C., W-H.Y., Y.W., C-T.C., C.Z., W-J.W., S-O.L., W.X., and H-W.K.; Writing - Review & Editing, Y-N.W., H-H.L., J.L.H, and M-C.H.; Formal analysis, J.Y.; Resources, H.Y., X.W., Y.Y., XL., C.-G.L., H.W., D.L., M.H.K., L.R.P., D.F., M.J., A.M., Y.K., M.K., and J.B.F.; Supervision, Project Administration, and Funding Acquisition, M.-C.H.
Declaration of Interests
The authors have no conflicts of interest to declare.
References
- Amin DN, Hida K, Bielenberg DR, Klagsbrun M. Tumor endothelial cells express epidermal growth factor receptor (EGFR) but not ErbB3 and are responsive to EGF and to EGFR kinase inhibitors. Cancer research. 2006;66:2173–2180. doi: 10.1158/0008-5472.CAN-05-3387. [DOI] [PubMed] [Google Scholar]
- Ardito CM, Gruner BM, Takeuchi KK, Lubeseder-Martellato C, Teichmann N, Mazur PK, Delgiorno KE, Carpenter ES, Halbrook CJ, Hall JC, et al. EGF receptor is required for KRAS-induced pancreatic tumorigenesis. Cancer cell. 2012;22:304–317. doi: 10.1016/j.ccr.2012.07.024. [DOI] [PMC free article] [PubMed] [Google Scholar]
- Avraham R, Yarden Y. Feedback regulation of EGFR signalling: decision making by early and delayed loops. Nat Rev Mol Cell Bio. 2011;12:104–117. doi: 10.1038/nrm3048. [DOI] [PubMed] [Google Scholar]
- Buck E, Eyzaguirre A, Haley JD, Gibson NW, Cagnoni P, Iwata KK. Inactivation of Akt by the epidermal growth factor receptor inhibitor erlotinib is mediated by HER-3 in pancreatic and colorectal tumor cell lines and contributes to erlotinib sensitivity. Mol Cancer Ther. 2006;5:2051–2059. doi: 10.1158/1535-7163.MCT-06-0007. [DOI] [PubMed] [Google Scholar]
- Chao TY, Raines RT. Mechanism of ribonuclease A endocytosis: analogies to cell-penetrating peptides. Biochemistry. 2011;50:8374–8382. doi: 10.1021/bi2009079. [DOI] [PMC free article] [PubMed] [Google Scholar]
- Cho S, Beintema JJ, Zhang J. The ribonuclease A superfamily of mammals and birds: identifying new members and tracing evolutionary histories. Genomics. 2005;85:208–220. doi: 10.1016/j.ygeno.2004.10.008. [DOI] [PubMed] [Google Scholar]
- Detre S, Saclani Jotti G, Dowsett M. A “quickscore” method for immunohistochemical semiquantitation: validation for oestrogen receptor in breast carcinomas. J Clin Pathol. 1995;48:876–878. doi: 10.1136/jcp.48.9.876. [DOI] [PMC free article] [PubMed] [Google Scholar]
- Di Fiore PP, Pierce JH, Fleming TP, Hazan R, Ullrich A, King CR, Schlessinger J, Aaronson SA. Overexpression of the human EGF receptor confers an EGF-dependent transformed phenotype to NIH 3T3 cells. Cell. 1987;51:1063–1070. doi: 10.1016/0092-8674(87)90592-7. [DOI] [PubMed] [Google Scholar]
- Etoh T, Shibuta K, Barnard GF, Kitano S, Mori M. Angiogenin expression in human colorectal cancer: the role of focal macrophage infiltration. Clinical cancer research : an official journal of the American Association for Cancer Research. 2000;6:3545–3551. [PubMed] [Google Scholar]
- Gao X, Xu Z. Mechanisms of action of angiogenin. Acta biochimica et biophysica Sinica. 2008;40:619–624. doi: 10.1111/j.1745-7270.2008.00442.x. [DOI] [PubMed] [Google Scholar]
- Goncalves KA, Silberstein L, Li S, Severe N, Hu MG, Yang H, Scadden DT, Hu GF. Angiogenin Promotes Hematopoietic Regeneration by Dichotomously Regulating Quiescence of Stem and Progenitor Cells. Cell. 2016;166:894–906. doi: 10.1016/j.cell.2016.06.042. [DOI] [PMC free article] [PubMed] [Google Scholar]
- Hu GF, Riordan JF, Vallee BL. A putative angiogenin receptor in angiogenin-responsive human endothelial cells. Proceedings of the National Academy of Sciences of the United States of America. 1997;94:2204–2209. doi: 10.1073/pnas.94.6.2204. [DOI] [PMC free article] [PubMed] [Google Scholar]
- Hu GF, Strydom DJ, Fett JW, Riordan JF, Vallee BL. Actin is a binding protein for angiogenin. Proceedings of the National Academy of Sciences of the United States of America. 1993;90:1217–1221. doi: 10.1073/pnas.90.4.1217. [DOI] [PMC free article] [PubMed] [Google Scholar]
- Ibaragi S, Yoshioka N, Kishikawa H, Hu JK, Sadow PM, Li M, Hu GF. Angiogenin-stimulated rRNA transcription is essential for initiation and survival of AKT-induced prostate intraepithelial neoplasia. Molecular cancer research : MCR. 2009;7:415–424. doi: 10.1158/1541-7786.MCR-08-0137. [DOI] [PMC free article] [PubMed] [Google Scholar]
- Kang Y, Zhang R, Suzuki R, Li SQ, Roife D, Truty MJ, Chatterjee D, Thomas RM, Cardwell J, Wang Y, et al. Two-dimensional culture of human pancreatic adenocarcinoma cells results in an irreversible transition from epithelial to mesenchymal phenotype. Lab Invest. 2015;95:207–222. doi: 10.1038/labinvest.2014.143. [DOI] [PMC free article] [PubMed] [Google Scholar]
- Kishimoto K, Liu S, Tsuji T, Olson KA, Hu GF. Endogenous angiogenin in endothelial cells is a general requirement for cell proliferation and angiogenesis. Oncogene. 2005;24:445–456. doi: 10.1038/sj.onc.1208223. [DOI] [PubMed] [Google Scholar]
- Lee HH, Wang YN, Hung MC. Non-canonical signaling mode of the epidermal growth factor receptor family. American journal of cancer research. 2015;5:2944–2958. [PMC free article] [PubMed] [Google Scholar]
- Li S, Schmitz KR, Jeffrey PD, Wiltzius JJ, Kussie P, Ferguson KM. Structural basis for inhibition of the epidermal growth factor receptor by cetuximab. Cancer cell. 2005;7:301–311. doi: 10.1016/j.ccr.2005.03.003. [DOI] [PubMed] [Google Scholar]
- Moore MJ, Goldstein D, Hamm J, Figer A, Hecht JR, Gallinger S, Au HJ, Murawa P, Walde D, Wolff RA, et al. Erlotinib plus gemcitabine compared with gemcitabine alone in patients with advanced pancreatic cancer: a phase III trial of the National Cancer Institute of Canada Clinical Trials Group. Journal of clinical oncology : official journal of the American Society of Clinical Oncology. 2007;25:1960–1966. doi: 10.1200/JCO.2006.07.9525. [DOI] [PubMed] [Google Scholar]
- Navas C, Hernandez-Porras I, Schuhmacher AJ, Sibilia M, Guerra C, Barbacid M. EGF receptor signaling is essential for k-ras oncogene-driven pancreatic ductal adenocarcinoma. Cancer cell. 2012;22:318–330. doi: 10.1016/j.ccr.2012.08.001. [DOI] [PMC free article] [PubMed] [Google Scholar]
- Philip PA, Benedetti J, Corless CL, Wong R, O’Reilly EM, Flynn PJ, Rowland KM, Atkins JN, Mirtsching BC, Rivkin SE, et al. Phase III study comparing gemcitabine plus cetuximab versus gemcitabine in patients with advanced pancreatic adenocarcinoma: Southwest Oncology Group-directed intergroup trial S0205. Journal of clinical oncology : official journal of the American Society of Clinical Oncology. 2010;28:3605–3610. doi: 10.1200/JCO.2009.25.7550. [DOI] [PMC free article] [PubMed] [Google Scholar]
- Pizzo E, Sarcinelli C, Sheng J, Fusco S, Formiggini F, Netti P, Yu W, D’Alessio G, Hu GF. Ribonuclease/angiogenin inhibitor 1 regulates stress-induced subcellular localization of angiogenin to control growth and survival. J Cell Sci. 2013;126:4308–4319. doi: 10.1242/jcs.134551. [DOI] [PMC free article] [PubMed] [Google Scholar]
- Raines RT. Ribonuclease A. Chemical reviews. 1998;98:1045–1066. doi: 10.1021/cr960427h. [DOI] [PubMed] [Google Scholar]
- Roife D, Dai B, Kang Y, Perez MVR, Pratt M, Li X, Fleming JB. Ex Vivo Testing of Patient-Derived Xenografts Mirrors the Clinical Outcome of Patients with Pancreatic Ductal Adenocarcinoma. Clinical cancer research : an official journal of the American Association for Cancer Research. 2016;22:6021–6030. doi: 10.1158/1078-0432.CCR-15-2936. [DOI] [PMC free article] [PubMed] [Google Scholar]
- Rosell R, Carcereny E, Gervais R, Vergnenegre A, Massuti B, Felip E, Palmero R, Garcia-Gomez R, Pallares C, Sanchez JM, et al. Erlotinib versus standard chemotherapy as first-line treatment for European patients with advanced EGFR mutationpositive non-small-cell lung cancer (EURTAC): a multicentre, open-label, randomised phase 3 trial. Lancet Oncol. 2012;13:239–246. doi: 10.1016/S1470-2045(11)70393-X. [DOI] [PubMed] [Google Scholar]
- Sanders JM, Wampole ME, Thakur ML, Wickstrom E. Molecular determinants of epidermal growth factor binding: a molecular dynamics study. PloS one. 2013;8:e54136. doi: 10.1371/journal.pone.0054136. [DOI] [PMC free article] [PubMed] [Google Scholar]
- Shepherd FA, Rodrigues Pereira J, Ciuleanu T, Tan EH, Hirsh V, Thongprasert S, Campos D, Maoleekoonpiroj S, Smylie M, Martins R, et al. Erlotinib in previously treated non-small-cell lung cancer. N Engl J Med. 2005;353:123–132. doi: 10.1056/NEJMoa050753. [DOI] [PubMed] [Google Scholar]
- Shimoyama S, Gansauge F, Gansauge S, Negri G, Oohara T, Beger HG. Increased angiogenin expression in pancreatic cancer is related to cancer aggressiveness. Cancer research. 1996;56:2703–2706. [PubMed] [Google Scholar]
- Sorrentino S. The eight human “canonical” ribonucleases: molecular diversity, catalytic properties, and special biological actions of the enzyme proteins. FEBS letters. 2010;584:2194–2200. doi: 10.1016/j.febslet.2010.04.018. [DOI] [PubMed] [Google Scholar]
- Troiani T, Martinelli E, Capasso A, Morgillo F, Orditura M, De Vita F, Ciardiello F. Targeting EGFR in pancreatic cancer treatment. Current drug targets. 2012;13:802–810. doi: 10.2174/138945012800564158. [DOI] [PubMed] [Google Scholar]
- Tzeng CW, Frolov A, Frolova N, Jhala NC, Howard JH, Buchsbaum DJ, Vickers SM, Heslin MJ, Arnoletti JP. Epidermal growth factor receptor (EGFR) is highly conserved in pancreatic cancer. Surgery. 2007;141:464–469. doi: 10.1016/j.surg.2006.09.009. [DOI] [PubMed] [Google Scholar]
- Voigt M, Braig F, Gothel M, Schulte A, Lamszus K, Bokemeyer C, Binder M. Functional dissection of the epidermal growth factor receptor epitopes targeted by panitumumab and cetuximab. Neoplasia. 2012;14:1023–1031. doi: 10.1593/neo.121242. [DOI] [PMC free article] [PubMed] [Google Scholar]
- Wang JP, Wu CY, Yeh YC, Shyr YM, Wu YY, Kuo CY, Hung YP, Chen MH, Lee WP, Luo JC, et al. Erlotinib is effective in pancreatic cancer with epidermal growth factor receptor mutations: a randomized, open-label, prospective trial. Oncotarget. 2015;6:18162–18173. doi: 10.18632/oncotarget.4216. [DOI] [PMC free article] [PubMed] [Google Scholar]
- Ying H, Elpek KG, Vinjamoori A, Zimmerman SM, Chu GC, Yan H, Fletcher-Sananikone E, Zhang H, Liu Y, Wang W, et al. PTEN is a major tumor suppressor in pancreatic ductal adenocarcinoma and regulates an NF-kappaB-cytokine network. Cancer Discov. 2011;1:158–169. doi: 10.1158/2159-8290.CD-11-0031. [DOI] [PMC free article] [PubMed] [Google Scholar]
- Ying H, Kimmelman AC, Lyssiotis CA, Hua S, Chu GC, Fletcher-Sananikone E, Locasale JW, Son J, Zhang H, Coloff JL, et al. Oncogenic Kras maintains pancreatic tumors through regulation of anabolic glucose metabolism. Cell. 2012;149:656–670. doi: 10.1016/j.cell.2012.01.058. [DOI] [PMC free article] [PubMed] [Google Scholar]
- Yuan Y, Wang F, Liu XH, Gong DJ, Cheng HZ, Huang SD. Angiogenin is involved in lung adenocarcinoma cell proliferation and angiogenesis. Lung cancer. 2009;66:28–36. doi: 10.1016/j.lungcan.2008.12.027. [DOI] [PubMed] [Google Scholar]
Associated Data
This section collects any data citations, data availability statements, or supplementary materials included in this article.
Supplementary Materials
Table S2. List of changed genes treated with EGF and ANG in AsPC-1 pancreatic cancer cells. Related to Figure 5. Provided as an Excel file.