

Abstract
Rationale
Neighborhood characteristics may influence health and well-being outcomes through stressors in daily life.
Objectives
This study tested whether a varied set of perceived characteristics of neighborhood (i.e., social cohesion, safety, aesthetic quality, violence) predicted stressor frequency and severity as well as negative emotional responses to stressors. We predicted greater reported cohesion and safety and less violence would be associated with less frequent stressor exposure and severity and less intense negative affect following stressors; we conducted subsequent tests of neighborhood aesthetic quality as a predictor.
Methods
Participants (n=233, age 25–65 years) were residents in a socio-economically, racially, and ethnically diverse zip code in Bronx, New York, most who participated in the Effects of Stress on Cognitive Aging, Physiology and Emotion study between 2012–2013. They provided demographic information and neighborhood ratings, then participated in the EMA protocol in which they completed brief smartphone surveys of current negative affect and stressor exposure, severity, and recency, five times daily for 14 days.
Results
No coded neighborhood characteristic was related to the frequency of stressors. Individuals who reported greater neighborhood violence, however, rated their stressors as more severe. Individuals rating their neighborhood lower in safety or aesthetic quality, or higher in violence, had greater negative affect following stressors.
Conclusion
Even among people living within the same zip code, individual differences in perceptions of neighborhood predict how stressful they appraised stressors in daily life to be and how much negative affect they reported following stressors.
Keywords: stress and coping, psychosocial, urban, well-being
Introduction
Neighborhoods function as contexts in which the experiences of daily life unfold, and may serve as both persistent risks and resources to well-being. Theorists have described neighborhoods as the social context of the stress process (Aneshensel, 2010; Elliott, 2000). For example, a neighborhood’s physical attributes, such as poorly maintained streets, may promote exposure to daily hassles and difficulty accessing resources (Matheson et al., 2006). Neighborhood characteristics may not only be associated with more frequent daily stressors, but also elevated distress from the threat of additional stressors – individuals who live in neighborhoods with high violence may persistently worry about their safety and thus experience greater psychological distress (Augustin et al., 2008; Choi and Matz-Costa, 2017; Cutrona et al., 2006). Furthermore, neighbors with poor social connections may not benefit from the stress-buffering effects of social support (Kubzansky et al., 2005; Mair et al., 2010b). Neighborhood characteristics, then, may impact well-being not only through exposure to actual stressors and general distress, but also through the resources available to an individual to emotionally respond to stressors.
A neighborhood’s geographic location provides information about the structural hazards that individuals are exposed to but the psychological contexts related to the perceptions of neighborhoods helps us better understand variability in health outcomes (e.g., Goldman-Mellor et al., 2016). The present study examines perceived neighborhood characteristics (safety, violence, social cohesion, aesthetic quality) as predictors of individual differences in frequency of stressor exposure in daily life, subjective severity of these stressors, and negative emotional responses to these stressors. We leverage data from a socio-economically, racially, and ethnically diverse sample of adults all residing in the same urban zip code; that is, individuals live in a circumscribed geographic area but their perceptions and experiences within this context may vary. We first present relevant theoretical models, then discuss neighborhood characteristics as potential risk and protective factors in the stress process, and then overview empirical studies of neighborhood factors and stressors and emotional responses in daily life.
Theorized Pathways
Exposure and response to stressors occurring in daily life have been proposed as one of the pathways through which wear-and-tear on physical and mental health develops across the lifespan (Almeida et al., 2011). For example, Cutrona and colleagues (2006) incorporated stress processes into their model of neighborhood effects on well-being. They proposed that neighborhood characteristics (i.e., lack of resources and threats to safety) may (1) increase exposure to stressors in daily life, (2) increase post-stressor vulnerability to depression, and by extension negative affective (NA) states, and (3) interfere with social bonds within the neighborhood, further exacerbating risk to reduced well-being. Similarly, cumulative disadvantage theories propose a role for environment in the associations among socio-economic status (SES), stress, and poor health outcomes. These theories propose that early SES results in later health disparities by channeling people into more stressful environments (Dannefer, 2003; Ferraro and Shippee, 2009; Schafer and Ferraro, 2012) resulting in increased exposure to both major events and to stressors in daily life. These and other models (Chen and Miller, 2012; Ferraro and Shippee, 2009; Geronimus et al., 2010; Myers, 2009; Taylor et al., 1997) posit that macro-level risks exert their effects on long-term health and well-being outcomes through day-to-day experiences in context.
As noted, a neighborhood context may confer both resources (i.e., transportation, public services, social connections) as well as risks (i.e., lack of safety, violence). Because of SES-related clustering of residency (Diez Roux and Mair, 2010; Geronimus et al., 2001) – in which individuals are more likely to live near others of similar SES – the role of neighborhood factors may have been confounded with SES in prior work. Indeed, neighborhoods vary in the socioeconomic composition of the residents (Kaiser et al., 2016; Diez Roux and Mair, 2010). Compared to communities with a large composition of high SES residents, communities with a large composition of low SES residents tend to have fewer beneficial (e.g., access to healthy foods, green spaces, and social organizations) and higher hazardous (e.g. fast food restaurants, limited space for physical activity, and violence) environmental resources (Hughey et al., 2016; Kaiser et al., 2016). The Reserve Capacity Model (Gallo et al., 2005; Gallo and Matthews, 1999) proposes that lower SES results in worse health outcomes because of increased daily stressor exposure and limited reserve capacity – which includes interpersonal resources such as social support – to manage stressors. Although not explicitly discussing neighborhood context, in this model the increased risk of exposure and lower protective resources from which to respond to stressors result in increased negative and decreased positive emotions, which over time lead to physiological changes and eventual disease.
In addition to the socioeconomic composition of a neighborhood, the racial/ethnic composition of a neighborhood may further explain how neighborhood characteristics relate to stressors in daily life, particularly the unique daily stressors faced by racial/ethnic minorities. A high proportion of racial and ethnic minorities reside in racially segregated, often disadvantaged communities with limited access to educational, occupational, health and social service resources that promote social mobility (Freeman Anderson, 2017; Williams and Collins, 2001). These obstacles incurred by minorities can be attributed to discriminatory acts, such unfair housing policies, which prevented commercial investment and homeownership within or near racially and ethnically segregated neighborhoods (Gee and Payne-Sturges, 2004). Thus, stressors in daily life, particularly among minorities, may also be attributed to past and/or current discriminatory actions or policies (Gee and Payne-Sturges, 2004). Identifying neighborhood characteristics related to physical and mental health outcomes may improve our understanding of racial and socioeconomic health disparities (Kaiser et al., 2016; Smith and Easterlow, 2005).
In summary, neighborhoods may serve as a context that increases risk of exposure (i.e., greater frequency of stressors in daily life, exposure to more severe stressors in daily life) but may also provide resources to buffer (i.e., less intense negative emotional response to stressors) or exacerbate (i.e., more intense response) the impact of stressors. We know little, however, about the aspects of neighborhood context which are particularly noxious or beneficial; additionally, there are relatively few studies testing these predictions as they unfold in daily life, rather than relying solely on global retrospections.
Neighborhood Characteristics as Sources of Risk & Resource
A neighborhood can be defined both as a geographic location as well as a social context. Much of the epidemiological work on “neighborhood effects” uses census tracts as proxies for neighborhoods and then compiles aggregated socio-economic position (SEP) measures from census data (Singh and Siahpush, 2002). Recent work similarly focused on objective characteristics has integrated geographic information systems (GIS) to measure residence proximity to, for example, food stores (Michimi and Wimberly, 2010) and reported crimes (McCoy et al., 2016). Another form of objective assessment is for research staff to conduct structured observations and ratings of neighborhoods (Mair et al., 2010a).
From a stress perspective, however, the objective features of a neighborhood – average education of census block, precise walking distance to nearest library, observer counts of graffiti and abandoned cars – may not be the only or most relevant information to the individual. Appraisal, an individual’s subjective assessment of the environmental threat and his or her own resources to deal with this threat, is central to classic stress theories (Lazarus and Folkman, 1984). Subjective neighborhood measures have been linked to health outcomes; for example, perceived neighborhood safety predicted allostatic load even when accounting for objective differences in neighborhood SES (Robinette et al., 2016). Similarly, perceived neighborhood quality mediated the effects of objective indicators of neighborhood disadvantage and affluence on health in a nationally representative study (Weden et al., 2008). Neighborhood characteristics may be more salient for some individuals. For example, Schieman and Meersman (2004) proposed that older adults may be more susceptible to stress in a disadvantageous neighborhood because of functional limitations and/or health ailments that reduce mastery and control and increase vulnerability perceptions.
To better understand the subjective aspects of neighborhoods which relate to health, Mujahid, Roux, Morenoff, and Raghunathan (2007) developed a measure based on Roux’s (2003) conceptual model of physical and social environmental factors. Stress features prominently as a pathway through which neighborhood physical and social characteristics affect outcomes (Diez Roux and Mair, 2010). Diez Roux proposed that a neighborhood’s “aesthetic quality (e.g., the presence of green spaces, interesting features, and pleasant surroundings) may also be related to the experience of stress [i.e., frequency of stressor exposure, severity] or the ability to recover after exposure to stressors [i.e., increased NA following a stressor relative to non-stressor periods, persistence of NA elevations after stressors]” (2003, p. 572). Similarly, this model proposes that characteristics of the social environment including neighborhood safety (e.g., feeling safe walking at night or day), violence (e.g., incidences of attacks or fights in the neighborhood), and social cohesion (e.g., neighbors’ willingness to help and trust each other), may also be related to health outcomes through a pathway of stressor exposure and response.
In the present study, we employed Mujahid and colleagues’ measure described above to evaluate which subjective neighborhood characteristics (i.e., aesthetic quality, social cohesion, safety, violence) predict exposure to stressors in daily life, stressor subjective severity, and intensity of NA responses to stressors.
Differences in Exposure, Severity, and Response to Stressors
Despite predictions pointing to the role of the social and physical environments in exposure to stress, and empirical work linking poor neighborhood quality indicators to negative outcomes, there is relatively little work testing neighborhood factors and daily stress process. These studies typically use either daily diary (e.g., participant completes a survey or phone interview each day for the study period in which he or she recalls experiences across the day) or ecological momentary assessment (EMA; e.g., participant completes multiple surveys throughout each day about current states and experiences over the last few hours). One example is an analysis of the Midlife in the United States National Study of Daily Experiences (MIDUS NSDE) study, in which participants completed daily diary interviews of their stressors and mood (Robinette et al., 2013). Consistent with an interpretation of neighborhood social cohesion as a resource, individuals who reported greater neighborhood cohesion reported less frequent daily stressor exposure, higher frequency positive affect (PA), and lower frequency NA. Cohesion was also inferred to buffer NA response to stressors – compared to individuals reporting moderate or high neighborhood cohesion, those who reported low social cohesion reported significantly greater NA on days they reported stressors (even when accounting for other social support indicators).
Relatively more research has been conducted on SES-related differences and this literature is relevant given the likelihood of SES-related residential segregation. Prior work in the MIDUS NSDE dataset (Grzywacz et al., 2004) unexpectedly found that individuals with higher education tended to report more frequent daily stressor exposure. On stressor days, however, those with lower education had higher levels of emotional distress and physical symptoms compared to those with higher education. Gallo, Bogart, Vranceanu, and Matthews’ (2005) EMA study of women examined differences in exposure and emotional responses to daily stressors across SES categories. They found low SES related to increased stress exposure. SES did not moderate NA response, although PA was reduced more when events occurred for low SES women. Another EMA study, however, found that higher SES workers reported greater subjective stress at work (Damaske et al., 2016). Unfortunately, however, the EMA studies did not include neighborhood measures and all three samples were majority white (i.e., Damaske et al.: 76%, Gallo et al.: 87%, Grzywacz et al. & Robinette et al.: > 90%).
In sum, there is evidence that daily stressor exposure and response are linked to neighborhood and SES. Roux’s model proposes neighborhood factors may influence not only stressor exposure and severity but also the ability to emotionally recover after stressor exposure. One way to address this idea of recovery, or lack thereof, is to examine how long NA is elevated after stressors. Recent work (Scott et al., 2017; Wrzus et al., 2015) has used stressor recency reports to distinguish the magnitude of NA elevations at varying time intervals after the event to better disentangle immediate emotional responses from persistent elevations. Diary studies do not have the temporal granularity to adequately disentangle reactivity from recovery (Sliwinski and Scott, 2014), but EMA sampling with stressor recency reports would provide insight into neighborhood effects on stressor exposure, severity, and intensity and persistence of NA response following stressors in daily life.
Present Study
We tested the association of perceived neighborhood characteristics to stressor exposure, severity, overall NA responses, along with persistence of NA response in daily life. Participants reported stressor exposure (i.e., whether a stressor occurred in previous few hours), severity (i.e., how stressful), and recency (i.e., how long ago), and current NA, five times daily for 14 days. We expected that an individual’s subjective ratings of lower neighborhood social cohesion and safety as well as higher ratings of violence would be associated with more frequent stressor exposure, higher stressor severity, and greater NA response. Because of interest in the time course of emotional response (in addition to magnitude), we conducted follow-up analyses to determine whether SES and neighborhood factors related to the timing of NA response. Exploratory analyses examined aesthetic quality as a predictor. To evaluate possible dissociations, we also examined the effects of SES on daily stress (i.e., exposure, severity, recency, and NA responses).
This sample is well-suited for testing predictions regarding SES and perceived neighborhood context. Previous studies have been primarily of non-Hispanic white samples and it is unclear whether these effects hold in other samples. Participants were recruited for this study from Co-Op City, a housing cooperative located in the Baychester area of Bronx, NY, using probability sampling of registered voter lists. This residential area is bordered by the Hutchinson River and Interstate 95; it is mixed in terms of income, race, and age, and includes both owners and renters, resulting in demographic heterogeneity (Hughes, 2016). Yet, the shared geographic context holds individuals constant on many structural aspects of the environment (i.e., transportation, public services), characteristics that are often confounded because of SES, race, and ethnicity-related residency clustering (Geronimus et al., 2001). Subjective aspects of the neighborhood (i.e., perceptions of safety, violence), however, may vary substantially across the approximately 40,000 residents living in the one square mile neighborhood (Population Division - New York City Department of City Planning, 2012). The sample is also age-heterogeneous, spanning young adulthood through early old age. Given predictions that age-related limitations may result in older adults being especially vulnerable to negative neighborhood factors, as well as the larger literature on age and daily stress, we also test age by neighborhood interactions.
Method
Participants
This study utilized data from the first wave of data collection from the Effects of Stress on Cognitive Aging, Physiology, and Emotion ([ESCAPE] Scott et al., 2015) study. Most participants completing this wave participated between May 2012–December 2013. Participants were recruited via systematic probability sampling of New York City Registered Voter Lists restricted to the zip code 10475. This sampling block covers more than 90% of individuals listed in Census tabulations for the Co-Op City area. Individuals were sent introductory letters and called to establish eligibility (i.e., age 25–65, ambulatory, fluent in English, free of visual impairment, Bronx County resident) and enroll.
The sample included 233 adults aged 25–65 (65% females; mean age: 47 years) and was representative of the sampling area (race-ethnicity: Non-Hispanic Black: 59%, Hispanic Black: 8%, Hispanic White: 20%, Non-Hispanic White: 8%, Other: 6%: Asian, American Indian, Alaska Native, Other; employment status: Employed: 52%, Unemployed, seeking work: 25%, Unemployed, not seeking work: 11%, Retired: 12%). The sample was diverse in terms of both education (Less than high school: 5.58%, High school or GED: 16.3%, Some college: 33.48%, College degree: 27.04%, Graduate or professional degree: 17.6%) and income (<$20,000: 21.38%, $20,000–$39,999: 23.79%, $40,000–$59,999: 20.00%, $60,000–$79,999: 12.76%, $80,000–$100,000: 6.90%, >$100,000: 8.28%).
Measures
Global assessments
Neighborhood context was assessed via four neighborhood scales from the larger Mujahid and colleagues’ (2007) subjective neighborhood measure. For aesthetic quality, social cohesion, and safety scales, participants rated how much they agreed with statements on a 1 - strongly agree to 5 - strongly disagree scale. Neighborhood aesthetic quality was assessed with five items (e.g., “There is a lot of trash and litter in my neighborhood”). Ross and Mirowsky (2001) used a similar assessment and termed this neighborhood cleanliness. Neighborhood social cohesion was assessed with four items (e.g., “People in my neighborhood can be trusted”). Neighborhood safety was assessed with three items (e.g., “My neighborhood is safe from crime”). Scales were created by calculating the means of the respective items. Higher scores on these scales represented higher aesthetic quality, social cohesion, and safety. The neighborhood violence scale used a different format (e.g., “During the last six months, how often was there a robbery or mugging in your neighborhood?”); participants rated the frequency of four events (i.e., mugging, fight with weapon, gang fight, sexual assault) in the last six months using a 1 - often to 4 - very rarely; items were reverse scored such that higher scores represented more frequent violence. The difference between the safety and violence scales was that the safety questions asked to report on general, overall, feelings of safety whereas the violence questions asked to report on more recent (i.e., during the last six months) and specific events. The scales had acceptable internal consistency reliability; Cronbach’s αs were the following: aesthetic quality = .79; social cohesion = .80; safety = .76; violence = .84.
Current SES was assessed via self-reported personal income (e.g., wages, bonuses, tips, social security, public assistance, disability pensions) and highest level of education completed. Participants also provided other demographics, including race, ethnicity, age, employment status, and gender.
Ecological momentary assessments
Participants completed ratings of current affect (i.e., how unhappy do you feel right now?) using a slider from not at all (0) to extremely (100) for each emotion. Negative affect was calculated as an average of the following items: tense/anxious, angry/hostile, depressed/blue, frustrated, unhappy. Participants reported stressor exposure in daily life by checking yes/no to “Did anything stressful occur since the last survey? A stressful event is any event, even a minor one, which negatively affected you.” If more than one event occurred since the last survey, participants were instructed to report on the most significant stressor. For stressor recency, participants selected whether it occurred 0–5, 5–10, 10–30, 30–60, or 60+ minutes ago. Beeps occurred approximately every two and half hours, thus this final category represented stressors occurring in a period of 60–150 minutes ago. They rated stressor severity in response to “How unpleasant was this for you?” using a slider, not at all unpleasant (0) to extremely unpleasant (100). Stressors were reported on 18.6% of beeps, 44.4% of days. Of these stressors, 7.7% occurred 0–5 minutes ago, 17.7% occurred 5–10 minutes ago, 25% occurred 10–30 minutes ago, 18.4% occurred 30–60 minutes ago, and 31.2% occurred more than 60 minutes ago. Indicators of current context were also assessed. Participants also reported on the presence of social partners (e.g., coworker, family, friends, nobody, partner, pet, other), current location (e.g., your home, work/school, other person’s home, vehicle, outside, other), and current activity (e.g., chores, work-related, socializing, eating/drinking, physical activity, grooming, self-care, resting, other).
Procedure
Participants were mailed a packet of self-report surveys, including the neighborhood questionnaire, to complete at home before visiting the research offices. During this visit, participants completed the demographic questionnaire and participated in 1.5 hours training on the smartphones. The EMA protocol involved completing five beeped surveys daily. After the training, participants returned home and completed two days of EMA data collection in which they became familiar with the protocol; compliance was assessed and those completing 80% of the smartphone surveys were invited into the 14-day study. Compliance was high; individuals completed an average of 85% of surveys. Participants completing the first wave received $160. The Institutional Review Boards at Einstein College of Medicine, Pennsylvania State University, University of South Florida, and Stony Brook University approved the collection and/or analysis of this data. Data were collected by Einstein College of Medicine in Bronx, NY between May 2012–December 2013; data were analyzed at Pennsylvania State University, University of South Florida, and Stony Brook University between November 2015–October 2017.
Analytic Approach
Because of the nested nature of the data – momentary reports of affect and stressors, nested within study days, nested within individuals who varied in perceptions of neighborhood, as well as SES, age, and other demographics – we used multilevel models (Bolger and Laurenceau, 2013; Hoffman, 2015) with maximum likelihood estimation method to test our hypotheses.
Differences in stressor frequency
To test whether individual differences in perceived neighborhood (e.g., social cohesion, safety, violence) or SES indicators (e.g., income, education) were associated with greater log odds of reporting a stressor (i.e., stressor exposure frequency), we conducted multilevel logistic models.
Differences in stressor severity
Next, we used multilevel models (MLMs) from surveys in which stressors were reported to test whether severity ratings of stressors were related to perceived neighborhood characteristics, income, and education.
Differences in negative emotional responses to stressors
Our next set of models tested the prediction that neighborhood characteristics or SES explain individual differences in individuals’ average NA across the study and moderate how much higher their NA is when a stressor has occurred (NA response). We used MLMs predicting momentary NA from stressor report, income, education, and neighborhood context. These models also produce estimates of individual differences in NA at non-stressor times.
Timing of differences in negative emotional responses to stressors
Similar to recent studies (Scott et al., 2017; Wrzus et al., 2015), we conducted exploratory models investigating the timing and persistence of emotional responses to stressors. In these MLMs, we modeled momentary NA from a categorical variable of stressor recency (reference category: no event), lagged stressor exposure (whether a stressor was reported at the prior survey), neighborhood, stressor recency-by-neighborhood interaction (i.e., neighborhood moderation), and lagged stressor-by-neighborhood interaction. Parallel stressor recency interactions were examined for income and education. Identifying time categories and lagged effects for which of these factors relate to differences in emotional response are present whether low income, education, or aspects of neighborhood quality are associated with greater NA at later periods post-stressor, suggesting longer response duration.
Neighborhood characteristics were examined in separate, parallel analyses for each of the models. In all the above MLMs, in addition to the predictors of interest, covariates for person characteristics (i.e., age, race-ethnicity, gender, employment status) and current context (i.e., social partner, location, activity) were included. Person-level covariates were selected based on our previous work examining the daily stress process and theoretical considerations around demographic characteristics. Given our attention to the larger context of neighborhood perceptions, we also covaried for micro-context in terms of the locations, activities, and social partners with which the individual was engaged when she or he reported on affect and stressors.
Results
Descriptive Statistics
Table 1 displays the means of and correlations among neighborhood characteristics, age, person-average NA, and person’s proportion of surveys in which stressors were reported. The sample category means for perceived neighborhood safety, cohesion, and aesthetic quality, were between three and four, representing average responses of “neutral” to “disagree.” The sample average category for perceived violence was two, representing reporting “sometimes” these events occurred in the last six months. Proportion of observations in which stressors were reported was significantly positively correlated with NA, age, and education but not with any of the neighborhood characteristics. Stressor severity was positively correlated with NA and neighborhood violence and negatively correlated with age, income, and neighborhood safety. NA was inversely correlated with income, neighborhood safety, social cohesion, aesthetic quality, and violence. Age was not significantly correlated with any of the neighborhood subscales. More education was associated with higher ratings of neighborhood social cohesion. Greater income was correlated with higher ratings of neighborhood safety, social cohesion, and aesthetic quality, and lower reports of neighborhood violence. Neighborhood safety, cohesion, and aesthetic quality, were positively correlated (range: r=0.23 to r=.62); neighborhood violence was negatively correlated with the other subscales (range: r=−0.16 to r=−0.53).
Table 1.
Descriptive Statistics and Correlations.
| 1. | 2. | 3. | 4. | 5. | 6. | 7. | 8. | 9. | 10. | |
|---|---|---|---|---|---|---|---|---|---|---|
| 1. Stressor Exposure | 0.17 (0.16) | |||||||||
| 2. Stressor Severity | 0.04 | 68.24 (18.43) | ||||||||
| 3. Negative Affect | 0.28** | 0.16* | 23.48 (16.00) | |||||||
| 4. Age | 0.13** | −0.16** | −0.06 | 46.77 (10.88) | ||||||
| 5. Education | 0.13* | −0.13 | −0.02 | 0.04 | Some college | |||||
| 6. Income | 0.02 | −0.27** | −0.16* | 0.02 | 0.37** | $40,000 –59,000 | ||||
| 7. Safety | −0.07 | −0.15* | −0.16* | −0.04 | 0.12 | 0.24** | 3.14 (0.90) | |||
| 8. Social Cohesion | 0.03 | −0.13 | −0.19* | 0.10 | 0.23** | 0.27** | 0.62** | 3.27 (0.76) | ||
| 9. Aesthetic Quality | −0.09 | −0.01 | −0.17* | 0.05 | 0.04 | 0.14* | 0.50** | 0.53** | 3.64 (0.78) | |
| 10. Violence | 0.08 | 0.16* | 0.20* | 0.07 | −0.08 | −0.16* | −0.53** | −0.36** | −0.40** | 2.02 (0.74) |
Note. Means (standard deviations) or median are reported in the diagonal. Off diagonals show correlations. Due to missing data effective sample size varied from 215 (Income) to 233 (Stressor exposure). Stressor severity is purposely missing in individuals with no stressors and the n for these correlations is 198. Person-averages were calculated for variables reported at momentary surveys (e.g., stressor exposure, stressor severity, negative affect). Stressor exposure represents the individual’s proportion of surveys in which they reported a stressor. Stressor severity represents the average self-reported severity. Negative Affect represents the individual’s average across all surveys. Education and income are categorical and the median value is provided. Spearman correlations are reported for these variables.
p < .001,
p < .05.
Differences in Stressor Exposure
Table 2 (Model 1) displays results from our separate models examining neighborhood and SES factors as predictors of stressor exposure. Neighborhood variables were not significantly related to exposure to stressors (ps>.16). The omnibus effects of education and income were not significantly related to stressor exposure (ps>.13; available in supplemental material).
Table 2.
Results from Separate Multilevel Models Using Neighborhood Context to Predict Stressor Exposure, Severity, and Negative Affect.
| Model 1: Stressor Frequency |
Model 2: Stressor Severity b (SE) |
||
|---|---|---|---|
| b (SE) | Odds ratio (95% CI) | ||
| Neighborhood variable | |||
| Safety | −0.151 (0.107) | .860 (0.700, 1.061) | −1.632 (1.601) |
| Social cohesion | −0.022 (0.133) | 1.021 (0.787, 1.327) | −1.478 (2.035) |
| Aesthetic Quality | −0.148 (0.122) | 1.144 (0.892, 1.468) | 0.704 (1.781) |
| Violence | 0.135 (0.127) | 0.973 (0.794, 1.193) | 3.955* (1.787) |
Note. Neighborhood variables were examined in separate models. Intercept values for stressor severity varied across models from 60.77 (safety) to 67.20 (violence). All models controlled for age, education level, income, race-ethnicity, work status, gender, and current context (see Supplemental Table 1).
p < .05.
Differences in Stressor Severity
Table 2 (Model 2) displays results from separate models examining neighborhood and SES factors predicting stressor severity. Neighborhood violence significantly predicted higher stressor severity scores (b=3.955, SE=1.787, p=.028, 95% CI: 0.427 to 7.483). Violence also significantly interacted with age (b=.402, SE=.183, p=.030, 95% CI: 0.04 to 0.76), such that older adults who perceived more violence tended to rate the stressors they reported in daily life as more severe. Neighborhood social cohesion and safety, as well as aesthetic quality, were not significant predictors of severity. Omnibus tests demonstrated that education, income, and race-ethnicity were not significantly related to stressor severity (ps>.13; available in supplemental material).
Differences in NA Response to Stressors
Table 3 displays the results for neighborhood characteristics and stressors on NA. The key test here was whether these characteristics moderated the effect of stressor exposure on NA (for example, the interaction between social cohesion and stressor exposure). Following prior work, the lagged stressor effect was also examined but neither neighborhood nor SES characteristics interacted with this predictor. For simplicity, this interaction was omitted from the final model as the pattern of results was unchanged. Significant interactions with stressor exposure were observed for neighborhood safety, aesthetic quality, and violence. Higher safety was related to lower NA response to stressors, whereas higher violence related to higher NA response. Greater perceived aesthetic quality related to lower NA response to stressors. Neither education, income, or race-ethnicity were significant moderators of the effect of stressor exposure on NA.
Table 3.
Negative Affect Responses to Stressor Exposure Moderated by Neighborhood Characteristics.
| Terms | Negative affect b (SE) |
|---|---|
| Neighborhood variable | |
| Safety | −2.039 (1.755) |
| Social cohesion | −3.288 (2.055) |
| Aesthetic Quality | −1.661 (1.974) |
| Violence | 0.916 (2.060) |
| Interactions with Stressor Exposure | |
| Safety × Stressor Exposure | −2.1208* (0.972) |
| Social Cohesion × Stressor Exposure | −1.734 (1.138) |
| Aesthetic Quality × Stressor Exposure | −2.280* (1.105) |
| Violence × Stressor Exposure | 4.099* (1.112) |
Note. This table summarizes the results of analyses testing for differences in negative emotional responses to stressors. Each neighborhood variable and its interactions with stressor exposure was examined in a separate model from other neighborhood variables. Intercept for negative affect for these models varied from 19.59 (aesthetic quality) to 23.99 (violence); the effect of exposure to stressors varied from 14.65 (safety) to 14.80 (aesthetic quality). All models controlled for age, education level, income, race-ethnicity, work status, gender, and current context (see Supplemental Table 1).
p < .05.
Follow-Up: Timing of Differences in NA Responses to Stressors
We examined whether neighborhood- and SES-related differences in NA responses were specific to stressors reported to have occurred more recently or held for stressors reported to have occurred at more distal time intervals (Table 4). Individuals rating their neighborhoods as higher in safety and lower in violence tended to show smaller increases in NA for specific stressor recency periods. In contrast to the results in Table 2, aesthetic quality was a significant predictor of NA response in this model which used stressor recency rather than the dichotomous stressor exposure: Those rating their neighborhood as having greater aesthetic quality showed less elevated NA response for more distal stressors (e.g., 30-60 minutes, 60-150 minutes). Neighborhood social cohesion was not a significant predictor of NA response to stressors across any of the time intervals examined. Figure 1 displays the differences in non-stressor NA and NA for stressors occurring at the given intervals for individuals rating their neighborhoods with one standard deviation above and below the sample mean on neighborhood safety, violence, and aesthetic quality. Individuals with the lowest level of education (< HS degree) showed the greatest increases in NA to stressors that occurred within five minutes of the survey (b=−17.72, SE = .30, p=.016, 95% CI: −32.06 to −3.37) compared to all other education levels. For other time intervals post-stressor, SES and race-ethnicity did not predict differences in elevation of NA relative to non-stressor times (available in supplemental material).
Table 4.
Negative Affect Responses to Stressors by Timing Moderated by Neighborhood Characteristics.
| Timing | Safety | Social cohesion | Violence | Aesthetic quality | |
|---|---|---|---|---|---|
| Neighborhood variable | — | −1.899 (1.765) | −4.266* (2.023) | 0.607 (2.092) | −1.567 (1.989) |
| Neighborhood variable × stressor timing interactions (ref = No stressor) | |||||
| 0–5 | −4.153* (1.69) | −2.417 (1.873) | 5.599* (1.908) | −1.141 (1.897) | |
| 5–10 | 1.759 (1.288) | −2.802 (1.453) | 2.556 (1.482) | −0.735 (1.379) | |
| 10–30 | −2.934* (1.215) | −1.373 (1.348) | 3.949* (1.355) | −1.179 (1.336) | |
| 30–60 | −1.696 (1.384) | −2.972 (1.541) | 3.851* (1.413) | −3.876* (1.471) | |
| 60–150 | −3.352* (1.125) | −1.372 (1.292) | 3.848* (1.264) | −3.793* (1.333) |
Note. This table summarizes the results of analyses testing timing of differences in negative emotional responses to stressors. Each neighborhood variable and its interactions with stressor exposure was examined in a separate model from other neighborhood variables. All models controlled for age, education level, income, race-ethnicity, work status, gender, and current context (see Supplemental Table 1). For readability, only the key predictors are displayed here. The table in the Supplemental file provides the full set of results for these models.
p < .05.
Figure 1.
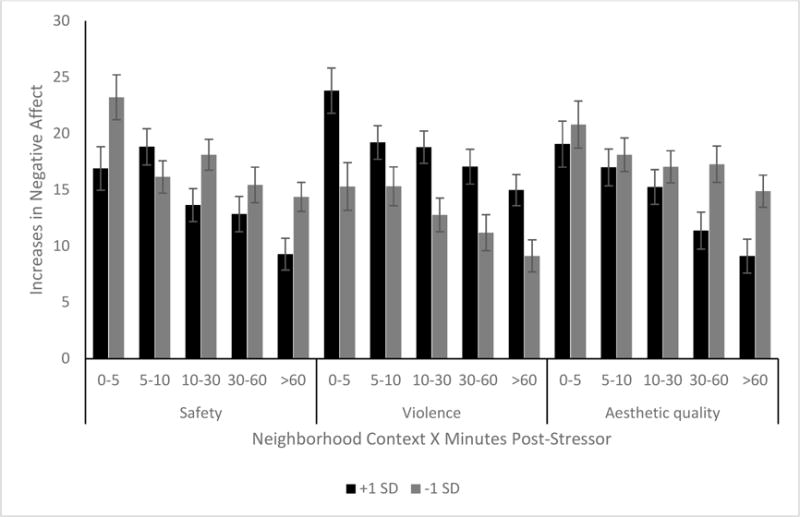
Neighborhood Contexts as Predictors of Negative Affect after Stressors Occurring 0–150 Minutes Ago.
Note. Y-axis displays the within-person slope for negative affect (NA) response to stressor – specifically, the increase in NA when a stressor was reported relative to a NA at a non-stressor observation. The first row of the X-axis displays stressor recency categories (i.e., stressors reported to have occurred 0–5, 5–10, 10–30, 30–60, and 60–150 minutes prior to the NA report). The second row of the X-axis displays the neighborhood contexts (e.g., safety, violence, aesthetic quality) which moderated the within-person slope of stressor recency on NA. The black shaded bars display estimates for individuals 1 standard deviation (SD) above the sample average on this neighborhood context. The gray shaded bars display estimates for individuals 1 SD below the sample average on this neighborhood context. Results from Table 4 displayed here indicate that lower safety, greater violence, and lower aesthetic quality significantly predicted increases in NA across specific stressor recency intervals.
Discussion
This study followed a socio-economically, ethnically, and racially diverse set of adults residing in the same urban zip code over a two-week period to examine how individual differences in perceived neighborhood characteristics may confer risk or protection to well-being in daily life. We tested whether perceived neighborhood safety, violence, social cohesion, and aesthetic quality were related to differential stressor exposure, severity, and immediate and later NA responses. Although individuals who perceived their neighborhoods differently reported similar stressor frequency (i.e., reported stressor exposure), neighborhood characteristics were associated with stressor severity and estimated responses in NA to stressors. These effects held when accounting for age, education, income, and racial and ethnic differences.
Similar Likelihood of Exposure, Different Severity Rating
We did not find evidence for neighborhood characteristics, income, or education predicting greater likelihood of stressor exposure, which suggests that the individuals in this sample who all resided within this shared geographic context reported similar rates of daily arguments, unexpected problems, and traffic or transportation stressors (assessed in this and many daily stress studies). Although one national study (Robinette et al., 2013) found greater social cohesion was associated with lower exposure to stressors in daily life, there are very few studies examining the role of neighborhood context on exposure. Notably, our study differs in location (i.e., specific zip code vs. U.S.), design (i.e., EMA vs. daily diary), and method (i.e., smartphone survey vs. telephone interview). SES has been associated with exposure to stressors and subjective stress in daily life in prior research, although somewhat contradictorily – some studies found higher education (Grzywacz et al., 2004) and higher SES (Damaske et al., 2016), whereas another found lower SES, were associated with greater stress (Gallo et al., 2005). Income and education were not significant predictors of exposure in the present study. One explanation is that, within this circumscribed geographic context, the assessed characteristics did not differentiate individuals’ exposure. This may mean that there are structural differences in daily stress exposure that we cannot uncover in the current study. For example, this zip code may be different from other surrounding zip codes given its socio- and demographic structure that may or may not confine its residents to greater stressor exposure compared to other geographic locations (Smith and Easterlow, 2005). Future research comparing daily stress experiences across locations is needed to disentangle this effect. Further, it may be important to examine other indices of neighborhood disadvantage (Ross and Mirowsky, 2001), specifically those describing context relative to surrounding neighborhoods (i.e., job opportunities, single-parent households). Although most participants were employed, 25% were seeking work during the study (2012–2013); this was higher than the unemployment rate for New York City (New York State Department of Labor, n.d.) or Bronx County (New York State Department of Labor, n.d.).
Although perceived neighborhood factors were not associated with stressor exposure, violence was associated with reported stressor severity. Individuals reporting greater neighborhood violence over the last six months rated their stressors as more severe; this association was stronger with older age. Although this finding fits broadly with the predictions that more adverse neighborhood contexts channel individuals into more negative daily experiences (i.e., objectively more severe daily stressors occur in the context of neighborhoods where more violence has happened), it is also possible that experiencing or being aware of more incidents of muggings and fights in the neighborhood may influence individuals to appraise their daily stressors as more severe. Exposure to adverse neighborhoods has also been proposed to activate feelings of alarm, threat, or vigilance (Augustin et al., 2008) that may make individuals more sensitive to perceiving negative events as more severe. Future investigations aimed at understanding the psychological or cognitive processes that underlie this link will be beneficial for possible intervention or prevention efforts.
Perceived neighborhood safety and violence subscales were, as would be expected, negatively correlated (r = −.53). Safety, however, did not predict differences in stressor severity. The neighborhood safety questions used in this study asked participants to rate how much they agreed with general statements about the safety of their neighborhood whereas the violence scale instructed them to recall events that occurred in the past six months. It is possible that this violence scale captured acute and recent experiences of violence that may, in turn, influence residents’ reports of stressor severity.
Neighborhood Characteristics Moderate NA Response
In the present sample, higher reported safety and aesthetic quality related to lower NA response to stressors, whereas those reporting higher levels of violence in the last six months showed higher NA response to stressors. Neighborhood characteristics were predicted to moderate NA responses, however, the specific aspects of neighborhood that differentiated responses to stressors found in this study are different from those found in prior work. For example, Robinette and colleagues (2013) found that neighborhood social cohesion was related to smaller increases in NA on stressor days, but we found no significant associations with social cohesion in this study.
In follow-up analyses using self-reported time-since-stressor, we found that individuals rating their neighborhoods as more adverse (i.e., lower safety or aesthetic quality, higher violence) reported significantly greater NA response for specific time-since-stressor intervals. These analyses were exploratory, extended from recent work examining the timing of age differences in response to daily stressors (Scott et al., 2017; Wrzus et al., 2015). Specificity in the time windows of response – age predicted individual differences responses to stressors occurring 10–150 minutes ago – was found in a prior paper in this dataset (Scott et al., 2017). The pattern for age differences holds when neighborhood factors were included, indicating that neighborhood characteristics and age uniquely explain differences in emotional responses to stressors. An interesting challenge will be for neighborhood theories to move to more dynamic predictions, particularly over short time scales (e.g., hours, days, weeks rather than decades). One way forward is to use recent methodological advances (Saeb et al., 2015) that permit the examination of time-varying location in order to examine how an individual’s exposure frequency, stressor severity, and response may vary as person moves from one neighborhood to another throughout the day (i.e., home, commute, work, shopping).
As noted above, our results are consistent with the general predictions of neighborhood context relating to both stressor severity and emotional response, but inconsistent with the specific neighborhood factors which predicted exposure and response. Our study differs from prior research in several ways – design (i.e., EMA with stressor recency vs. daily diary), sample (primarily Black and Hispanic-white vs. non-Hispanic white), sampling approach (i.e., probability sampling of an urban zip code vs. national). Our results point to the importance of subjective neighborhood context in understanding stress process – although the participants lived within a specific neighborhood, these differences in the ways they perceived their neighborhood related to stressor severity and emotional responses.
Limitations and Future Directions
Our measurement approach provides a brief snapshot of individual differences in life experiences and we do not know how factors prior to these experiences might have influenced the daily experiences we measured in this study. For example, social mobility factors may play a role on the timeframe in which participants were exposed to impoverished contexts (Hertzman et al., 2001) that may in turn influence susceptibility to responding negatively to daily stressors. Our results also warrant longitudinal follow-up over longer time-periods to better elucidate the directionality of these relationships. For example, exploring whether neighborhoods cause stress and/or whether individuals with particular stress profiles may be more likely to reside in a particular vicinity would adequately address how context and composition of residents within a context explains health disparities (Smith and Easterlow, 2005). In addition, a longitudinal follow-up using the EMA approach, such as with a measurement burst design (Sliwinski, 2008), would assist in identifying a critical or sensitive temporal period when an individual is at risk for the occurrence of illness or disease after exposure to daily neighborhood stressors. Incorporating this approach into future studies will further support that context of an individual is relevant to their health (Freeman and Anderson, 2017; Kaiser et al., 2016; Smith and Easterlow, 2005), but also assist in identifying a period where modification of neighborhood characteristics could delay the incidence of disease.
Future work should also extend self-reported neighborhood characteristics with objective measures. There is great opportunity to investigate everyday experiences nested within the broader contexts in which they occur. For example, are individuals affected more when the stressors occur while they are in their neighborhoods versus when they are away from them (e.g., work or school)? Likewise, future work should include neighborhood characteristics that were not assessed in the current study. For example, green-blue infrastructure (GBI) is increasingly becoming an environmental health initiative as more empirical evidence supports that green and/or blue spaces are associated with better aesthetic quality (White et al., 2010; Wolch et al., 2014), lower stress (Nutsford et al., 2016; Stigsdotter et al., 2010; van den Berg et al., 2010), positive affect (White et al., 2010). However, much of the existing literature has focused on the health and well-being benefits of green spaces and limited research has included the simultaneous benefits of blue spaces. Furthermore, it is unclear what the underlying mechanisms for the association between GBI and health/well-being, particularly within vulnerable populations (e.g., lower socioeconomic groups, elderly) are. Lastly, research is needed to explore whether GBI might serve as buffer against the perceptions of negative neighborhood characteristics (e.g., crime).
Conclusion
Neighborhoods are a context in which many of the experiences of life unfold, including stressors and responses to them. The current study suggests that, even among individuals living in a proximal geographic area, perceptions of neighborhood are related to the severity of stressors they report as well as their negative emotional responses to these stressors. This suggests that perceived neighborhood context may produce enduring influences on day-to-day experience that give rise to differences in risk and resilience over time, and may help explain a range of health disparities.
Supplementary Material
Research highlights.
Neighborhoods may impact stressor exposure, severity, and emotional response.
Higher neighborhood violence predicted higher stressor severity and response.
Higher neighborhood safety and aesthetic quality predicted weaker response.
Neighborhood perceptions predict well-being among people living in the same area.
Acknowledgments
Funding
This work was supported by the National Institutes of Health [R03AG050798 to S.B.S., R01AG039409 to M.J.S.]. The funding sources had no role in study design, collection, analysis, interpretation, writing, or decision to submit.
Footnotes
Publisher's Disclaimer: This is a PDF file of an unedited manuscript that has been accepted for publication. As a service to our customers we are providing this early version of the manuscript. The manuscript will undergo copyediting, typesetting, and review of the resulting proof before it is published in its final citable form. Please note that during the production process errors may be discovered which could affect the content, and all legal disclaimers that apply to the journal pertain.
Contributor Information
Stacey B. Scott, Department of Psychology, Stony Brook University
Elizabeth Munoz, Department of Psychology, University of California-Riverside.
Jacqueline A. Mogle, School of Nursing, Pennsylvania State University
Alyssa A. Gamaldo, Department of Human Development and Family Studies, Pennsylvania State University
Joshua M. Smyth, Department of Biobehavioral Health, Pennsylvania State University
David M. Almeida, Department of Human Development and Family Studies, Pennsylvania State University
Martin J. Sliwinski, Department of Human Development and Family Studies, Pennsylvania State University
References
- Almeida DM, Piazza JR, Stawski RS, Klein LC. The Speedometer of Life-Chapter 12:Stress, Health and Aging. In: Schaie KW, Willis SL, editors. Handbook of Psychology & Aging. Elsevier; New York, NY, US: 2011. pp. 191–206. [Google Scholar]
- Aneshensel CS. Advances in the Conceptualization of the Stress Process. Springer; New York, NY, US: 2010. Neighborhood as a Social Context of the Stress Process; pp. 35–52. [Google Scholar]
- Augustin T, Glass TA, James BD, Schwartz BS. Neighborhood Psychosocial Hazards and Cardiovascular Disease: The Baltimore Memory Study. Am J Public Health. 2008;98:1664–1670. doi: 10.2105/AJPH.2007.125138. [DOI] [PMC free article] [PubMed] [Google Scholar]
- Bolger N, Laurenceau JP. Intensive Longitudinal Methods: An Introduction to Diary and Experience Sampling Research. 1. The Guilford Press; New York, NY: 2013. [Google Scholar]
- Chen E, Miller GE. “Shift-and-Persist” Strategies Why Low Socioeconomic Status Isn’t Always Bad for Health. Perspect Psychol Sci. 2012;7:135–158. doi: 10.1177/1745691612436694. [DOI] [PMC free article] [PubMed] [Google Scholar]
- Choi YJ, Matz-Costa C. Perceived Neighborhood Safety, Social Cohesion, and Psychological Health of Older Adults. The Gerontologist. 2017 doi: 10.1093/geront/gnw187. [DOI] [PubMed] [Google Scholar]
- Cutrona CE, Wallace G, Wesner KA. Neighborhood Characteristics and Depression. Curr Dir Psychol Sci. 2006;15:188–192. doi: 10.1111/j.1467-8721.2006.00433.x. [DOI] [PMC free article] [PubMed] [Google Scholar]
- Damaske S, Zawadzki MJ, Smyth JM. Stress at work: Differential experiences of high versus low SES workers. Soc Sci Med. 2016;156:125–133. doi: 10.1016/j.socscimed.2016.03.010. [DOI] [PMC free article] [PubMed] [Google Scholar]
- Dannefer D. Cumulative Advantage/Disadvantage and the Life Course: Cross-Fertilizing Age and Social Science Theory. J Gerontol B Psychol Sci Soc Sci. 2003;58:S327–S337. doi: 10.1093/geronb/58.6.S327. [DOI] [PubMed] [Google Scholar]
- Diez Roux AV, Mair C. Neighborhoods and health. Ann N Y Acad Sci. 2010;1186:125–145. doi: 10.1111/j.1749-6632.2009.05333.x. [DOI] [PubMed] [Google Scholar]
- Elliott M. The stress process in neighborhood context. Health Place. 2000;6:287–299. doi: 10.1016/S1353-8292(00)00010-1. [DOI] [PubMed] [Google Scholar]
- Ferraro KF, Shippee TP. Aging and Cumulative Inequality: How Does Inequality Get Under the Skin? The Gerontologist. 2009;49:333–343. doi: 10.1093/geront/gnp034. [DOI] [PMC free article] [PubMed] [Google Scholar]
- Freeman Anderson K. Racial Residential Segregation and the Distribution of Health-Related Organizations in Urban Neighborhoods. Soc Probl. 2017;64:256–276. doi: 10.1093/socpro/spw058. [DOI] [Google Scholar]
- Gallo LC, Bogart LM, Vranceanu AM, Matthews KA. Socioeconomic Status, Resources, Psychological Experiences, and Emotional Responses: A Test of the Reserve Capacity Model. J Pers Soc Psychol. 2005;88:386–399. doi: 10.1037/0022-3514.88.2.386. doi: http://dx.doi.org.ezaccess.libraries.psu.edu/10.1037/0022-3514.88.2.386. [DOI] [PubMed] [Google Scholar]
- Gallo LC, Matthews KA. Do Negative Emotions Mediate the Association between Socioeconomic Status and Health? Ann N Y Acad Sci. 1999;896:226–245. doi: 10.1111/j.1749-6632.1999.tb08118.x. [DOI] [PubMed] [Google Scholar]
- Gee GC, Payne-Sturges DC. Environmental Health Disparities: A Framework Integrating Psychosocial and Environmental Concepts. Environ Health Perspect. 2004;112:1645–1653. doi: 10.1289/ehp.7074. [DOI] [PMC free article] [PubMed] [Google Scholar]
- Geronimus AT, Bound J, Waidmann TA, Colen CG, Steffick D. Inequality in Life Expectancy, Functional Status, and Active Life Expectancy across Selected Black and White Populations in the United States. Demography. 2001;38:227–251. doi: 10.1353/dem.2001.0015. [DOI] [PubMed] [Google Scholar]
- Geronimus AT, Hicken M, Pearson J, Seashols S, Brown K, Cruz T. Do US Black Women Experience Stress-Related Accelerated Biological Aging? Hum Nat. 2010;21:19–38. doi: 10.1007/s12110-010-9078-0. [DOI] [PMC free article] [PubMed] [Google Scholar]
- Goldman-Mellor S, Margerison-Zilko C, Allen K, Cerda M. Perceived and Objectively-Measured Neighborhood Violence and Adolescent Psychological Distress. J Urban Health. 2016;93:758–769. doi: 10.1007/s11524-016-0079-0. [DOI] [PMC free article] [PubMed] [Google Scholar]
- Grzywacz JG, Almeida DM, Neupert SD, Ettner SL. Socioeconomic Status and Health: A Micro-level Analysis o Exposure and Vulnerability to Daily Stressors. J Health Soc Behav. 2004;45:1–16. doi: 10.1177/002214650404500101. [DOI] [PubMed] [Google Scholar]
- Hertzman C, Power C, Matthews S, Manor O. Using an interactive framework of society and lifecourse to explain self-rated health in early adulthood. Soc Sci Med. 2001;53:1575–1585. doi: 10.1016/S0277-9536(00)00437-8. [DOI] [PubMed] [Google Scholar]
- Hoffman L. Longitudinal Analysis: Modeling Within-Person Fluctuation and Change, Multivariate Applications Series. Taylor and Francis; Hoboken: 2015. [Google Scholar]
- Hughes CJ. Co-op City for Affordability and Open Spaces. N Y Times 2016 [Google Scholar]
- Hughey SM, Walsemann KM, Child S, Powers A, Reed JA, Kaczynski AT. Using an environmental justice approach to examine the relationships between park availability and quality indicators, neighborhood disadvantage, and racial/ethnic composition. Landsc Urban Plan. 2016;148:159–169. doi: 10.1016/j.landurbplan.2015.12.016. [DOI] [Google Scholar]
- Kaiser P, Auchincloss AH, Moore K, Sánchez BN, Berrocal V, Allen N, Roux AVD. Associations of neighborhood socioeconomic and racial/ethnic characteristics with changes in survey-based neighborhood quality, 2000–2011. Health Place. 2016;42:30–36. doi: 10.1016/j.healthplace.2016.08.001. [DOI] [PMC free article] [PubMed] [Google Scholar]
- Kubzansky LD, Subramanian SV, Kawachi I, Fay ME, Soobader MJ, Berkman LF. Neighborhood Contextual Influences on Depressive Symptoms in the Elderly. Am J Epidemiol. 2005;162:253–260. doi: 10.1093/aje/kwi185. [DOI] [PubMed] [Google Scholar]
- Lazarus RS, Folkman S. Stress, appraisal, and coping. Springer Publishing Company; 1984. [Google Scholar]
- Mair C, Diez Roux AV, Morenoff JD. Neighborhood Stressors and Social Support as Predictors of Depressive Symptoms in the Chicago Community Adult Health Study. Health Place. 2010a;16:811–819. doi: 10.1016/j.healthplace.2010.04.006. [DOI] [PMC free article] [PubMed] [Google Scholar]
- Mair C, Diez Roux AV, Osypuk TL, Rapp SR, Seeman T, Watson KE. Is neighborhood racial/ethnic composition associated with depressive symptoms? The multi-ethnic study of atherosclerosis. Soc Sci Med 1982. 2010b;71:541–550. doi: 10.1016/j.socscimed.2010.04.014. [DOI] [PMC free article] [PubMed] [Google Scholar]
- McCoy DC, Roy AL, Raver CC. Neighborhood crime as a predictor of individual differences in emotional processing and regulation. Dev Sci. 2016;19:164–174. doi: 10.1111/desc.12287. [DOI] [PMC free article] [PubMed] [Google Scholar]
- Michimi A, Wimberly MC. Associations of supermarket accessibility with obesity and fruit and vegetable consumption in the conterminous United States. Int J Health Geogr. 2010;9:49. doi: 10.1186/1476-072X-9-49. [DOI] [PMC free article] [PubMed] [Google Scholar]
- Mujahid MS, Roux AVD, Morenoff JD, Raghunathan T. Assessing the Measurement Properties of Neighborhood Scales: From Psychometrics to Ecometrics. Am J Epidemiol. 2007;165:858–867. doi: 10.1093/aje/kwm040. [DOI] [PubMed] [Google Scholar]
- Myers HF. Ethnicity- and socio-economic status-related stresses in context: an integrative review and conceptual model. J Behav Med. 2009;32:9–19. doi: 10.1007/s10865-008-9181-4. [DOI] [PubMed] [Google Scholar]
- New York State Department of Labor. Unemployment rate: New York City n.d. [Google Scholar]
- New York State Department of Labor. Unemployment rate: Bronx County n.d. [Google Scholar]
- Nutsford D, Pearson AL, Kingham S, Reitsma F. Residential exposure to visible blue space (but not green space) associated with lower psychological distress in a capital city. Health Place. 2016;39:70–78. doi: 10.1016/j.healthplace.2016.03.002. [DOI] [PubMed] [Google Scholar]
- Population Division - New York City Department of City Planning. Table PL-P5 NTA: Total Population and Persons Per Acre - New York City Neighborhood Tabulation Areas, 2010 2012 [Google Scholar]
- Robinette JW, Charles ST, Almeida DM, Gruenewald TL. Neighborhood features and physiological risk: An examination of allostatic load. Health Place. 2016;41:110–118. doi: 10.1016/j.healthplace.2016.08.003. [DOI] [PMC free article] [PubMed] [Google Scholar]
- Robinette JW, Charles ST, Mogle JA, Almeida DM. Neighborhood cohesion and daily well-being: Results from a diary study. Soc Sci Med. 2013;96:174–182. doi: 10.1016/j.socscimed.2013.07.027. [DOI] [PMC free article] [PubMed] [Google Scholar]
- Ross CE, Mirowsky J. Neighborhood Disadvantage, Disorder, and Health. J Health Soc Behav. 2001;42:258–276. doi: 10.2307/3090214. [DOI] [PubMed] [Google Scholar]
- Roux AVD. Residential environments and cardiovascular risk. J Urban Health. 2003;80:569–589. doi: 10.1093/jurban/jtg065. [DOI] [PMC free article] [PubMed] [Google Scholar]
- Saeb S, Zhang M, Karr CJ, Schueller SM, Corden ME, Kording KP, Mohr DC. Mobile Phone Sensor Correlates of Depressive Symptom Severity in Daily-Life Behavior: An Exploratory Study. J Med Internet Res. 2015;17 doi: 10.2196/jmir.4273. [DOI] [PMC free article] [PubMed] [Google Scholar]
- Schafer MH, Ferraro KF. Childhood Misfortune as a Threat to Successful Aging: Avoiding Disease. The Gerontologist. 2012;52:111–120. doi: 10.1093/geront/gnr071. [DOI] [PMC free article] [PubMed] [Google Scholar]
- Schieman S, Meersman SC. Neighborhood Problems and Health Among Older Adults: Received and Donated Social Support and the Sense of Mastery as Effect Modifiers. J Gerontol B Psychol Sci Soc Sci. 2004;59:S89–S97. doi: 10.1093/geronb/59.2.S89. [DOI] [PubMed] [Google Scholar]
- Scott SB, Graham-Engeland JE, Engeland CG, Smyth JM, Almeida DM, Katz MJ, Lipton RB, Mogle JA, Munoz E, Ram N, Sliwinski MJ. The Effects of Stress on Cognitive Aging, Physiology and Emotion (ESCAPE) Project. BMC Psychiatry. 2015;15:146. doi: 10.1186/s12888-015-0497-7. [DOI] [PMC free article] [PubMed] [Google Scholar]
- Scott SB, Ram N, Smyth JM, Almeida DM, Sliwinski MJ. Age differences in negative emotional responses to daily stressors depend on time since event. Dev Psychol. 2017;53:177–190. doi: 10.1037/dev0000257. [DOI] [PMC free article] [PubMed] [Google Scholar]
- Singh GK, Siahpush M. Increasing inequalities in all-cause and cardiovascular mortality among US adults aged 25–64 years by area socioeconomic status, 1969–1998. Int J Epidemiol. 2002;31:600–613. doi: 10.1093/ije/31.3.600. [DOI] [PubMed] [Google Scholar]
- Sliwinski MJ. Measurement-Burst Designs for Social Health Research. Soc Personal Psychol Compass. 2008;2:245–261. doi: 10.1111/j.1751-9004.2007.00043.x. [DOI] [Google Scholar]
- Sliwinski MJ, Scott SB. Boundary conditions for emotional well-being in aging: The importance of daily stress. In: Verhaeghen P, Hertzog C, editors. Oxford Handbook of Emotion, Social Cognition, and Everyday Problem Solving during Adulthood. Oxford University Press; New York: 2014. pp. 128–141. [Google Scholar]
- Smith SJ, Easterlow D. The strange geography of health inequalities. Trans Inst Br Geogr. 2005;30:173–190. [Google Scholar]
- Stigsdotter UK, Ekholm O, Schipperijn J, Toftager M, Kamper-Jørgensen F, Randrup TB. Health promoting outdoor environments - Associations between green space, and health, health-related quality of life and stress based on a Danish national representative survey. Scand J Public Health. 2010;38:411–417. doi: 10.1177/1403494810367468. [DOI] [PubMed] [Google Scholar]
- Taylor SE, Repetti RL, Seeman T. HEALTH PSYCHOLOGY: What is an Unhealthy Environment and How Does It Get Under the Skin? Annu Rev Psychol. 1997;48:411–447. doi: 10.1146/annurev.psych.48.1.411. [DOI] [PubMed] [Google Scholar]
- van den Berg AE, Maas J, Verheij RA, Groenewegen PP. Green space as a buffer between stressful life events and health. Soc Sci Med. 2010;70:1203–1210. doi: 10.1016/j.socscimed.2010.01.002. [DOI] [PubMed] [Google Scholar]
- Weden MM, Carpiano RM, Robert SA. Subjective and objective neighborhood characteristics and adult health. Soc Sci Med. 2008;66:1256–1270. doi: 10.1016/j.socscimed.2007.11.041. doi: https://doi.org/10.1016/j.socscimed.2007.11.041. [DOI] [PubMed] [Google Scholar]
- White M, Smith A, Humphryes K, Pahl S, Snelling D, Depledge M. Blue space: The importance of water for preference, affect, and restorativeness ratings of natural and built scenes. J Environ Psychol. 2010;30:482–493. doi: 10.1016/j.jenvp.2010.04.004. [DOI] [Google Scholar]
- Williams DR, Collins C. Racial Residential Segregation: A Fundamental Cause of Racial Disparities in Health. Public Health Rep. 2001;116:404–416. doi: 10.1093/phr/116.5.404. [DOI] [PMC free article] [PubMed] [Google Scholar]
- Wolch JR, Byrne J, Newell JP. Urban green space, public health, and environmental justice: The challenge of making cities “just green enough”. Landsc Urban Plan. 2014;125:234–244. doi: 10.1016/j.landurbplan.2014.01.017. [DOI] [Google Scholar]
- Wrzus C, Luong G, Wagner GG, Riediger M. Can’t get it out of my head: Age differences in affective responsiveness vary with preoccupation and elapsed time after daily hassles. Emotion. 2015;15:257–269. doi: 10.1037/emo0000019. [DOI] [PubMed] [Google Scholar]
Associated Data
This section collects any data citations, data availability statements, or supplementary materials included in this article.