

Abstract
Biotin (vitamin B7) is essential for human health because of its involvement, as a cofactor, in a variety of critical cellular metabolic reactions. Previous studies have shown that biotin deficiency enhances inflammation, and certain chronic inflammatory diseases are associated with biotin deficiency; however, the mechanisms that mediate the association between biotin status and inflammation are not well understood. In this study, we examined the effect of biotin deficiency on human CD4+ T cell responses to determine their role in biotin deficiency–associated inflammation. Our investigations revealed that anti-CD3/CD28–stimulated CD4+ T cells cultured in biotin-deficient medium secreted significantly enhanced levels of the proinflammatory cytokines IFN-γ, TNF, and IL-17. Expression of the transcription factors T-bet and RORγt was increased, whereas Foxp3 expression was decreased, in biotin-deficient CD4+ T cells. The percentage of T regulatory cells was also decreased under biotin-deficient condition. A similar increase in T-bet, RORγt, and proinflammatory cytokine levels, as well as a decrease in Foxp3, was observed in inguinal lymph nodes of mice fed a biotin-deficient diet relative to pair-fed controls. Furthermore, differentiation of CD4+ T cells toward Th1 and Th17 cells was also enhanced. In vitro and in vivo investigations indicated that the increased inflammatory response was due to enhanced activation of the mammalian target of rapamycin signaling pathway in biotin-deficient CD4+ T cells. In summary, these results demonstrate that biotin deficiency enhances the inflammatory responses in CD4+ T cells, which may contribute to inflammation associated with biotin deficiency.
Biotin, a member of the water-soluble family of vitamins, plays critical roles in cell metabolism, proliferation, and survival. This micronutrient acts as a covalently bound coenzyme for five carboxylases (acetyl–CoA carboxylase α, acetyl–CoA carboxylase β, pyruvate carboxylase, propionyl–CoA carboxylase, and 3-methylcrotonyl–CoA carboxylase) that are involved in catalyzing critical steps in glucose, amino acid, and fatty acid metabolism (1). A role for biotin in the regulation of gene expression (including that of glucokinase, phosphoenolpyruvate carboxykinase, and ornithine transcarbamylase) has also been reported (2). Biotin deficiency leads to an array of pathological conditions, including dermal abnormalities and neurologic disorders (3, 4). Such deficiency occurs in a variety of conditions, including inflammatory bowel disease, chronic alcoholism, and inborn errors in biotin metabolism (5–8).
Previous studies, including recent findings from our laboratories, have highlighted the role of biotin in inflammation (9–13). In our investigations, we have shown that mice deficient in the intestinal biotin transporter SLC5A6 (all of which develop biotin deficiency) (14), as well as those that were made biotin deficient via dietary manipulation (12), display active intestinal inflammation similar to that observed in ulcerative colitis. We have also shown that, under biotin-deficient conditions, innate immune system cells (dendritic cells) produce increased levels of proinflammatory cytokines (9). The dendritic cells cultured under biotin-deficient conditions also primed T cells toward inflammatory Th1/Th17 responses; however, the direct effect of biotin deficiency on T cell responses was not determined. Reports from the literature indicate that biotin deficiency affects cytotoxic responses (15, 16), but there is a scarcity of information regarding the effect of biotin deficiency on CD4+ T cell function. CD4+ T lymphocytes play a key role in the induction and regulation of inflammatory responses. They can be divided into four major subsets (Th1/Th2/ Th17/T regulatory cells [Tregs]) based on the nature of their cytokine secretion and expression of signature transcription factors (TFs). Th1 cells primarily secrete IFN-γ under the control of the TF T-bet, whereas Th17 cells express the TF RORγt, and IL-17 is the major cytokine secreted by these cells (17). Th1 and Th17 subsets are considered highly inflammatory and have been demonstrated to have a major role in inducing autoimmune and inflammatory disorders, such as inflammatory bowel disease, multiple sclerosis, and rheumatoid arthritis (18). In contrast, Th2 cells are positive for the TF GATA-3 and produce cytokines IL-4 and IL-5, which are key players in allergic responses (19). Tregs express the TF Foxp3 and act as regulators of inflammation (20). The major function of Tregs is to suppress inflammation via secretion of anti-inflammatory cytokines IL-10 and TGF-β. Enhancing the induction of Tregs in autoimmune, inflammatory, and allergic disorders is considered an effective mode of treatment.
Given the critical role of CD4+ T lymphocytes in inflammatory responses and the propensity of biotin deficiency to enhance inflammation, we examined the effect of biotin deficiency on human CD4+ T lymphocyte function in vitro and confirmed our observations in vivo in mice.
Materials and Methods
Blood samples and animals
Blood from healthy volunteers was obtained through the Institute for Clinical and Translational Science, University of California, Irvine. The study was approved by the Institutional Review Board of the University of California, Irvine. Animal studies described in this article were carried out at the VA Medical Center (Long Beach, CA) and approved by their Animal Care and Use Committee.
Preparation of biotin-deficient medium
Serum-free AIM V medium containing gentamicin and streptomycin sulfate was purchased from Life Technologies. AIM V medium was mixed with streptavidin-agarose beads (Sigma-Aldrich, St. Louis, MO) at a 50:1 ratio and incubated at room temperature (RT) for 2–3 h to remove any traces of biotin, as described (9, 21). After incubation, medium was centrifuged at 2000 rpm for 5 min to settle the biotin–streptavidin complex. Subsequently, biotin-free medium was filtered using a vacuum-driven filtration system. This medium was considered biotin deficient, whereas the untreated medium was regarded as biotin-sufficient culture medium.
Isolation of PBMCs
Heparinized peripheral blood collected from healthy volunteers was diluted with HBSS. Thirty milliliters of diluted blood was carefully layered over 15 ml of lymphocyte separation solution in a 50-ml conical tube. The sample was centrifuged at 2000 rpm for 20 min at RT in a swinging bucket rotor without break. The mononuclear cell layer was collected in a separate 50-ml tube and washed with 20 ml of HBSS by centrifugation at 2000 rpm for 7 min. Supernatant was discarded, and the cell pellet was resuspended in 20 ml of HBSS and washed three times by centrifugation at 1000 rpm for 5 min. The cell pellet was resuspended in the appropriate amount of PBS containing 2% FBS and used for isolation of T cells.
Isolation, stimulation, and culture of CD4+ T lymphocytes
Human CD4+ T cells were isolated from PBMCs using a magnetic particle–based negative-selection kit (STEMCELL Technologies, Vancouver, BC, Canada). The purity of cells obtained by this method was routinely >90%. Cells were plated in 0.5 ml of biotin-sufficient and -deficient AIMV medium in a 48-well culture plate at a density of 0.5 × 10⁶ cells per well and stimulated with 20 μl/ml anti-CD3/CD28 Dynabeads (Invitrogen). The culture was incubated in a humidified incubator at 37°C supplied with 5% CO2 for 24 and 72 h; subsequently, the supernatant was collected for cytokine analysis, and cells were harvested for further analysis.
Cytokine analysis using ELISA
Levels of IFN-γ, TNF, IL-10, and IL-17 in the culture supernatant samples were evaluated using specific ELISA kits (BD Biosciences, San Diego, CA), as per the manufacturer’s instructions. Briefly, a 96-well plate was coated with 100 μl of specific capture Ab per well and incubated overnight at 4°C. Wells were washed three times with PBS containing 0.05% Tween 20 (PBST-20) and blocked with 200 μl of 10% FBS–PBS solution per well at RT for 1 h. Wells were washed three times with PBST-20, and 100 μl of diluted sample was added per well. Serially diluted standards were also added to the appropriate wells along with the samples and incubated at RT for 2 h. Wells were washed five times with PBST-20, and 100 μl of diluted detection Ab, along with streptavidin-HRP enzyme reagent, was added per well and incubated for 1 h at RT. Wells were washed again seven times using PBST-20, with a 1-min soaking time, 100 μl of substrate solution was added to each well, and the plate was incubated at RT for 20 min in the dark. The reaction was terminated by adding 50 μl of 1 N HCl per well, and OD was measured at 450-nm wavelength using a spectrophotometer.
Estimation of differential TFs of T cell subsets using quantitative real-time PCR
Total RNA was extracted from anti-CD3/CD28–stimulated human CD4+ T cells cultured in biotin-sufficient and -deficient AIM V medium for 72 h using TRIzol Reagent (Invitrogen), following the manufacturer’s protocol. cDNA was prepared from DNase I–treated RNA samples using an iScript kit (Bio-Rad, Hercules, CA). Quantitative real-time PCR was performed on a CFX96 Real-Time PCR system (Bio-Rad), as per the manufacturer’s instructions, using gene-specific primers for human T-bet, GATA-3, RORγt, Foxp3, and GAPDH (as internal control) (see Table I for a list of all primers). Relative gene expression was quantified by normalizing Ct values with the corresponding GAPDH value (22–24).
Table I.
Quantitative real-time PCR primers
| Gene Name | Forward and Reverse Primer Sequences (5′–3′) | Reference |
|---|---|---|
| Human T-bet | F: GATGTTTGTGGACGTGGTCTTG | (23) |
| R: CTTTCCACACTGCACCCACTT | ||
| Human GATA-3 | F: CTCCTCTCTGCTCTTCGCTACC | (23) |
| R: GACTCTGCAATTCTGCGAGCC | ||
| Human RORγt | F: CCCACAGAGACAGCACCGA | (23) |
| R: CCCACAGATTTTGCAAGGGA | ||
| Human FOXP3 | F: CTGACCAAGGCTTCATCTGTG | (22) |
| R: ACTCTGGGAATGTGCTGTTTC | ||
| Human GAPDH | F: CGACCACTTTGTCAAGCTCA | (24) |
| R: AGGGGAGATTCAGTGTGGTG | ||
| Mouse T-bet | F: TTCCCATTCCTGTCCTTCAC | (26) |
| R: CCACATCCACAAACATCCTG | ||
| Mouse GATA-3 | F: GGAAACTCCGTCAGGGCTA | (26) |
| R: AGAGATCCGTGCAGCAGAG | ||
| Mouse RORγt | F: TGAGGCCATTCAGTATGTGG | (26) |
| R: CTTCCATTGCTCCTGCTTTC | ||
| Mouse Foxp3 | F: CCTGCCTTGGTACATTCGTG | (26) |
| R: TGTTGTGGGTGAGTGCTTTG | ||
| Mouse GAPDH | F: TGTGTCCGTCGTGGATCTGA | (26) |
| R: CCTGCTTCACCACCTTCTTGAT |
F, forward; R, reverse.
Differentiation of CD4+ naive and memory T cells
Human CD4+ T cells were isolated from PBMCs using a negative-selection kit (STEMCELL Technologies). Purified CD4+ T cells were sorted into naive (CD4+CD45RA+CCR7+) and memory (CD4+CD45RA−) subsets using a BD FACSAria II cell sorter. CD4+ memory and naive T cells were differentiated into Th1 and Th17 subsets using CellXVivo Th1 and Th17 differentiation kits, according to the manufacturer’s protocol (R&D Systems, Minneapolis, MN). Naive CD4+ T cells were differentiated into Tregs by adding 20 ng/ml each TGF-β and IL-2, along with 10 nM retinoic acid (25).
Naive cells were incubated in a humidified incubator at 37°C supplied with 5% CO2 for 6 d, whereas memory cells were cultured for 3 d. After 3 and 6 d, culture supernatant was collected for cytokine analysis, and differentiated naive cells were harvested for intracellular cytokine staining.
Intracellular staining of IFN-γ, IL-17, and Foxp3
Human naive and total CD4+ T cells were stimulated with anti-CD3/CD28 beads and cultured in biotin-sufficient and -deficient AIM V media for 3–6 d, depending on the experiments. Cells were harvested and stimulated with 1 μg/ml ionomycin and 10 ng/ml PMA (Sigma-Aldrich) for 4 h. Brefeldin A (10 μg/ml) was added to the culture at the same time. Cells were washed with PBS and surface stained with anti-human CD4 PerCP mAb (BD Biosciences) for 30 min in the dark at RT. After washing with PBS, cells were fixed and permeabilized using Cytofix/Cytoperm buffer (BD Biosciences), as per the manufacturer’s instructions. Following the washing step, cells were intracellularly stained with FITC-labeled anti-human IFN-γ and Alexa Fluor 647–labeled anti-human IL-17 mAbs (BD Biosciences). FITC-conjugated mouse IgG2b and Alexa Fluor 647–conjugated IgG1 were used as isotype controls.
For staining of Tregs, unstimulated (0 h), stimulated (72 h), and naive (6 d) cells were collected and surface stained with anti-CD4 and anti-CD25 Abs (BD Biosciences). Subsequently, cells were permeabilized using BD Foxp3 buffer, as per the manufacturer’s protocol, and stained with PE-labeled Foxp3 mAbs. PE-conjugated mouse IgG1 was used as isotype control. Cells were acquired on a BD FACSCalibur flow cytometer, and data were analyzed using FlowJo software (TreeStar, Ashland, OR).
Cell-proliferation assay using CFSE staining
A total of 1 × 10⁶ CD4+ T cells per milliliter was isolated from PBMCs and stained with 2 μM CFSE dye for 10 min at RT. Cells were washed twice with PBS and stimulated with anti-CD3/CD28 Dynabeads. A total of 0.5 × 10⁶ cells per well was cultured in biotin-sufficient and -deficient AIM V media for 3 d at 37°C and 5% CO2. After 3 d, cells were collected, resuspended in 100 μl of PBS, stained with anti-human CD4 PerCP mAb for 30 min in the dark at RT, and acquired on a BD FACSCalibur flow cytometer. Proliferation was determined by measuring CFSE dilution. Analysis was performed using FlowJo software.
For measuring cell death, CD4 Ab–stained cells were incubated with 7-aminoactinomycin D (7-AAD) for 15 min and acquired on a flow cytometer.
Induction of dietary biotin deficiency in wild-type mice
Dietary biotin deficiency was induced in animals, as described previously (12). Briefly, weight-matched 4-wk-old male C57BL/6J mice (The Jackson Laboratory) were divided into two groups. The first group was allowed free access to a biotin-deficient diet (containing 30% egg white), whereas the other (control) group was fed an identical amount of diet supplemented with biotin (20 mg biotin/kg food; both from Dyets). After 16 wk of pair feeding, the biotin-deficient group developed classic symptoms of biotin deficiency (which includes alopecia, dermatitis around the mouth, and decreased growth rate), whereas all mice in the control group were normal and healthy.
Histopathology analysis in cecum of dietary biotin–deficient and pair-fed wild-type mice
The cecum of biotin-deficient mice and their pair-fed controls was collected immediately after euthanasia and fixed in 10% formalin overnight. Sections of the cecal wall were embedded in paraffin; H&E-stained slides were prepared by the Long Beach VAMC Histology Laboratory, as described previously (14). A board-certified anatomic pathologist performed microscopic evaluation of the blinded slides.
Quantitative real-time PCR of inguinal lymph nodes from diet-induced biotin-deficient mice
Inguinal lymph nodes were harvested from diet-induced biotin-deficient and pair-fed control mice. A single-cell suspension was recovered from each node, and total RNA was extracted from these cells using an RNeasy Mini Kit (QIAGEN, Santa Clarita, CA), following the manufacturer’s protocol. cDNA was prepared from DNase I–treated RNA samples using an iScript kit (Bio-Rad). Quantitative real-time PCR analysis was performed using a CFX96 real-time PCR system (Bio-Rad), as per the manufacturer’s instructions, using gene-specific primers for mouse Foxp3, RORγt, GATA-3, T-bet, and GAPDH (as internal control) (see Table I for a list of all primers). Relative gene expression was quantified by normalizing Ct values with the corresponding GAPDH value (26).
Estimation of phospho–mammalian target of rapamycin and phospho–p70S6 kinase expression in CD4+ T cells
Anti-CD3/CD28–stimulated CD4+ T cells were cultured in biotin-sufficient and -deficient media, with and without rapamycin (100 ng/ml), for 3 d. Supernatant was collected from all cells and stored for IFN-γ, IL-17, and IL-10 cytokine estimation; cells were resuspended in 100 μl of PBS and surface stained with anti-CD4 mAb for 30 min in the dark at RT. Cells were washed and fixed with 100 μl of BD Cytofix Buffer I for 10 min at 37°C. Subsequently, cells were washed and incubated with 250 μl of ice-cold BD Phosflow Perm Buffer III for 30 min at 4°C. After washing with PBS, cells were divided into two halves. One half was stained with Alexa Fluor 647–labeled anti-human phospho–mammalian target of rapamycin (mTOR), and the other half was incubated with rabbit anti-human phospho-p70S6 kinase and then mAb for 30 min in the dark. Cells were washed with PBS and stained with PE-labeled anti-rabbit secondary Ab for 30 min in the dark at RT. Alexa Fluor 647–conjugated mouse IgG1 was used as the isotype control. For p70S6 kinase, rabbit anti-human Ab, followed by PE-labeled secondary Ab, was used as the isotype control. After washing, cells were acquired on a flow cytometer, and data were analyzed using FlowJo software.
Estimation of proinflammatory cytokines and phospho-mTOR expression in inguinal lymph nodes of mice
Inguinal lymph nodes were harvested from diet induced biotin deficient and pair-fed control mice. Single cell suspension was recovered from the nodes. 2.5 × 10⁵ cells from each sample were cultured for 12 h in biotin deficient and sufficient RPMI 1640 medium containing 1 μg/ml ionomycin and 10 ng/ml of PMA. Supernatant was collected and level of IFN-γ and IL-17 was estimated using mouse ELISA kits. Rest of the cells were surface stained with FITC labeled anti mouse CD4 mAb for 30 min in dark at RT. Cells were washed, fix and permeabilized using the same method explained above. After washing with PBS, cells were incubated with rabbit anti-mouse phospho-mTOR Ab for 30 min at RT. Following washing step, cell were stained with PE labeled anti rabbit IgG secondary Ab for 30 min at RT in dark. Rabbit anti-human Ab, followed by PE-labeled secondary Ab, was used as the isotype control for phospho-mTOR. After washing, cells were acquired on a BD FACSCalibur flow cytometer, and data were analyzed using FlowJo software.
Statistical analysis
Statistical analysis was performed using GraphPad Prism software (https://www.graphpad.com/quickcalcs). Within-group differences between biotin- sufficient and -deficient conditions were tested using a paired t test; p ≤ 0.05 was considered significant. Each experiment was performed with at least four or five donors. Data are mean ± SEM of four or five separate sets of all experiments.
Results
Biotin deficiency enhances the secretion of proinflammatory cytokines from CD4+ cells
Because previous studies (9–12, 27) indicated a role for biotin deficiency in the activation of the inflammatory response, we determined the effect of biotin deficiency on cytokine secretion by CD4+ T cells. Anti-CD3/CD28–stimulated CD4+ T cells were cultured in biotin-deficient and regular media for 1 and 3 d. Supernatants were collected and assayed for IFN-γ, TNF, IL-17, and IL-10 cytokines using ELISA. As is evident from Fig. 1A, deficiency of biotin resulted in significantly increased secretion of the proinflammatory cytokines IFN-γ (p ≤ 0.05), TNF (p ≤ 0.05), and IL-17 (p ≤ 0.01) from CD4+ T cells compared with controls at 24 h; this was increased further at 72 h (Fig. 1A). No significant change in the level of the anti-inflammatory cytokine IL-10 was observed between the biotin-sufficient and -deficient groups (Fig. 1A). These results suggest that biotin deficiency induces an inflammatory response in CD4+ T cells.
FIGURE 1.

Biotin deficiency enhances proinflammatory cytokine secretion in anti-CD3/CD28–stimulated CD4+ T cells. CD4+ T cells were stimulated with CD3/CD28 magnetic beads and cultured in biotin-deficient and -sufficient AIM V medium for 24 and 72 h. (A) Bar graph depicts the levels of IFN-γ, TNF, IL-17, and IL-10 in the supernatants of CD4+ T cells cultured in biotin+ve (sufficient) and biotin−ve (deficient) media. (B) Bar graphs depict the levels of TFs T-bet, RORγt, Foxp3, and GATA-3 in the cells, as determined by quantitative real-time PCR. GAPDH was used as control. (C) Dot plots depict the percentages of CD4+CD25+Foxp3+ Tregs in unstimulated cells and cells stimulated for 72 h. (D) Bar graph depicts the cumulative percentage of Tregs. Data are mean ± SE of six experiments with different donors. *p ≤ 0.05, **p ≤ 0.01.
Secretion of cytokines by CD4+ T cells is controlled by different TFs. For example, increased Th1/IFN-γ secretion is associated with enhanced expression of T-bet, whereas RORγt expression dictates Th17/IL-17 secretion (19). Similarly, the TF Foxp3 is a marker of Tregs, whereas GATA-3 expression is associated with Th2 responses. Therefore, we confirmed whether the observed increase in the induction of IFN-γ, TNF, and IL-17 under biotin deficiency also led to changes in the expression of TFs in CD4+ T cells. We assayed the effect of biotin deficiency on TFs on CD4+ T cells stimulated with anti-CD3/CD28 beads using quantitative PCR (Fig. 1B, Table I). Our results indicate that biotin deficiency led to significantly enhanced expression of the TF T-bet (p ≤ 0.05) compared with the biotin-sufficient condition (Fig. 1B), whereas expression of GATA-3 was unaltered (Fig. 1B). The level of RORγt was also increased significantly (p < 0.05) in biotin-deficient CD4+ T cells compared with biotin-sufficient CD4+ T cells (Fig. 1B). In contrast, the expression of Foxp3 was significantly (p < 0.01) downregulated in biotin-deficient cells compared with biotin-sufficient cells (Fig. 1B). These observations suggest that biotin deficiency leads to enhanced expression of the TFs of inflammatory Th1 and Th17 phenotypes (T-bet and RORγt), whereas the expression of Foxp3, a marker of immunological tolerance, is decreased.
Because the PCR results revealed a decrease in Foxp3 expression (Fig 1B), we determined whether biotin deficiency led to a decrease in the number of Tregs. The induction of Tregs was investigated in unstimulated cells (0 h) and anti-CD3/CD28–stimulated CD4+ T cells (72 h), under biotin-sufficient and -deficient conditions (Fig. 1C, 1D), using flow cytometry. The percentage of CD4+CD25+Foxp3+ Tregs was decreased significantly (p ≤ 0.05) in CD4+ T cells cultured in biotin-deficient conditions relative to biotin-sufficient cells (Fig. 1C). The cumulative percentage of CD4+, CD25+, and Foxp3+ cells was also decreased significantly (p < 0.01) in biotin-deficient conditions compared with biotin-sufficient cells (Fig. 1D). These observations suggest that biotin deficiency enhances the secretion of proinflammatory cytokines, such as IFN-γ, IL-17, and TNF, from CD4+ T cells and decreases the induction of Tregs.
Biotin deficiency enhances the differentiation of naive and memory CD4+ T cells toward Th1 and Th17 cells
Next, we determined whether the observed increase in IFN-γ, IL-17, and TNF in biotin-deficient CD4+ T cells was a consequence of increased differentiation toward Th1 and Th17 cells. To investigate this, we evaluated the impact of biotin deficiency on naive and memory CD4+ T cell differentiation toward Th1 cells, Th17 cells, and Tregs. Naive and memory cells were cultured for 6 and 3 d, respectively, and supernatant was collected and assayed for IFN-γ, IL-10, and IL-17 cytokines (Fig. 2). Naive cells were also stained intracellularly. Intracellular IFN-γ expression in biotin-deficient Th1-differentiated naive CD4+ T cells was upregulated, whereas the expression of IL-17 was not detected (Fig. 2A). The level of IFN-γ in culture supernatants of naive and memory cells was increased significantly (p < 0.05) in biotin-deficient Th1-differentiated cells, whereas IL-17 was not detected in naive cells, and no significant changes were found in memory cells (Fig. 2A). Similarly, intracellular IL-17 expression was increased in biotin-deficient Th17-differentiated naive cells, whereas IFN-γ expression was not detected in the same conditions (Fig. 2B). The level of IL-17 was also significantly higher (p < 0.05) in the culture supernatants of memory and naive cells; however, IFN-γ was undetectable in naive cells and was comparable in memory cells (Fig. 2B). Expression of CD4+, CD25+, and FOXP3+ in naive T cells cultured in biotin-deficient Treg-differentiation medium was significantly decreased (p < 0.05) compared with biotin-sufficient cells (Fig. 2C). In keeping with this, IL-10 also displayed a significant decrease (p < 0.05) in naive CD4+ T cells in biotin deficiency, whereas IFN-γ levels were very low and comparable under both conditions (Fig. 2C). In contrast, IL-10 levels were comparable between memory T cells cultured under biotin-deficient and -sufficient conditions, and IFN-γ exhibited a significant increase (p < 0.05) in biotin-deficient conditions compared with biotin-sufficient cells (Fig. 2C). These findings suggest that biotin deficiency enhances the differentiation of naive and memory CD4+ T cells toward Th1 and Th17 cells and decreases the differentiation toward anti-inflammatory Tregs.
FIGURE 2.

Biotin deficiency enhances the differentiation of naive and memory CD4+ T cells toward Th1 and Th17 cells. Naive and memory CD4+ T cells were supplemented with factors inducing Th1, Th17, and Treg differentiation for 3 d (memory) and 6 d (naive). Intracellular staining for cytokines was performed after PMA and ionomycin stimulation. Culture supernatants was harvested, and the level of IFN-γ, IL-10, and IL-17 cytokines was evaluated by ELISA. (A) Th1 differentiation. (B) Th17 differentiation. (C). Treg differentiation. Data are mean ± SE of five experiments with different donors. *p < 0.05, **p < 0.01.
Biotin deficiency decreases the proliferation of CD4+ T cells
Because we observed increased differentiation of CD4+ T cells toward the Th1 or Th17 phenotype, we investigated whether biotin deficiency also enhanced the proliferation of CD4+ T cells to increase the inflammation. The proliferation of CD4+ T cells cultured under biotin-deficient and -sufficient conditions was determined by measuring CFSE dilution (Fig. 3). Our results indicate that biotin deficiency inhibited the proliferation of CD4+ T cells compared with biotin-sufficient cells (Fig. 3). CD4+ T cells cultured under biotin-sufficient conditions underwent seven divisions (Fig. 3). In contrast, cells cultured in biotin-deficient medium displayed initial proliferation in the first generation, but cell proliferation decreased during the subsequent divisions (Fig. 3). The mean fluorescence intensity of each generation was also found to be lower in the biotin-deficient group compared with the biotin-sufficient group. Reduced proliferation was not a consequence of cell death under biotin deficiency, because cell viability was >90% in biotin-deficient and -sufficient conditions, as measured by 7-AAD staining (Fig. 3B). These data indicated that biotin deficiency leads to a decrease in CD4+ T cell proliferation. Therefore, the increase in the production of inflammatory cytokines may be due to enhanced differentiation of CD4+ T cells toward the Th1 and Th17 phenotypes (Fig. 1).
FIGURE 3.
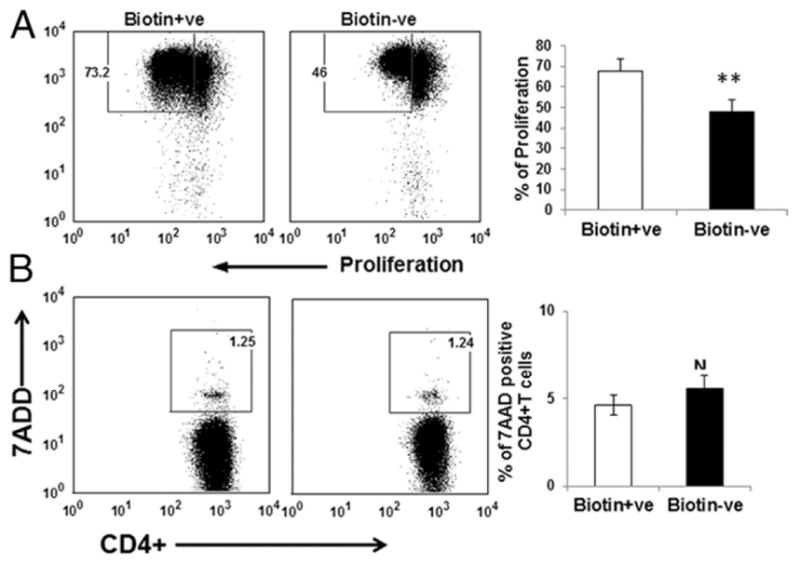
Biotin deficiency decreases the proliferation CD4+ T cells. CFSE-labeled CD4+ T cells were cultured in biotin-deficient and control medium for 72 h. (A) Dot plots depict the dilution of CFSE dye as a measure of proliferation. (B) CD4+ T cells cultured under biotin-deficient and -sufficient conditions for 72 h were stained with 7-AAD to determine cell death. Dot plots depict the percentage of 7-AAD+ T cells in the culture. Bar graph depicts the same. Data are mean ± SE of four experiments. *p < 0.05; **p < 0.01.
Biotin deficiency increases phospho-mTOR and phospho-p70S6 kinase expression in CD4+ T cells
Activation of T cells relies on intra- and intercellular signals from the surrounding environment, and these signals are assimilated by the evolutionarily conserved serine/threonine mTOR kinase and its downstream signaling molecule, p70S6 kinase, which regulates cell growth, proliferation, and survival (28). mTOR signaling has emerged as a critical inducer of inflammatory responses in CD4+ T cells. Because biotin deficiency enhanced the production of proinflammatory cytokines in CD4+ T cells, we evaluated the expression of phospho-mTOR and p70S6 kinase in CD4+ T cells cultured in biotin-sufficient and -deficient media (Fig. 4). We also evaluated the effect of the mTOR inhibitor rapamycin on the expression of these molecules in biotin-deficient cells.
FIGURE 4.

Biotin deficiency enhances the expression of phospho-mTOR, p70S6 kinase, and proinflammatory cytokines in anti-CD3/CD28–stimulated CD4+ T cells. CD4+ T cells were stimulated with anti-CD3/CD28 magnetic beads and cultured in biotin-deficient and -sufficient AIM V medium, with or without rapamycin (100 ng/ml), for 3 d (72 h). Intracellular levels of phospho-mTOR and p70S6 kinase were determined by flow cytometry. (A) Phospho-mTOR expression. (B) Phospho-p70S6 kinase expression. (C) Proinflammatory cytokines in control (B+ve), biotin-deficient (B−ve), B+ve with rapamycin, and B−ve with rapamycin CD4+ T cells. Data are mean ± SE of five experiments with different donors. *p < 0.05; **p < 0.01.
The expression of phospho-mTOR was significantly upregulated in biotin-deficient CD4+ T cells compared with the sufficient group and was inhibited by rapamycin (Fig. 4A). Similarly, p70S6 kinase exhibited significantly upregulated expression in biotin-deficient CD4+ T cells compared with the sufficient group (Fig. 4B). Addition of rapamycin was also able to inhibit this upregulation (Fig. 4B).
The levels of IFN-γ, IL-17, and IL-10 cytokines were also assayed in culture supernatants of biotin-deficient and -sufficient CD4+ T cells treated or not with rapamycin. Production of IFN-γ and IL-17 was significantly higher (p < 0.05) in biotin-deficient CD4+ T cells compared with the sufficient group (Fig. 4C). However, the levels of IFN-γ and IL-17 were significantly reduced in biotin-deficient cells treated with rapamycin compared with the biotin-deficient control group (Fig. 4C). The level of IL-10 was comparable in biotin-deficient and biotin-sufficient cells but was reduced significantly after treatment with rapamycin (Fig. 4C). These data indicate involvement of the mTOR-mediated signaling pathway in the increased production of proinflammatory cytokines in CD4+ T cells under biotin-deficient conditions.
Biotin deficiency enhances inflammation in the cecum and alters the expression of Th TFs and phospho-mTOR expression in inguinal lymph nodes of mice
We further confirmed our observations in vivo in mice by inducing biotin deficiency through feeding of a biotin-deficient diet. We (12) have previously reported that maximum chronic active inflammation during biotin deficiency is observed in the cecum. This could be due to high infiltration of immune cells in the cecum. Therefore, we quantified the number of CD4+ and CD8+ T cells in immunostained cecum samples from biotin-deficient mice. The number of CD4+ T cells was significantly increased in the cecum from biotin-deficient mice compared with the pair-fed control group (Fig. 5A, 5B). The number of CD8+ T cells was also slightly increased (Fig. 5A, 5B) in biotin-deficient mice, but this increase was less pronounced than the increase in CD4+ T cells. Neutrophil infiltration was also visible, which was described previously (12). These data suggest that CD4+ T cells are involved in enhancing active inflammation in vivo in biotin-deficient conditions.
FIGURE 5.

Biotin deficiency enhances inflammation in the cecum and alters the expression of Th TFs and phospho-mTOR in inguinal lymph nodes of mice. C57BL/6J wild-type mice were fed a biotin-sufficient or -deficient diet for 16 wk. Sections of the cecal wall were embedded in paraffin and stained with H&E (original magnification ×40). (A) Infiltration of neutrophils and CD4+ and CD8+ T cells in biotin-deficient and pair-fed control mice (DAB stain). (B) Number of CD4+ and CD8+ T cells in control and biotin-deficient mice cecum. (C) Inguinal lymph nodes were harvested from diet-induced biotin-sufficient and -deficient mice, and single-cell suspensions were prepared. Expression of TFs T-bet, RORγt, Foxp3, and GATA-3 was evaluated by quantitative real-time PCR. (D) Expression of phospho-mTOR. (E) Proinflammatory cytokine level in inguinal lymph nodes isolated from diet-induced biotin-deficient and pair-fed control mice. Data are mean ± SE of five mice. *p ≤ 0.05, **p ≤ 0.01.
Next, we determined whether biotin deficiency induced similar changes in TFs in vivo in CD4+ T cells as observed in vitro in human cells. Quantitative PCR of inguinal lymph nodes from biotin-deficient mice was used to determine the expression of TFs. Our results indicate that the expression of TFs for Th1 and Th17 (T-bet and RORγt) was significantly (p ≤ 0.05) upregulated (Fig. 5C) in biotin-deficient mice. In contrast, the expression of Foxp3 and GATA-3, TFs for Tregs and Th2, was significantly (p ≤ 0.01) decreased (Fig. 5C) in biotin-deficient mice compared with the respective control group.
Because we observed increased phospho-mTOR expression in our in vitro study, we further confirmed this finding in vivo. Expression of phospho-mTOR was significantly increased in CD4+ T cells isolated from the inguinal lymph nodes of diet-induced biotin-deficient mice compared with pair-fed controls (Fig. 5D). Additionally, the levels of IFN-γ and IL-17 were increased in culture supernatants of CD4+ T cells isolated from inguinal lymph nodes of biotin-deficient mice compared with the pair-fed control group (Fig. 5E). These observations suggest that biotin deficiency enhances the inflammatory response via activation of the mTOR signaling pathway in CD4+ T cells in vitro and in vivo. Furthermore, these data indicate that the changes in the proinflammatory response of CD4+ T cells are not limited to the mucosa-associated intestinal immune system but are also present in the systemic distant lymph nodes.
Discussion
Modern scientific studies have demonstrated the association between immune cell–mediated inflammatory function and micronutrient-mediated metabolic regulation (29). It has been well documented that nutritional and metabolic status influences immune cell function. For example, immune cell–mediated inflammation exhibited a close relationship with metabolic dysfunction in many pathological conditions, including type 2 diabetes, obesity, and atherosclerosis (30). Our previous studies indicate a role for biotin in inflammation (9, 12). In the current study, we examined the effect of biotin status on CD4+ T cell functions. Our investigations revealed that human CD4+ T cells cultured under biotin-deficient conditions develop an inflammatory phenotype. These cells display enhanced secretion of IFN-γ, TNF, and IL-17 proinflammatory cytokines, as well as an increase in the expression of the TFs T-bet and RORγt. The differentiation of naive and memory T cells toward Th1 and Th17 conditions was also enhanced (Fig 2A, 2B). Concomitantly, biotin deficiency decreased the expression of Foxp3 cells and the number of Tregs. Thus, it appears that biotin deficiency shifts the balance of Th cell responses toward Th1 and Th17 inflammatory cells and away from Tregs. We had previously reported that dendritic cells cultured in biotin-deficient medium displayed increased secretion of proinflammatory cytokines and induced Th1 and Th17 responses (9). Earlier studies had also reported enhanced secretion of TNF from murine macrophages cultured in biotin-deficient conditions (31). Thus, it seems that biotin deficiency induces an inflammatory phenotype in almost all immune cells.
Previous studies from our laboratories have shown enhanced intestinal inflammation in mice with deletion of the biotin transporter SLC5A6 (that develop biotin deficiency) and those made biotin deficient via dietary manipulations (12, 14). Furthermore, biotin deficiency is observed in patients with Crohn’s disease (32). Th1 and Th17 cells are well established as significant players in Crohn’s disease and colitis (33, 34). The accumulation of CD4+ T cells in the intestine of these mice compared with normal mice confirms the role of biotin deficiency in immune-mediated intestinal inflammation (Fig. 5A). In addition, increased expression of T-bet and RORγt and decreased Foxp3 expression in inguinal lymph nodes of diet-induced biotin-deficient mice suggest that the effect of biotin deficiency is not localized to the intestine, which is the site of biotin absorption, but, rather, is systemic. Therefore, biotin deficiency may be involved in the induction of autoimmune and inflammatory disorders throughout the body. Th1 and Th17 cells also play a major role in the pathology of other autoimmune disorders, such as rheumatoid arthritis (34–37). Recent articles have suggested an association between biotin deficiency and multiple sclerosis, an autoimmune disorder of the nervous system (13, 38). Thus, increased Th1 and Th17 cell numbers under biotin deficiency may be one of the mechanisms involved in the increased inflammation associated with biotin deficiency.
Interestingly, we observe decreased expression of GATA-3, which is not present in human cells, in murine T cells from inguinal lymph nodes. This could be due to the prolonged exposure of murine T cells to biotin-deficient conditions. It is well established that T-bet interacts with GATA-3 to inhibit transcription of Th2 cytokine genes and block Th2 development (39, 40). T-bet expression is upregulated in human and murine CD4+ T cells in biotin-deficient condition. However, repression of GATA-3 by T-bet may not be evident in human CD4+ T cells that are cultured in biotin-deficient conditions for only 72 h, but it is apparent in murine T cells that have been under continuous biotin-deficient conditions for 4 mo.
mTOR signaling plays a critical role in the determination of T cell fate (41–43). Recent studies pointed out that, in the absence of mTOR signaling, mouse CD4+ T cells were unable to differentiate into Th1 and Th17 cells in vitro or in vivo; however, the tendency of CD4+ T cells to differentiate toward the Th2 subset remains unaltered (44, 45). A recent study indicates that mTOR is also required for differentiation of human T cells toward Th17 cells, highlighting the importance of this pathway in the differentiation of T cells toward the inflammatory phenotype (46). Additionally, mTOR-deficient murine naive CD4+ T cells failed to differentiate into any Th lineage but rather differentiated toward inducible Tregs (47). Interestingly, dysfunction of mTOR signaling has been reported in various human autoimmune diseases (e.g., enhanced mTOR has been observed in T cells from patients with multiple sclerosis with a decrease in Treg numbers) (48). mTOR was also found to be activated in peripheral T cells in patients with systemic lupus erythematosus (49). Rapamycin is an inhibitor of mTOR signaling; an in vitro study revealed inhibition of IL-17 expression and increased expression of Tregs in systemic lupus erythematosus patients after exposure to rapamycin (50). Collectively, these observations pointed out the important role of mTOR in the induction of inflammatory CD4+ T cells. Therefore, increased mTOR and p70S6 kinase expression, as observed in the current investigation in CD4+ T cells cultured under biotin-deficient conditions in vitro and in vivo (Figs. 4, 5), might be responsible for the enhanced secretion of inflammatory cytokines IFN-γ, TNF, and IL-17 and the decreased percentages of Foxp3-expressing Tregs.
In conclusion, our findings show that biotin deficiency enhances the proinflammatory response in human CD4+ T lymphocytes. It also leads to the activation of mTOR signaling in CD4+ T cells, which leads to the production of increased levels of proinflammatory cytokines IFN-γ, TNF, and IL-17 and decreased expression of Tregs. This study provides insight into the possible mechanism of active inflammation in the gut induced by biotin deficiency.
Acknowledgments
We thank the Institute for Clinical and Translational Science, University of California, Irvine for providing blood samples.
This work was supported by grants from the Department of Veterans Affairs (to H.M.S.), the National Institutes of Health (Grant AG045216 to A.A. and Grants DK58057, DK56057, and AA018071 to H.M.S.), the National Center for Research Resources, and the National Center for Advancing Translational Sciences (Grant UL1 TR000153 to A.A.).
Abbreviations used in this article
- 7-AAD
7-aminoactinomycin D
- mTOR
mammalian target of rapamycin
- PBST-20
PBS containing 0.05% Tween 20
- RT
room temperature
- TF
transcription factor
- Treg
T regulatory cell
Footnotes
The content is solely the responsibility of the authors and does not necessarily represent the official views of the National Institutes of Health.
Disclosures
The authors have no financial conflicts of interest.
References
- 1.Zempleni J, Mock DM. Biotin biochemistry and human requirements. J Nutr Biochem. 1999;10:128–138. doi: 10.1016/s0955-2863(98)00095-3. [DOI] [PubMed] [Google Scholar]
- 2.Dakshinamurti K. Regulation of gene expression by biotin, vitamin B6 and vitamin C. In: Zempleni J, Daniels H, editors. Molecular Nutrition. CABI; Wallingford, U.K: 2003. pp. 151–166. [Google Scholar]
- 3.Said HM. Biotin: biochemical, physiological and clinical aspects. Subcell Biochem. 2012;56:1–19. doi: 10.1007/978-94-007-2199-9_1. [DOI] [PubMed] [Google Scholar]
- 4.Sweetman L, Nyhan WL. Inheritable biotin-treatable disorders and associated phenomena. Annu Rev Nutr. 1986;6:317–343. doi: 10.1146/annurev.nu.06.070186.001533. [DOI] [PubMed] [Google Scholar]
- 5.Abad-Lacruz A, Fernandez-Bañares F, Cabre E, Gil A, Esteve M, Gonzalez-Huix F, Xiol X, Gassull MA. The effect of total enteral tube feeding on the vitamin status of malnourished patients with inflammatory bowel disease. Int J Vitam Nutr Res. 1988;58:428–435. [PubMed] [Google Scholar]
- 6.Bonjour JP. Vitamins and alcoholism. V. Riboflavin, VI. Niacin, VII. Pantothenic acid, and VIII. Biotin. Int J Vitam Nutr Res. 1980;50:425–440. [PubMed] [Google Scholar]
- 7.Cowan MJ, Wara DW, Packman S, Ammann AJ, Yoshino M, Sweetman L, Nyhan W. Multiple biotin-dependent carboxylase deficiencies associated with defects in T-cell and B-cell immunity. Lancet. 1979;2:115–118. doi: 10.1016/s0140-6736(79)90002-3. [DOI] [PubMed] [Google Scholar]
- 8.Fernandez-Banares F, Abad-Lacruz A, Xiol X, Gine JJ, Dolz C, Cabre E, Esteve M, Gonzalez-Huix F, Gassull MA. Vitamin status in patients with inflammatory bowel disease. Am J Gastroenterol. 1989;84:744–748. [PubMed] [Google Scholar]
- 9.Agrawal S, Agrawal A, Said HM. Biotin deficiency enhances the inflammatory response of human dendritic cells. Am J Physiol Cell Physiol. 2016;311:C386–C391. doi: 10.1152/ajpcell.00141.2016. [DOI] [PMC free article] [PubMed] [Google Scholar]
- 10.Kuroishi T. Regulation of immunological and inflammatory functions by biotin. Can J Physiol Pharmacol. 2015;93:1091–1096. doi: 10.1139/cjpp-2014-0460. [DOI] [PubMed] [Google Scholar]
- 11.Dakshinamurti K, Bagchi RA, Abrenica B, Czubryt MP. Microarray analysis of pancreatic gene expression during biotin repletion in biotin-deficient rats. Can J Physiol Pharmacol. 2015;93:1103–1110. doi: 10.1139/cjpp-2014-0517. [DOI] [PubMed] [Google Scholar]
- 12.Sabui S, Bohl JA, Kapadia R, Cogburn K, Ghosal A, Lambrecht NW, Said HM. Role of the sodium-dependent multivitamin transporter (SMVT) in the maintenance of intestinal mucosal integrity. Am J Physiol Gastrointest Liver Physiol. 2016;311:G561–G570. doi: 10.1152/ajpgi.00240.2016. [DOI] [PMC free article] [PubMed] [Google Scholar]
- 13.Peyro Saint Paul L, Debruyne D, Bernard D, Mock DM, Defer GL. Pharmacokinetics and pharmacodynamics of MD1003 (high-dose biotin) in the treatment of progressive multiple sclerosis. Expert Opin Drug Metab Toxicol. 2016;12:327–344. doi: 10.1517/17425255.2016.1136288. [DOI] [PubMed] [Google Scholar]
- 14.Ghosal A, Lambrecht N, Subramanya SB, Kapadia R, Said HM. Conditional knockout of the Slc5a6 gene in mouse intestine impairs biotin absorption. Am J Physiol Gastrointest Liver Physiol. 2013;304:G64–G71. doi: 10.1152/ajpgi.00379.2012. [DOI] [PMC free article] [PubMed] [Google Scholar]
- 15.Ginsburg CH, Dambrauskas JT, Ault KA, Falchuk ZM. Impaired natural killer cell activity in patients with inflammatory bowel disease: evidence for a qualitative defect. Gastroenterology. 1983;85:846–851. [PubMed] [Google Scholar]
- 16.Kung JT, Mackenzie CG, Talmage DW. The requirement for biotin and fatty acids in the cytotoxic T-cell response. Cell Immunol. 1979;48:100–110. doi: 10.1016/0008-8749(79)90103-5. [DOI] [PubMed] [Google Scholar]
- 17.Zhu J, Paul WE. Peripheral CD4+ T-cell differentiation regulated by networks of cytokines and transcription factors. Immunol Rev. 2010;238:247–262. doi: 10.1111/j.1600-065X.2010.00951.x. [DOI] [PMC free article] [PubMed] [Google Scholar]
- 18.Damsker JM, Hansen AM, Caspi RR. Th1 and Th17 cells: adversaries and collaborators. Ann N Y Acad Sci. 2010;1183:211–221. doi: 10.1111/j.1749-6632.2009.05133.x. [DOI] [PMC free article] [PubMed] [Google Scholar]
- 19.Zhu J, Yamane H, Paul WE. Differentiation of effector CD4 T cell populations (*) Annu Rev Immunol. 2010;28:445–489. doi: 10.1146/annurev-immunol-030409-101212. [DOI] [PMC free article] [PubMed] [Google Scholar]
- 20.Tanaka A, Sakaguchi S. Regulatory T cells in cancer immunotherapy. Cell Res. 2017;27:109–118. doi: 10.1038/cr.2016.151. [DOI] [PMC free article] [PubMed] [Google Scholar]
- 21.Helm RM, Mock NI, Simpson P, Mock DM. Certain immune markers are not good indicators of mild to moderate biotin deficiency in rats. J Nutr. 2001;131:3231–3236. doi: 10.1093/jn/131.12.3231. [DOI] [PubMed] [Google Scholar]
- 22.Ma L, Xue HB, Guan XH, Shu CM, Wang F, Zhang JH, An RZ. The imbalance of Th17 cells and CD4(+) CD25(high) Foxp3(+) Treg cells in patients with atopic dermatitis. J Eur Acad Dermatol Venereol. 2014;28:1079–1086. doi: 10.1111/jdv.12288. [DOI] [PubMed] [Google Scholar]
- 23.Miahipour A, Haji-Fatahaliha M, Keshavarz H, Gharavi MJ, Mohamadi H, Babaloo Z, Rafati S, Younesi V, Hosseini M, Yousefi M. T helper 1 (Th1), Th2, and Th17 responses to Leishmania major lipophosphoglycan 3. Immunol Invest. 2016;45:692–702. doi: 10.1080/08820139.2016.1208217. [DOI] [PubMed] [Google Scholar]
- 24.Zhou X, Jiang Y, Lu L, Ding Q, Jiao Z, Zhou Y, Xin L, Chou KY. MHC class II transactivator represses human IL-4 gene transcription by interruption of promoter binding with CBP/p300, STAT6 and NFAT1 via histone hypoacetylation. Immunology. 2007;122:476–485. doi: 10.1111/j.1365-2567.2007.02674.x. [DOI] [PMC free article] [PubMed] [Google Scholar]
- 25.Benson MJ, Pino-Lagos K, Rosemblatt M, Noelle RJ. All-trans retinoic acid mediates enhanced T reg cell growth, differentiation, and gut homing in the face of high levels of co-stimulation. J Exp Med. 2007;204:1765–1774. doi: 10.1084/jem.20070719. [DOI] [PMC free article] [PubMed] [Google Scholar]
- 26.Ano S, Morishima Y, Ishii Y, Yoh K, Yageta Y, Ohtsuka S, Matsuyama M, Kawaguchi M, Takahashi S, Hizawa N. Transcription factors GATA-3 and RORγt are important for determining the phenotype of allergic airway inflammation in a murine model of asthma. J Immunol. 2013;190:1056–1065. doi: 10.4049/jimmunol.1202386. [DOI] [PubMed] [Google Scholar]
- 27.Mock DM. Biotin: from nutrition to therapeutics. J Nutr. 2017;147:1487–1492. doi: 10.3945/jn.116.238956. [DOI] [PMC free article] [PubMed] [Google Scholar]
- 28.Laplante M, Sabatini DM. mTOR signaling in growth control and disease. Cell. 2012;149:274–293. doi: 10.1016/j.cell.2012.03.017. [DOI] [PMC free article] [PubMed] [Google Scholar]
- 29.Hotamisligil GS, Erbay E. Nutrient sensing and inflammation in metabolic diseases. Nat Rev Immunol. 2008;8:923–934. doi: 10.1038/nri2449. [DOI] [PMC free article] [PubMed] [Google Scholar]
- 30.Baker RG, Hayden MS, Ghosh S. NF-κB, inflammation, and metabolic disease. Cell Metab. 2011;13:11–22. doi: 10.1016/j.cmet.2010.12.008. [DOI] [PMC free article] [PubMed] [Google Scholar]
- 31.Kuroishi T, Endo Y, Muramoto K, Sugawara S. Biotin deficiency upregulates TNF-alpha production in murine macrophages. J Leukoc Biol. 2008;83:912–920. doi: 10.1189/jlb.0607428. [DOI] [PubMed] [Google Scholar]
- 32.Okabe N, Urabe K, Fujita K, Yamamoto T, Yao T, Doi S. Biotin effects in Crohn’s disease. Dig Dis Sci. 1988;33:1495–1496. doi: 10.1007/BF01537009. [DOI] [PubMed] [Google Scholar]
- 33.Brand S. Crohn’s disease: Th1, Th17 or both? The change of a paradigm: new immunological and genetic insights implicate Th17 cells in the pathogenesis of Crohn’s disease. Gut. 2009;58:1152–1167. doi: 10.1136/gut.2008.163667. [DOI] [PubMed] [Google Scholar]
- 34.Siakavellas SI, Bamias G. Role of the IL-23/IL-17 axis in Crohn’s disease. Discov Med. 2012;14:253–262. [PubMed] [Google Scholar]
- 35.Hirahara K, Nakayama T. CD4+ T-cell subsets in inflammatory diseases: beyond the Th1/Th2 paradigm. Int Immunol. 2016;28:163–171. doi: 10.1093/intimm/dxw006. [DOI] [PMC free article] [PubMed] [Google Scholar]
- 36.Pappu R, Rutz S, Ouyang W. Regulation of epithelial immunity by IL-17 family cytokines. Trends Immunol. 2012;33:343–349. doi: 10.1016/j.it.2012.02.008. [DOI] [PubMed] [Google Scholar]
- 37.Wilke CM, Bishop K, Fox D, Zou W. Deciphering the role of Th17 cells in human disease. Trends Immunol. 2011;32:603–611. doi: 10.1016/j.it.2011.08.003. [DOI] [PMC free article] [PubMed] [Google Scholar]
- 38.Sedel F, Bernard D, Mock DM, Tourbah A. Targeting demyelination and virtual hypoxia with high-dose biotin as a treatment for progressive multiple sclerosis. Neuropharmacology. 2016;110:644–653. doi: 10.1016/j.neuropharm.2015.08.028. [DOI] [PubMed] [Google Scholar]
- 39.Hwang ES, Szabo SJ, Schwartzberg PL, Glimcher LH. T helper cell fate specified by kinase-mediated interaction of T-bet with GATA-3. Science. 2005;307:430–433. doi: 10.1126/science.1103336. [DOI] [PubMed] [Google Scholar]
- 40.Jenner RG, Townsend MJ, Jackson I, Sun K, Bouwman RD, Young RA, Glimcher LH, Lord GM. The transcription factors T-bet and GATA-3 control alternative pathways of T-cell differentiation through a shared set of target genes. Proc Natl Acad Sci USA. 2009;106:17876–17881. doi: 10.1073/pnas.0909357106. [DOI] [PMC free article] [PubMed] [Google Scholar]
- 41.Pollizzi KN, Powell JD. Regulation of T cells by mTOR: the known knowns and the known unknowns. Trends Immunol. 2015;36:13–20. doi: 10.1016/j.it.2014.11.005. [DOI] [PMC free article] [PubMed] [Google Scholar]
- 42.Ren W, Yin J, Duan J, Liu G, Tan B, Yang G, Wu G, Bazer FW, Peng Y, Yin Y. mTORC1 signaling and IL-17 expression: defining pathways and possible therapeutic targets. Eur J Immunol. 2016;46:291–299. doi: 10.1002/eji.201545886. [DOI] [PubMed] [Google Scholar]
- 43.Zeng H, Chi H. Metabolic control of regulatory T cell development and function. Trends Immunol. 2015;36:3–12. doi: 10.1016/j.it.2014.08.003. [DOI] [PMC free article] [PubMed] [Google Scholar]
- 44.Delgoffe GM, Pollizzi KN, Waickman AT, Heikamp E, Meyers DJ, Horton MR, Xiao B, Worley PF, Powell JD. The kinase mTOR regulates the differentiation of helper T cells through the selective activation of signaling by mTORC1 and mTORC2. Nat Immunol. 2011;12:295–303. doi: 10.1038/ni.2005. [DOI] [PMC free article] [PubMed] [Google Scholar]
- 45.Sasaki CY, Chen G, Munk R, Eitan E, Martindale J, Longo DL, Ghosh P. p(70S6K1) in the TORC1 pathway is essential for the differentiation of Th17 cells, but not Th1, Th2, or Treg cells in mice. Eur J Immunol. 2016;46:212–222. doi: 10.1002/eji.201445422. [DOI] [PMC free article] [PubMed] [Google Scholar]
- 46.Kastirr I, Crosti M, Maglie S, Paroni M, Steckel B, Moro M, Pagani M, Abrignani S, Geginat J. Signal strength and metabolic requirements control cytokine-induced Th17 differentiation of uncommitted human T cells. J Immunol. 2015;195:3617–3627. doi: 10.4049/jimmunol.1501016. [DOI] [PubMed] [Google Scholar]
- 47.Delgoffe GM, Kole TP, Zheng Y, Zarek PE, Matthews KL, Xiao B, Worley PF, Kozma SC, Powell JD. The mTOR kinase differentially regulates effector and regulatory T cell lineage commitment. Immunity. 2009;30:832–844. doi: 10.1016/j.immuni.2009.04.014. [DOI] [PMC free article] [PubMed] [Google Scholar]
- 48.Perl A. Activation of mTOR (mechanistic target of rapamycin) in rheumatic diseases. Nat Rev Rheumatol. 2016;12:169–182. doi: 10.1038/nrrheum.2015.172. [DOI] [PMC free article] [PubMed] [Google Scholar]
- 49.Perl A. mTOR activation is a biomarker and a central pathway to auto-immune disorders, cancer, obesity, and aging. Ann N Y Acad Sci. 2015;1346:33–44. doi: 10.1111/nyas.12756. [DOI] [PMC free article] [PubMed] [Google Scholar]
- 50.Kato H, Perl A. Mechanistic target of rapamycin complex 1 expands Th17 and IL-4+ CD4−CD8− double-negative T cells and contracts regulatory T cells in systemic lupus erythematosus. J Immunol. 2014;192:4134–4144. doi: 10.4049/jimmunol.1301859. [DOI] [PMC free article] [PubMed] [Google Scholar]