
Figure 4. c-Jun is increased and ITPR2 is decreased in livers of patients with NAFLD and NASH.
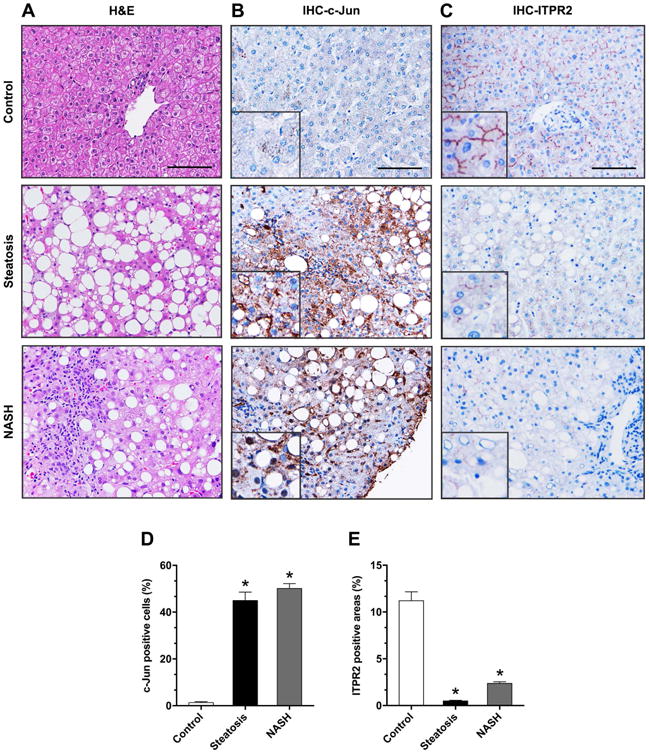
(A) Representative microscopic photographs of liver biopsy specimens from controls and patients with simple steatosis and NASH stained with H&E. Representative images of immunohistochemistry staining (IHC) of (B) c-Jun and (C) ITPR2 in liver samples. Images are representative of what was observed in 3-6 patients in each category. Scale bar: 100 μm. Quantitative analysis of IHC images stained for (D) c-Jun and (E) ITPR2. *p < 0.0001 (n = 3-6 patients).