Fig. 1.

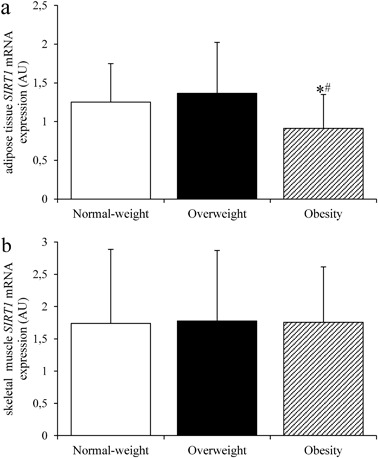
Adipose tissue (a) and skeletal muscle (b) SIRT1 mRNA expression in the study groups (n = 117). Data are expressed as means ± S.D. *p < 0.05 vs. normal-weight subjects; #p < 0.05 in the obese vs. overweight subjects

Adipose tissue (a) and skeletal muscle (b) SIRT1 mRNA expression in the study groups (n = 117). Data are expressed as means ± S.D. *p < 0.05 vs. normal-weight subjects; #p < 0.05 in the obese vs. overweight subjects