

Abstract
Tolvaptan, a vasopressin receptor 2 antagonist used to treat hyponatremia, has recently been reported to be associated with an increased risk of liver injury. In this study, we explored the underlying mechanisms of hepatotoxicity of tolvaptan using human HepG2 cells. Tolvaptan inhibited cell growth and caused cell death in a concentration- and time-dependent manner. Tolvaptan treatment led to delayed cell cycle progression, accompanied by decreased levels of several cyclins and cyclin-dependent kinases. Tolvaptan was found to cause DNA damage, as assessed by alkaline comet assays; this was confirmed by increased levels of 8-oxoguanine and phosphorylation of histone H2AX. Exposure of HepG2 cells to tolvaptan enhanced cytochrome C release and triggered apoptosis by modulating Bcl-2 family members. The activation of p38 contributed to tolvaptan-mediated apoptosis via down-regulation of Bcl-2. Proteasome inhibition altered tolvaptan-induced cell cycle deregulation and enhanced tolvaptan-induced apoptosis and cytotoxicity. Moreover, tolvaptan treatment induced autophagy. Inhibition of autophagy by knocking-down an autophagy-related gene increased tolvaptan-induced apoptosis and cytotoxicity. Taken together, our findings suggest that the cytotoxicity of tolvaptan results from delayed cell cycle progression, the induction of DNA damage, and the execution of apoptosis. In addition, a number of signaling pathways were perturbed by tolvaptan and played an important role in its cytotoxicity.
Keywords: Tolvaptan, Liver injury, DNA damage, Apoptosis, Proteasome, Autophagy
1. Introduction
Tolvaptan (N-(4-{[(5R)-7-chloro-5-hydroxy-2,3,4,5-tetrahydro-1H-1-benzazepin-1-yl]carbonyl}-3-methylphenyl)-2-methylbenzamide, Fig. 1) is a selective vasopressin V2-receptor antagonist that has been approved in U.S. for the treatment of clinically significant hypervolemic and euvolemic hyponatremia in patients with heart failure, cirrhosis, and the syndrome of inappropriate antidiuretic hormone secretion (SIADH) [1,2]. In Europe, tolvaptan is also approved for the treatment of patients with hyponatremia, secondary to SIADH.
Fig. 1.
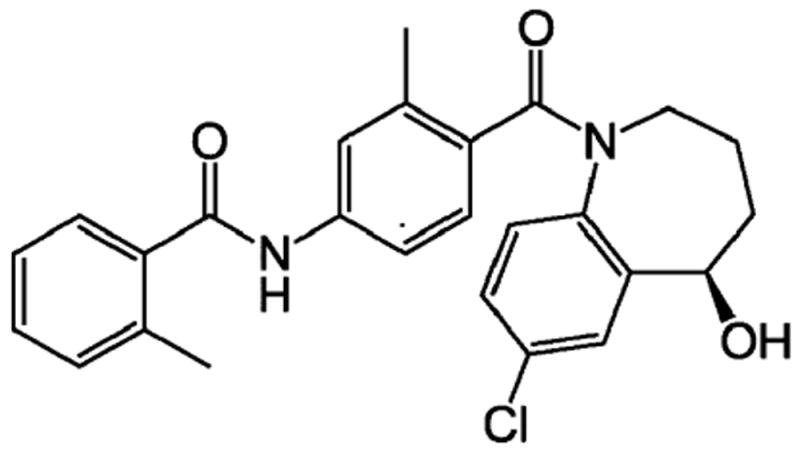
The chemical structure of tolvaptan.
In recent large clinical trial, which tested the use of tolvaptan in patients with autosomal dominant polycystic kidney disease, tolvaptan was reported to be associated with a high risk of liver injury [3]. Three cases of serious liver injury and an increased incidence of elevated serum alanine aminotransferase were observed. As a consequence, the U.S. FDA issued a warning that tolvaptan “should not be used for longer than 30 days and should not be used in patients with underlying liver diseases” (http://www.fda.gov/Drugs/DrugSafety/ucm350062.htm). However, the mechanisms underlying its potential hepatotoxicity are currently unknown.
In vitro studies have demonstrated that cytochrome P450 3A4 (CYP3A4) is the major CYP isozyme that metabolizes tolvaptan [4]. For example, co-administration of grapefruit juice [4], which interferes with CYP3A4 activity, or the CYP3A4 inhibitor ketoconazole [5], increased the mean maximal plasma concentration (Cmax) and the area-under-the-curve (AUC) of tolvaptan in human subjects, while co-administration of CYP3A4 inducer rifampicin reduced the Cmax and AUC of tolvaptan [5].
In this study, using human HepG2 cells, we investigated the mechanisms underlying tolvaptan-mediated cytotoxicity by examining the effects of tolvaptan on the cell growth, cell cycle progression, DNA damage, and apoptosis. In addition, we determined the role of mitogen-activated protein kinase (MAPK) activation, proteasomal degradation, and autophagy in these processes.
2. Materials and methods
2.1. Chemicals and reagents
Tolvaptan, dimethyl sulfoxide (DMSO), Williams’ Medium E, sodium pyruvate, non-essential amino acid solution, β-nicotin-amide adenine dinucleotide 2′-phosphate reduced tetrasodium salt hydrate (NADPH), 2,2-bis(hydroxymethyl)-2,2′,2″-nitrilo-triethanol (Bis-Tris), and thiazolyl blue tetrazolium bromide (MTT) were obtained from Sigma-Aldrich (St. Louis, MO). PD184352, a highly potent and specific inhibitor of MEK1/2 [6], a kinase that phosphorylates the threonine and tyrosine residues of ERK1/2, thus, activating ERK1/2 [7], was also acquired from Sigma-Aldrich, as were SB239063, a specific inhibitor of p38 [8], and MG-132, a potent and specific proteasome inhibitor [9]. These inhibitors were used to investigate the role of the activation of ERK1/2 and p38 and proteasomal degradation in tolvaptan-induced apoptosis. Dulbecco’s Modified Eagle Medium (DMEM), penicillin–streptomycin solution, and 2.5% trypsin were purchased from Thermo Fisher Scientific Inc. (Pittsburgh, PA). Fetal bovine serum (FBS) was acquired from Atlanta Biologicals (Lawrenceville, GA).
2.2. Antibodies
Mouse monoclonal antibodies against cyclin D1, cyclin D3, cyclin-dependent kinase (CDK) 4 (CDK4), and CDK6, rabbit monoclonal antibodies against CDK2, phosphorylated checkpoint kinase 1 at Ser345 (p-Chk1), Bcl-2, Bad, Bim, Bax, phosphorylated-ERK1/2 at Thr202/Tyr204 (p-ERK1/2), ERK1/2, phosphorylated-JNK at Thr183/Tyr185 (p-JNK), JNK, phosphorylated-p38 at Thr180/Tyr182 (p-p38), and p38, and rabbit polyclonal antibodies against phosphorylated checkpoint kinase 2 at Thr68 (p-Chk2), cytochrome C, and Bid were purchased from Cell Signaling Technology (Danvers, MA). Mouse monoclonal antibody against phosphorylated histone H2AX at Ser139 (γ-H2AX) was obtained from Millipore (Billerica, MA). Mouse monoclonal antibodies against CYP3A4 and β-actin, rabbit polyclonal antibodies against cyclin B1, CDK1, green fluorescent protein (GFP), and goat polyclonal antibody against Atg7 were acquired from Santa Cruz Biotechnology (Santa Cruz, CA). Rabbit polyclonal antibody against microtubule-associated protein light chain 3 isoform B (LC3B) was purchased from Sigma-Aldrich. Fluorescein isothiocyanate (FITC)-conjugated anti-BrdU monoclonal antibody (clone B44) was obtained from BD Biosciences (San Jose, CA). Alexa Fluor 488 conjugated rabbit monoclonal antibody against phosphorylated histone H3 at Ser10 (p-H3) was acquired from Cell Signaling Technology.
2.3. Cell culture
Human hepatoma HepG2 cells were obtained from American Type Culture Collection (ATCC, Manassas, VA) and cultured in Williams’ Medium E supplemented with 10% FBS and penicillin–streptomycin solution. The 293 T cell line used for lentivirus packaging was purchased from Biosettia (San Diego, CA) and maintained in DMEM supplemented with 10% FBS, sodium pyruvate, non-essential amino acids, and penicillin–streptomycin solution [10]. Both cell lines were maintained at 37 °C in a humidified atmosphere with 5% CO2.
2.4. Generation of HepG2 cells overexpressing human CYP3A4 and GFP-LC3B
HepG2 cells lack of expression of CYP3A4 [11]. To examine the effects of CYP3A4-mediated metabolism of tolvaptan on its cytotoxicity, a stable HepG2 cell line that overexpresses human CYP3A4 was generated. The coding sequence of human CYP3A4 was cloned into the cDNA expression lentiviral vector pLV-EF1a-MCS-IRES-Puro (Biosettia). 293 T cells were co-transfected with the lentiviral packaging mix and the generated human CYP3A4 expression vector or empty vector to produce lentivirus particles. HepG2 cells were then infected with the lentivirus particles carrying the human CYP3A4 expression vector or empty vector. Puromycin (2 μg/ml) was used to select HepG2 cells with stable expression of human CYP3A4 (HepG2/CYP3A4 cells) or the empty vector (HepG2/vector cells).
HepG2/GFP-LC3B cells, which stably express a fusion protein of GFP and LC3B, were constructed as described in Chen et al. [12].
2.5. Analysis of CYP3A4-mediated metabolism of tolvaptan
HepG2, HepG2/vector, and HepG2/CYP3A4 cells were lysed in buffer containing 5 mM Bis-Tris and 0.1 mM EDTA, pH 7.0, followed by sonication, and the protein concentrations were determined using a BCA protein assay (Thermo Fisher Scientific, Inc.). The metabolic activity of CYP3A4 against tolvaptan was assayed in a 100 μl reaction volume using 400 μg cell lysate protein incubated for 1.5 h at 37 °C with 31.25 μM tolvaptan, 1.3 mM NADPH, 3.3 mM MgCl2, and 100 mM potassium phosphate (pH 7.4). Reactions were terminated by the addition of an equal volume of ice-cold methanol. Precipitated material was removed by centrifugation (5 min, 14,000 × g), and the supernatants were analyzed for tolvaptan metabolites using a Waters HPLC system consisting of a 600 Controller, a 996 Photodiode Array detector, and a 717 Plus autosampler (Waters Corporation, Milford, MA). The samples were injected onto a 4.6 × 250 mm C18 (5 μm) Luna column (Phenomenex, Torrance, CA) and eluted with a linear gradient elution at 1 ml/min between acetonitrile (solvent A) and 100 mM ammonium acetate, pH 8.0 (solvent B) as follows: a linear gradient of 10 to 30% solvent A in 10 min, then another linear gradient to 45% solvent A over 30 min, and then a linear gradient to 100% A in 3 min. The column was washed with 100% solvent A for 15 min and equilibrated for 15 min with 90% solvent B after every run.
2.6. The half inhibitory concentration of tolvaptan (IC50) on cell growth
The effects of tolvaptan on the growth of HepG2, HepG2/vector, and HepG2/CYP3A4 cells were assessed using an MTT assay. Briefly, cells were plated into 24-well plates at cell densities of 6 × 10⁴, 4 × 10⁴, and 2 × 10⁴ cells/cm2 culture surface for 48, 72, and 120 h incubations, respectively. The cells were allowed to attach to the bottom of the wells for 24 h before being treated with various concentrations of tolvaptan (3.125, 6.25, 12.5, 25, 50, and 100 μM) for 24, 48, or 96 h. Control cells were fed with complete culture medium containing 0.1% (v/v) DMSO, which had no effect on cell growth. For the 96 h treatment, fresh medium and tolvaptan were replaced at 48 h. At the end of the treatment, MTT assays were performed as previously described [13]. The IC50 values were obtained from the cell growth curves, using GraphPad Prism 6.0 (GraphPad Software Inc., La Jolla, CA).
2.7. Western blot analysis
At the end of the treatment, the HepG2 cells were lysed in RIPA lysis buffer (Thermo Fisher Scientific Inc.) supplemented with complete protease inhibitor cocktail (Roche Diagnostics, Basel, Switzerland). The protein concentrations were determined using a BCA protein assay. Twenty micrograms of whole cell lysate protein was separated by SDS polyacrylamide gel electrophoresis and transferred onto a PVDF membrane. The membranes were blocked with 4% bovine serum albumin and incubated with specific primary antibodies against CYP3A4 (1:1000), cyclin D1 (1:1000), cyclin D3 (1:1000), cyclin B1 (1:1000), CDK1 (1:1000), CDK2 (1:1000), CDK4 (1:1000), CDK6 (1:1000), γ-H2AX (1:1000), p-Chk1 (1:1000), p-Chk2 (1:500), cytochrome C (1:1000), Bcl-2 (1:1000), Bad (1:1000), Bim (1:1000), p-ERK1/2 (1:1000), ERK1/2 (1:1000), p-JNK (1:1000), JNK (1:1000), p-p38 (1:1000), p38 (1:1000), Bax (1:1000), Bid (1:1000), LC3B (1:1000), GFP (1:1000), Atg7 (1:1000), or β-actin (1:2000), followed by a secondary antibody conjugated to horseradish peroxidase. The blots were then detected by chemiluminescence using Immobilon Western Horseradish Peroxidase Substrate (Millipore), a UVP BioSpectrum AC Imaging System, and VisionWorks LSD Image Acquisition & Analysis Software (UVP LLC, Upland, CA).
2.8. Lactate dehydrogenase (LDH) release assay
Cell death was measured by a LDH release assay as previously described [13].
2.9. Cell cycle analysis
The effect of tolvaptan on the cell cycle distribution was determined by flow cytometric analysis. At the end of the treatment, the HepG2 cells were pulse-labeled with BrdU by incubating with complete media containing 10 μM BrdU for 1 h. The cells were then trypsinized. One half of the cells was fixed in 70% ethanol and stained with fluorescein isothiocyanate (FITC)-conjugated anti-BrdU monoclonal antibody and propidium iodide as previously described [14]. To determine the percentage of cells in M phase, the other half of the cells was fixed in 1% formaldehyde, permeabilized with methanol, and stained with Alexa Fluor 488-conjugated monoclonal antibody against p-H3, a marker of mitotic cells [15]. The stained cells were analyzed on a Becton Dickinson FACS Calibur flow cytometer with CellQuest software (BD Biosciences).
2.10. Alkaline comet assays
Alkaline comet assays, with or without post-incubation with bacterial formamidopyrimidine DNA glycosylase (Fpg) protein, were performed using a Fpg FLARE™ assay kit or a CometAssay kit (Trevigen, Gaithersburg, MD), as previously described [16,17].
2.11. 8-Oxoguanine and reactive oxygen species (ROS) determinations
The level of 8-oxoguanine was determined using an OxyDNA assay kit (Millipore) according to the manufacturer’s instructions. Briefly, at the end of the treatment, the HepG2 cells were trypsinized, fixed in 1% formaldehyde, permeabilized in 70% ethanol, and incubated with a FITC-conjugated protein that can bind directly to 8-oxoguanine present in oxidized DNA. The stained cells were analyzed on a Becton Dickinson FACS Calibur flow cytometer with CellQuest software. The fluorescent intensity was determined and normalized to control cells.
The level of ROS was determined using 6-carboxy-2′,7′-dichlorodihydrofluorescein diacetate (carboxy-H2DCFDA; Life Technologies, Grand Island, NY). Briefly, at the end of the treatment, the HepG2 cells were incubated with fresh medium containing 100 μM carboxy-H2DCFDA at 37 °C for 1 h. The cells were then trypsinized, washed with PBS, and analyzed on a Becton Dickinson FACS Calibur flow cytometer with CellQuest software. The fluorescent intensity was determined and normalized to control cells.
2.12. Caspase 3/7 activity assay
Apoptotic cell death was determined by caspase 3/7 activity, which was measured using a Caspase-Glo 3/7 assay kit (Promega, Madison, WI) according to manufacturer’s instructions. Briefly, at the end of the treatment, 100 μl of Caspase-Glo 3/7 reagent was added to each well of a 96-well plate containing 100 μl of culture medium per well. After incubation at room temperature for 30 min, luminescence was measured with a BioTek Synergy 2 Reader (BioTek Instruments, Inc., Winooski, VT). An MTT assay was performed in a parallel 96-well plate. The luminescence was normalized to the MTT assay data, and further normalized to the control.
2.13. Mitochondrial membrane potential determination
Mitochondrial membrane potential was determined using the mitochondrial membrane potential-sensitive dual-emission probe JC-1 (Sigma-Aldrich). JC-1 forms aggregates that display orange fluorescence in healthy mitochondria. When the mitochondrial membrane potential decreases, JC-1 exists as a monomer and displays green fluorescence. The fluorescence ratio of JC-1 aggregates to JC-1 monomers is an indication of mitochondrial membrane potential.
At the end of the treatment, HepG2 cells, seeded in black 96-well plates, were incubated with 100 μl fresh medium containing 2.5 μg/ml of JC-1. After incubation at 37 °C for 20 min, the cells were washed three times with PBS. The fluorescence of the JC-1 aggregates and monomers was measured on a Biotek Synergy 2 Reader using filter pairs of 530 nm/590 nm and 485 nm/538 nm, respectively. The ratio of fluorescence of aggregates to monomers was calculated and normalized to control cells.
2.14. Mitochondria isolation
The separation of mitochondria from cytosolic components was performed using Pierce’s mitochondria isolation kit (Thermo Fisher Scientific, Inc.), according to the manufacturer’s instructions. The isolated mitochondria were lysed in RIPA lysis buffer. The protein concentrations were determined with a BCA protein assay.
2.15. Confocal microscopic analysis
HepG2/GFP-LC3B cells were seeded on coverslips in 24-well plates and then treated with tolvaptan or vehicle for 24 h. At the end of the treatment, the coverslips were washed with PBS and incubated in 4% paraformaldehyde for 15 min, followed by another wash with PBS. The presence of GFP-LC3B puncta was determined using an Olympus FV1000 confocal microscope (Olympus, Center Valley, PA) by observing GFP fluorescence after mounting the coverslips onto glass slides using Vectashield mounting medium containing DAPI (Vector Laboratories, Burlingame, CA).
2.16. GFP fluorescence intensity determination
At the end of the treatment, the HepG2/GFP-LC3B cells were trypsinized and washed with PBS. GFP fluorescence intensity was analyzed on a Becton Dickinson FACS Calibur flow cytometer with CellQuest software and normalized to the control.
2.17. RNA interference of Atg7 in HepG2 cells
Human Atg7 siRNA and negative control siRNA were purchased from Cell Signaling Technology. Transfection of siRNA into HepG2 cells was conducted by using Lipofectamine RNAiMAX (Life Technologies) following the manufacturer’s instructions. The knock-down efficiency of the human Atg7 siRNA was determined using Western blot analysis 96 h after the siRNA transfection.
2.18. Statistical analyses
Data are presented as the mean ± standard deviation of three independent experiments. Comparisons amongst concentrations were conducted by one-way analysis of variance, with pairwise comparisons versus control group being performed by Dunnett’s method. When necessary, the data were log transformed to maintain an equal variance or normal data distribution. The results were considered significant at p < 0.05.
3. Results
3.1. Tolvaptan exhibited similar cytotoxicity in HepG2, HepG2/vector, and HepG2/CYP3A4 cells
The effect of tolvaptan on the growth of HepG2 cells was initially screened using an MTT assay. As shown in Fig. 2A, tolvaptan decreased the growth of the HepG2 cells in a concentration- and time-dependent manner, with the IC50 values being >100, 52.2, 33.0, and 27.1 μM after 24, 48, 96, and 168 h of exposure, respectively (Fig. 2C). Previous studies have suggested that tolvaptan is metabolized primarily by CYP3A4 [4]. To determine the effect of CYP3A4 on the cytotoxicity of tolvaptan, a stable HepG2 cell line that overexpressed human CYP3A4 (HepG2/CYP3A4 cells) was generated. As shown in Fig. 2B (upper left panel), when assessed by Western blot analysis, CYP3A4 was readily detected in HepG2/CYP3A4 cells but not in HepG2 and HepG2/vector cells. Likewise, the enzymatic activity of CYP3A4 against luciferin-IPA was much higher in HepG2/CYP3A4 cells compared to HepG2 and HepG2/vector cells (Fig. 2B, upper right panel). Incubation of tolvaptan with HepG2/CYP3A4 cell lysates at 37 °C for 1.5 h led to the formation of at least seven metabolites of tolvaptan that eluted from the HPLC column at retention times ranging from 17.8 to 32.4 min, as shown in Fig. 2B (lower panel), and a decrease in the tolvaptan substrate by 11.5 ± 0.6%. None of the metabolites was detected in reactions using HepG2 or HepG2/vector cell lysates (Fig. 2B, lower panel). A comparison of the effect of tolvaptan on cell growth showed comparable IC50 values among three cell lines (Fig. 2C), indicating that CYP3A4 had little effect on tolvaptan-induced cytotoxicity in HepG2 cells.
Fig. 2. Tolvaptan exhibited similar cytotoxicity in HepG2, HepG2/vector, and HepG2/CYP3A4 cells.
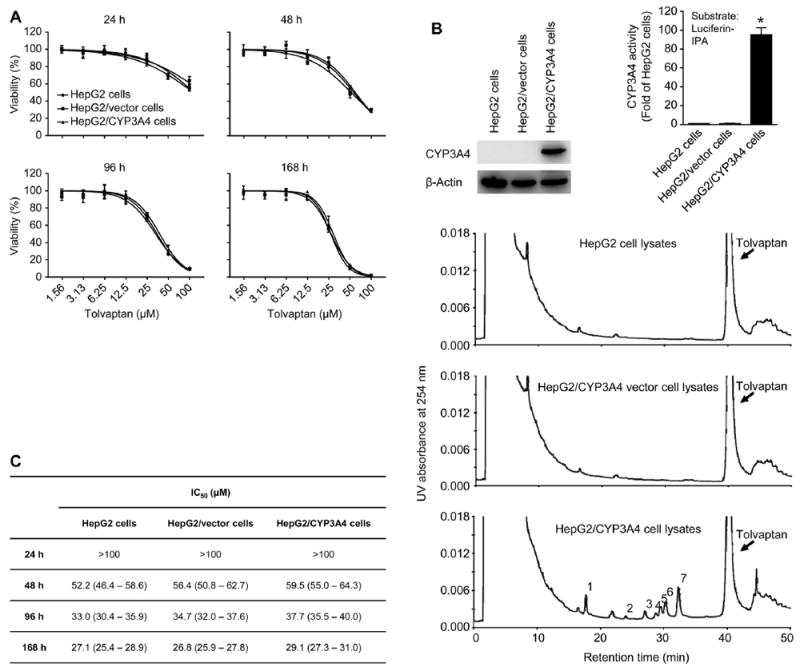
(A) Representative cell growth curves of HepG2, HepG2/vector, and HepG2/CYP3A4 cells treated with tolvaptan (1.56–100 μM) for 24, 48, 96, or 168 h. The results shown are the mean and standard deviation of three independent experiments. (B) The protein level of CYP3A4 (upper left panel), the enzymatic activity of CYP3A4 against luciferin-IPA (upper right panel), and HPLC analysis of tolvaptan metabolites (indicated using Arabic numbers) by CYP3A4 (lower panel) in HepG2, HepG2/vector, and HepG2/CYP3A4 cells. β-Actin was used as a loading control. The enzymatic activity of CYP3A4 against CYP3A4 substrate luciferin-IPA was determined using a P450-Glo CYP3A4 assay kit. (C) The IC50 values obtained from the cell growth curves shown in (A) using GraphPad Prism 6.0. Values in the parenthesis were 95% confidence intervals of the IC50.
3.2. Tolvaptan inhibited cell growth and induced cell death in HepG2 cells
Since there was no significant difference in the cytotoxicity of tolvaptan between HepG2 and HepG2/CYP3A4 cells, subsequent mechanistic studies were conducted with HepG2 cells. Based on the IC50 values obtained above, HepG2 cells were incubated with five concentrations (20, 40, 60, 80, and 100 μM) of tolvaptan for 24 or 48 h. Each of the concentrations of tolvaptan caused a significant decrease in the cell growth, in a both a time- and concentration-dependent manner (Fig. 3A). Starting from 40 μM, tolvaptan increased LDH release, indicative of enhanced cell death (Fig. 3B). These data further confirmed that tolvaptan inhibited cell growth and caused cell death in HepG2 cells.
Fig. 3. Tolvaptan inhibited cell growth and induced cell death in HepG2 cells.
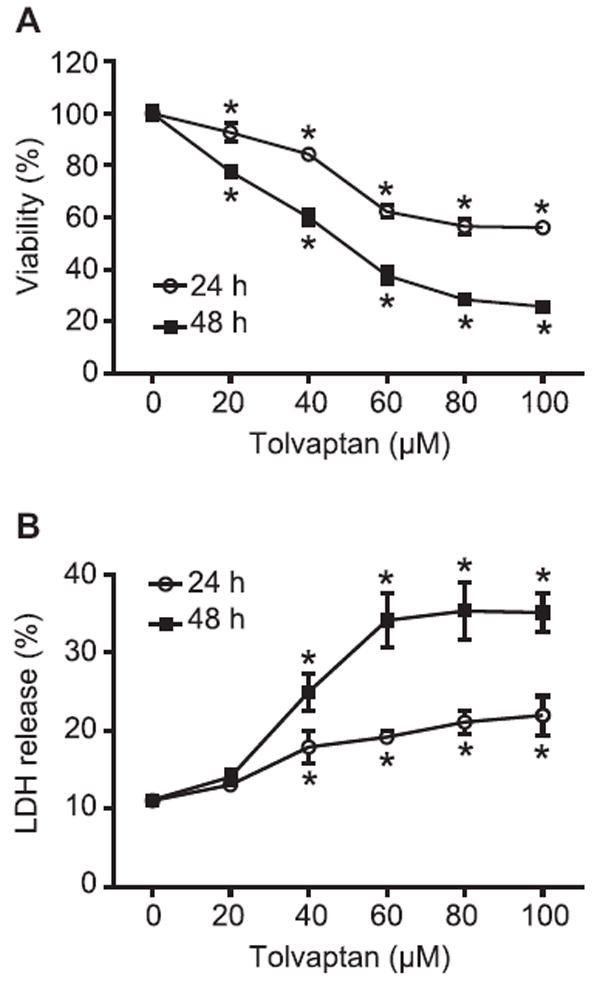
HepG2 cells were treated with tolvaptan (0–100 μM) for 24 or 48 h. (A) Cell viability and (B) cell death was assessed by MTT and LDH release assays, respectively. The results shown are the mean and standard deviation of three independent experiments. * Significantly (p < 0.05) different from 0 μM tolvaptan.
3.3. Tolvaptan disturbed cell cycle progression
Growth inhibition could be due to delayed cell cycle progression. The effects of tolvaptan on cell cycle progression were examined using BrdU incorporation and a flow cytometric technique [14]. As shown in Fig. 4A, there was a concentration-dependent increase in the percentage of G0/G1 phase cells, with a concomitant decrease in the percentage of S phase cells, following 24 or 48 h of exposure to 20–60 μM tolvaptan. Tolvaptan at concentrations of 60–100 μM also resulted in a significant increase in the percentage of G2/M phase cells (Fig. 4A). To discriminate cells in G2 phase from cells in M phase, the percentage of p-H3 positive cells was determined using a flow cytometric assay. As shown in Fig. 4B, treatment with tolvaptan for 24 or 48 h caused a concentration-dependent decrease in the percentage of p-H3 positive cells, implying that tolvaptan treatment caused cell cycle arrest at the G2 phase.
Fig. 4. Tolvaptan disturbed cell cycle progression.
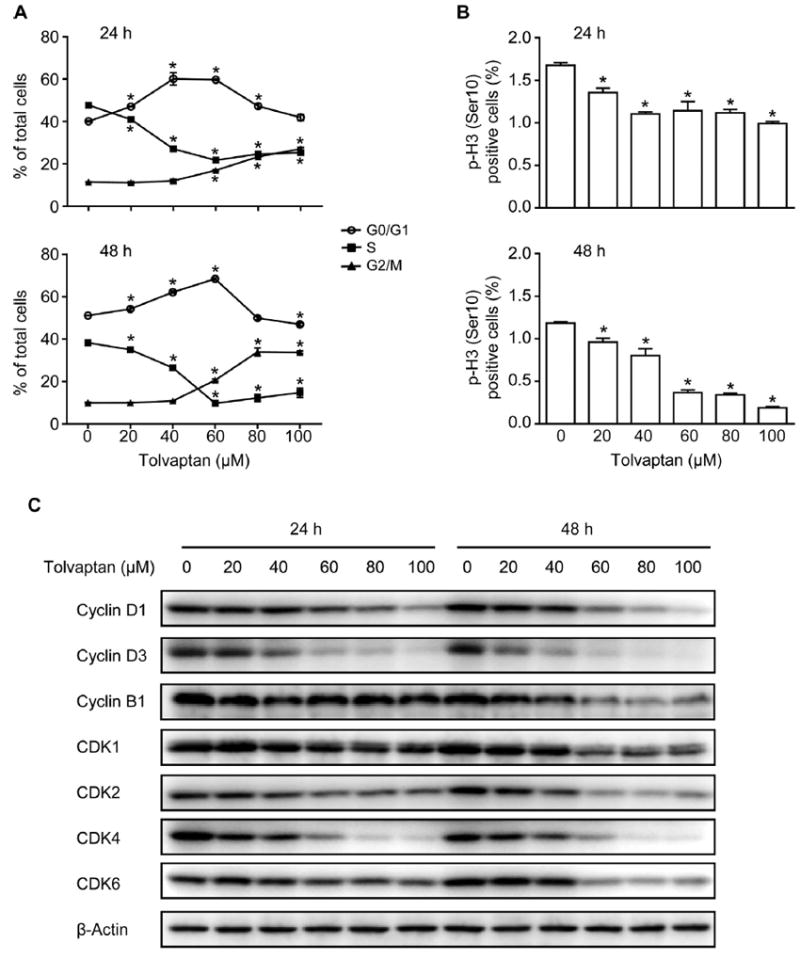
HepG2 cells were treated with tolvaptan (0–100 μM) for 24 or 48 h. (A) Cell cycle progression was determined as described in Materials and Methods. The results shown are the mean and standard deviation of three independent experiments. * Significantly (p < 0.05) different from 0 μM tolvaptan. (B) Percentage of p-H3 positive cells. The results shown are the mean and standard deviation of three independent experiments. * Significantly (p < 0.05) different from 0 μM tolvaptan. (C) Representative Western blot images of cyclin D1, cyclin D3, cyclin B1, CDK1, CDK2, CDK4, and CDK6 in the HepG2 cells treated with tolvaptan. β-Actin was used as a loading control.
Cell cycle progression is regulated by a number of molecules, including cyclin family proteins and CDKs [18]. Cyclin D1, cyclin D3, CDK2, CDK4, and CDK6 are involved in the regulation of G1 phase progression and G1/S phase transition [19], and cyclin B1 and CDK1 participate in the regulation of M phase entry [18]. A concentration-dependent decrease in the protein levels of cyclin D1, cyclin D3, cyclin B1, CDK1, CDK2, CDK4, and CDK6 was observed in HepG2 cells following exposure to tolvaptan for 24 or 48 h (Fig. 4C). These data demonstrate that tolvaptan disturbed cell cycle progression in HepG2 cells and that this was associated with the down-regulation of a number of cyclins and CDKs.
3.4. Tolvaptan caused DNA damage and activated cell cycle checkpoint
The altered cell cycle progression following tolvaptan treatment raised the question of whether or not this was in response to DNA damage. To evaluate if tolvaptan induced DNA damage, alkaline comet assays were performed. In the comet assay conducted without Fpg, a significant increase in the tail moment was observed in the HepG2 cells exposed to 60–100 μM tolvaptan for 24 or 48 h (Fig. 5A).
Fig. 5. Tolvaptan caused DNA damage and activated cell cycle checkpoint in HepG2 cells.
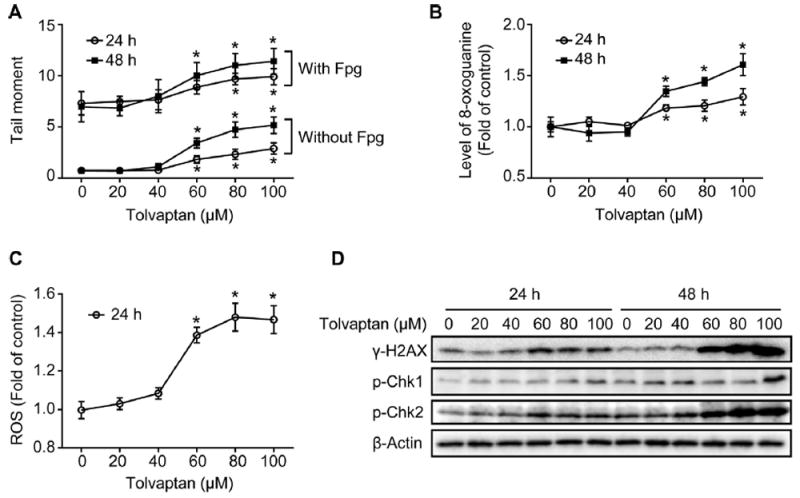
HepG2 cells were treated with tolvaptan (0–100 μM) for 24 or 48 h. (A) Tail moment in alkaline comet assays with or without post-incubation with Fpg. The results shown are the mean and standard deviation of three independent experiments. * Significantly (p < 0.05) different from 0 μM tolvaptan. (B) Relative levels of 8-oxoguanine and (C) ROS in the HepG2 cells treated with tolvaptan. The results shown are the mean and standard deviation of three independent experiments. * Significantly (p < 0.05) different from 0 μM tolvaptan. (D) Representative Western blot images of γ-H2AX, p-Chk1, and p-Chk2 in the HepG2 cells treated with tolvaptan. β-Actin was used as a loading control.
Fpg is an Escherichia coli glycosylase that has been widely used to assess oxidative DNA damage in comet assays [20]. In a comet assay conducted with Fpg, HepG2 cells treated with 60–100 μM tolvaptan for 24 or 48 h displayed an increase in tail moment compared to control cells, suggesting that tolvaptan also caused oxidative DNA damage (Fig. 5A). Furthermore, the level of 8-oxoguanine, a representative type of oxidative DNA damage, and the formation of ROS were significantly increased in the HepG2 cells following exposure to 60–100 μM tolvaptan (Fig. 5B and C). The presence of DNA damage in tolvaptan-treated HepG2 cells was further confirmed by an increased level of γ-H2AX, a sensitive marker of DNA double strand breaks [21] (Fig. 5D).
Checkpoint kinases 1 and 2 (Chk1 and Chk2) are two essential molecules involved in cell cycle checkpoint control. These kinases are phosphorylated and activated by ATM (ataxia telangiectasia mutated protein)/ATR (ATM and Rad3-related) in response to DNA damage [22]. As shown in Fig. 5D, an increase in the levels of p-Chk1 and p-Chk2 was observed in the HepG2 cells treated with tolvaptan for 24 or 48 h, with the effect being greater with p-Chk2. These data suggest that tolvaptan caused DNA damage and activated cell cycle checkpoints in the HepG2 cells.
3.5. Tolvaptan induced apoptosis
The activation of caspase3/7 is a key step in the execution of cell apoptosis [23]; accordingly, caspase 3/7 activity was measured as a marker for the induction of apoptosis. At concentrations ≥40 μM, tolvaptan caused a significant increase in caspase 3/7 activity after 24 or 48 h of exposure, suggesting tolvaptan induced apoptosis in the HepG2 cells (Fig. 6A). The levels of poly (ADP-ribose) polymerase (PARP), a well-known substrate of active caspase 3/7, were analyzed using a Western-blot assay. Consistent with caspase 3/7 activation, tolvaptan treatment induced an increase in PARP cleavage (Fig. 6B). Although the intensity of the cleaved PARP fragment was low, the concomitant decrease in the level of full length PARP indicated the occurrence of PARP cleavage.
Fig. 6. Tolvaptan induced apoptosis.
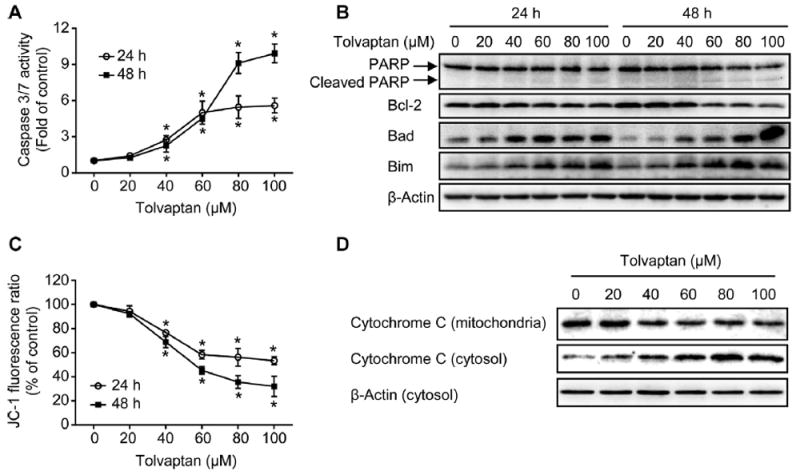
(A) Apoptosis was determined using caspase 3/7 activity assay. The results shown are the mean and standard deviation of three independent experiments. * Significantly (p < 0.05) different from 0 μM tolvaptan. (B) Representative Western blot images of PARP, Bcl-2, Bad, and Bim in HepG2 cells treated with tolvaptan. β-Actin was used as a loading control. (C) Mitochondrial membrane potential was determined using JC-1 assay. The results shown are the mean and standard deviation of three independent experiments. * Significantly (p < 0.05) different from 0 μM tolvaptan. (D) Representative Western blot images of cytochrome C in mitochondria and cytosol of the HepG2 cells treated with tolvaptan for 48 h. β-Actin was used as a loading control.
Apoptosis can be triggered primarily through two pathways, namely a mitochondria-mediated intrinsic pathway or a death receptor–mediated extrinsic pathway [24-26]. Tolvaptan decreased the mitochondrial membrane potential (Fig. 6C) and enhanced the release of cytochrome C from mitochondria to the cytosol after a 48 h exposure (Fig. 6D), suggesting that the mitochondria-mediated intrinsic pathway was involved in tolvaptan-induced apoptosis.
It is well-established that the balance between the pro-apoptotic and anti-apoptotic Bcl-2 family members regulates mitochondria-mediated intrinsic apoptosis [27-29]. The protein levels of several Bcl-2 family members were examined using Western blot assay. Tolvaptan caused a dose-dependent decrease in the level of the anti-apoptotic protein Bcl-2, and increase in the levels of the pro-apoptotic proteins Bad and Bim in HepG2 cells following 24 or 48 h of exposure (Fig. 6B). Taken together, these data suggest that tolvaptan disrupted the balance between pro-apoptotic and anti-apoptotic proteins in the Bcl-2 family, enhancing cytochrome C release and triggering apoptosis.
3.6. Activation of p38 contributed to tolvaptan-induced apoptosis
Mitogen-activated protein kinases (MAPKs) are a family of serine/threonine kinases that regulate a variety of cellular activities [30,31], and their involvement in the regulation of apoptosis has been well-documented [32]. The most extensively studied MAPKs are extracellular signal-regulated kinases 1/2 (ERK1/2), c-Jun N-terminal kinases (JNK), and p38 kinase [30]. The activation of ERK1/2, JNK, and p38 is mediated by the dual phosphorylation of threonine and tyrosine residues [31]. Western blot analysis was used to monitor the phosphorylation of JNK, ERK1/2, and p38 as an indication of kinase activation. Tolvaptan, at concentrations ≥60 μM, induced the activation of ERK1/2 and p38 when assessed after 4 or 24 h of exposure (Fig. 7A). The activation of JNK was not observed under the same conditions (data not shown).
Fig. 7. Activation of p38 contributed to tolvaptan-induced apoptosis.
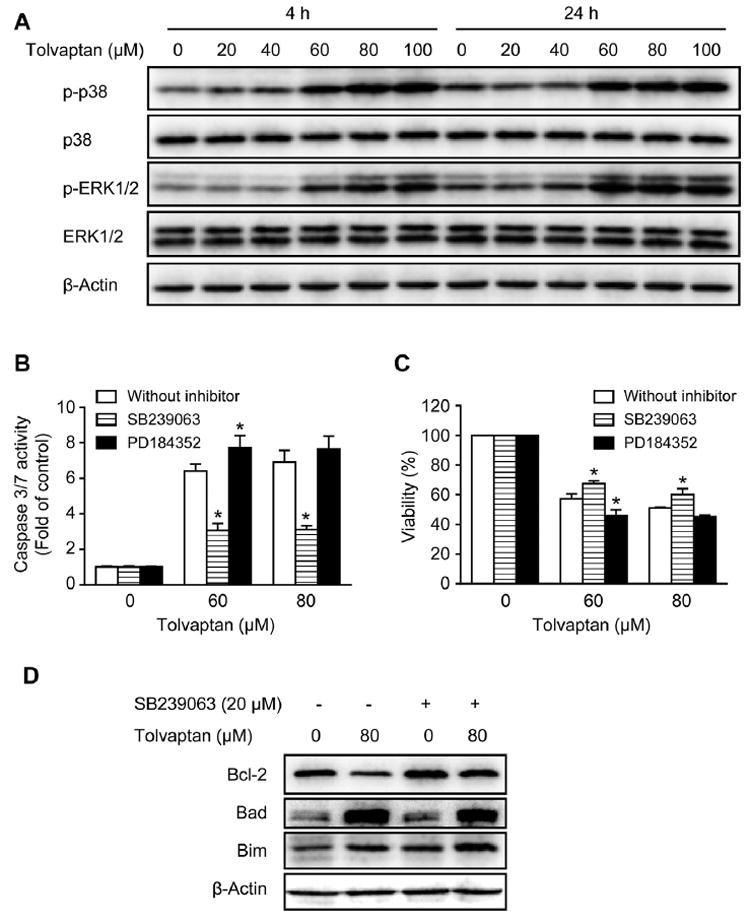
(A) Representative Western blot images of p-p38, p38, p-ERK1/2, and ERK1/2 in HepG2 cells treated with tolvaptan (0–100 μM) for 4 or 24 h. β-Actin was used as a loading control. (B–D) HepG2 cells were pre-treated with the p38 inhibitor SB239063 (20 μM), the MEK1/2 inhibitor PD184352 (2 μM), or vehicle (0.1% DMSO) for 1 h and then exposed to tolvaptan (0–80 μM) for 24 h. Apoptosis (B) and cell viability (C) were determined using capsase 3/7 activity and MTT assays, respectively. The results shown are the mean and standard deviation of three independent experiments. * Significantly (p < 0.05) different from the respective 0 μM tolvaptan group. (D) Representative Western blot images of Bcl-2, Bad, and Bim in HepG2 cells treated with 80 μM tolvaptan in the presence or absence of the p38 inhibitor SB239063 (20 μM). β-Actin was used as a loading control.
To investigate whether or not the activation of ERK1/2 and p38 contributed to tolvaptan-induced apoptosis, specific inhibitors were used. Pre-treatment with the p38 inhibitor SB239063 for 1 h significantly decreased tolvaptan-induced apoptosis and partially attenuated its cytotoxicity after a 24 h exposure (Fig. 7B and C). In contrast, pre-treatment with the MEK1/2 inhibitor PD184352 did not decrease, but even slightly potentiated tolvaptan-induced apoptosis and its cytotoxicity, suggesting that the activation of ERK1/2 was not the cause of tolvaptan-induced apoptosis. Pre-treatment with SB239063 also partially reversed the tolvaptan-mediated decrease in the level of Bcl-2, but had minimal effects on the levels of Bad and Bim (Fig. 7D). These data suggest that the activation of p38 contributed to tolvaptan-induced apoptosis and that this occurs through the modulation of Bcl-2.
3.7. Proteasome inhibition blocked tolvaptan-mediated degradation of cyclin D3 and CDK4, and altered tolvaptan-induced cell cycle deregulation
The ubiquitin-proteasome pathway plays a pivotal role in the regulation of cell cycle progression [33,34] and apoptosis [35,36]. To determine whether or not tolvaptan-induced proteasomal degradation was responsible for the decrease in the protein levels of cyclins and CDKs, the specific proteasome inhibitor MG-132 was used. As shown in Fig. 8A, co-treatment of HepG2 cells with MG-132 and tolvaptan for 24 h markedly blocked the tolvaptan-mediated decrease in the protein levels of cyclin D3 and CDK4, exacerbated the tolvaptan-mediated decrease in the level of cyclin D1, and had no effect on CDK1, CDK2, or CDK6. These data suggest that tolvaptan caused proteasomal degradation of cyclin D3 and CDK4.
Fig. 8. Proteasome inhibition blocked tolvaptan-mediated degradation of cyclin D3 and CDK4 and altered tolvaptan-induced cell cycle deregulation.
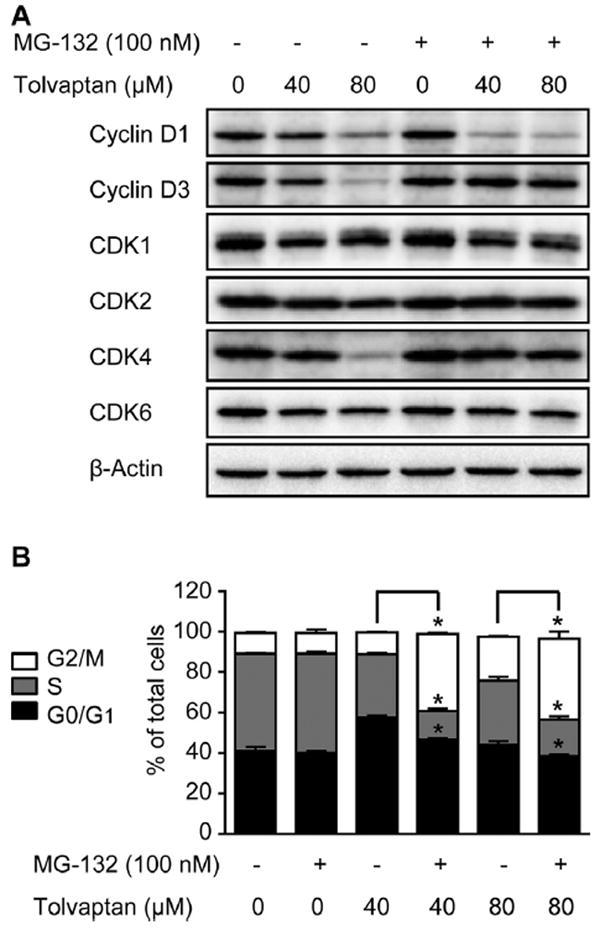
HepG2 cells were treated with tolvaptan (0, 40, or 80 μM) in the presence or absence of the proteasome inhibitor MG-132 (100 nM) for 24 h. (A) Representative Western blot images of cyclin D1, cyclin D3, CDK1, CDK2, CDK4, and CDK6. β-Actin was used as a loading control. (B) Cell cycle distribution. The results shown are the mean and standard deviation of three independent experiments. * Significantly (p < 0.05) different from cells without MG-132 treatment.
The effect of MG-132 on tolvaptan-mediated alterations in cell cycle progression was also examined. MG-132 alone did not have any effects on the cell cycle progression after a 24 h exposure (Fig. 8B). When HepG2 cells were treated with tolvaptan in the presence of MG-132 for 24 h, the percentage of G0/G1 phase cells was decreased compared with cells treated with tolvaptan only, suggesting that the tolvaptan-mediated G0/G1 phase cell arrest was partially reversed (Fig. 8B). This effect possibly resulted from the restoration of the levels of cyclin D3 and CDK4, two key molecules controlling G1/S phase transition. Furthermore, there was a significant increase in the percentage of G2/M phase cells, with a concomitant decrease in the percentage of S phase cells in the HepG2 cells co-treated with MG-132 and tolvaptan for 24 h, compared with the HepG2 cells treated with tolvaptan alone (Fig. 8B). These data suggest that proteasome inhibition altered tolvaptan-mediated cell cycle deregulation.
3.8. Proteasome inhibition enhanced tolvaptan-induced apoptosis and cytotoxicity
The effect of MG-132 on tolvaptan-induced apoptosis was also investigated. As shown in Fig. 9A, MG-132 dramatically enhanced the tolvaptan-mediated increase in caspase 3/7 activity after a 24 h exposure. In the presence of MG-132, tolvaptan at concentrations as low at 10 μM caused an increase in caspase 3/7 activity, whereas in the absence of MG-132, an increase in caspase 3/7 activity only occurred at ≥60 μM tolvaptan (Fig. 9A). PARP cleavage was also enhanced in HepG2 cells co-treated with tolvaptan and MG-132 (Fig. 9B). The increase in tolvaptan-induced apoptosis was accompanied by an increased cytotoxicity in HepG2 cells co-treated with MG-132 for 24 h (Fig. 9C). MG-132 alone did not increase caspase 3/7 activity or exhibit cytotoxicity at the concentration tested (100 nM).
Fig. 9. Proteasome inhibition enhanced tolvaptan-induced apoptosis and cytotoxicity.
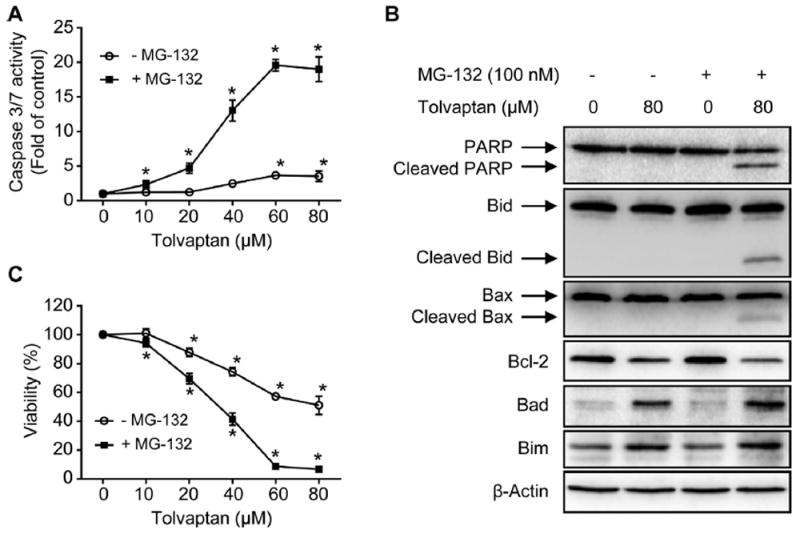
HepG2 cells were treated with tolvaptan (0–80 μM) in the presence or absence of the proteasome inhibitor MG-132 (100 nM) for 24 h. (A) Apoptosis, as determined by measuring capsase 3/7 activity. The results shown are the mean and standard deviation of three independent experiments. * Significantly (p < 0.05) different from 0 μM tolvaptan. (B) Representative Western blot images of PARP, Bid, cleaved Bid, Bax, cleaved Bax, Bcl-2, Bad, and Bim. β-Actin was used as a loading control. (C) Cell viability, as determined by MTT assays. The results shown are the mean and standard deviation of three independent experiments. * Significantly (p < 0.05) different from 0 μM tolvaptan.
MG-132 exhibited a marginal effect on the tolvaptan-mediated decrease in the level of Bcl-2 and increase in the level of Bad (Fig. 9B), and there was no difference in the level of Bim in cells co-treated with MG-132 and tolvaptan for 24 h, compared with cells exposed to tolvaptan alone (Fig. 9B).
Bid and Bax are two additional pro-apoptotic proteins belonging to Bcl-2 family. Cleavage of Bid generates the active form of Bid, which translocates from the cytosol to mitochondria, activates Bax, and contributes to apoptosis [37,38]. Cleaved Bax has been shown to possess more potent activity in enhancing cell death than its parent form [39]. As shown in Fig. 9C, co-treatment of the HepG2 cells with MG-132 and tolvaptan for 24 h induced the cleavage of Bid and Bax, which did not occur in cells treated with either tolvaptan or MG-132 alone. Taken together, these data suggest that proteasome inhibition enhanced tolvaptan-induced apoptosis and cytotoxicity, and that the modulation of Bcl-2 family proteins was involved in this process.
3.9. Tolvaptan induced autophagy
Autophagy is a catabolic process responsible for the degradation of unnecessary or dysfunctional cellular components [40]. Execution of autophagy involves the formation of a double-membrane autophagosome, subsequent fusion of the autophagosome with lysosome to become an autolysosome, and the degradation of intra-autophagosomal components by lysosomal hydrolases [41]. Autophagy occurs in response to a variety of stimuli, and can promote either cell survival or cell death under different conditions [42]. The role of autophagy in drug-induced liver toxicity is beginning to be recognized [43-45]. Microtubule-associated protein light chain 3 (LC3) is a widely used marker to monitor autophagy [46]. Upon the induction of autophagy, cytosolic LC3-I is converted to autophagosome membrane-bound LC3-II. LC3-II in the autolysosomal lumen is then degraded. Thus, LC3-II is an autophagosomal marker and the lysosomal turnover of LC3-II reflects the autophagic process [46].
Western blot analysis revealed a concentration-dependent increase in the level of LC3B-II by tolvaptan treatment for 24 or 48 h (Fig. 10A). Using HepG2/GFP-LC3B cells that stably express GFP-LC3B fusion protein, tolvaptan-induced autophagosome formation was examined morphologically. As shown in Fig. 10B, GFP-LC3B has a diffuse localization in the control cells, whereas in cells treated with tolvaptan for 24 h, GFP-LC3B had a punctate structure indicative of an autophagosome. In addition, the lysosomal turnover of GFP-LC3B was determined by analyzing for free GFP, which is resistant to lysosomal degradation after being cleaved from GFP-LC3B in the autolysosomes [41]. Tolvaptan treatment for 24 or 48 h increased the amount of free GFP in a concentration-dependent manner (Fig. 10A). The increase in the lysosomal turnover was further confirmed by a decrease in the GFP fluorescence intensity in cells treated with tolvaptan for 24 or 48 h (Fig. 10C) because GFP fluorescence is quenched in the acidic environment of lysosomes [47]. Taken together, these data demonstrate that tolvaptan induced autophagy in HepG2 cells.
Fig. 10. Tolvaptan induced autophagy in HepG2 cells.
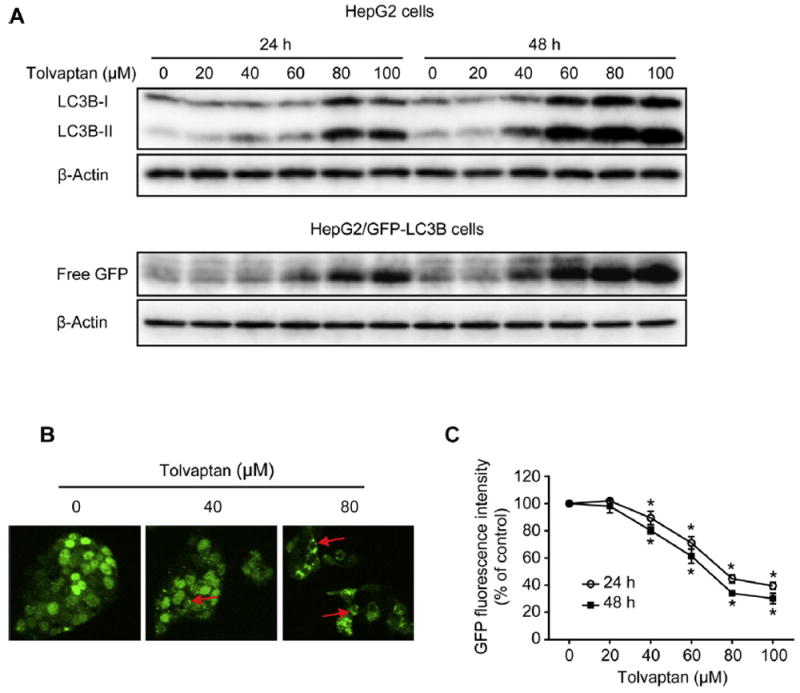
(A) HepG2 or HepG2/GFP-LC3B cells were treated with tolvaptan for 24 or 48 h. Representative Western blot images LC3B and free GFP. β-Actin was used as a loading control. (B) HepG2/GFP-LC3B cells were exposed to tolvaptan (0–80 μM) for 24 h. GFP-LC3B puncta (red arrows) were observed by confocal laser microscope. (C) HepG2/GFP-LC3B cells were treated with tolvaptan (0–100 μM) for 24 or 48 h. GFP fluorescence intensity was determined using flow cytometry. The results shown are the mean and standard deviation of three independent experiments. * Significantly (p < 0.05) different from 0 μM tolvaptan.
3.10. Tolvaptan-induced autophagy prevented apoptosis in HepG2 cells
The role of autophagy in tolvaptan-induced apoptosis was determined by knocking-down Atg7, an important autophagy-related gene that controls autophagosome formation [48]. At 96 h after transfection, HepG2 cells transfected with Atg7 siRNA exhibited a dramatic decrease in the protein level of Atg7 compared with non-transfected HepG2 cells or cells transfected with negative control siRNA (Fig. 11A). The inhibition of autophagy by knocking-down Atg7 was reflected by a decrease in the level of LC3B-II either in the presence or absence of tolvaptan treatment for 24 h (Fig. 11A). In addition, knocking-down Atg7 resulted in an increase in caspase 3/7 activity (Fig. 11B) and a decrease in cell viability (Fig. 11C) in cells treated with tolvaptan for 24 h compared to control cells treated with the same concentration of tolvaptan. These data demonstrate that inhibition of autophagy sensitized the HepG2 cells to tolvaptan-induced apoptosis and cytotoxicity, indicating that autophagy promotes cell survival after tolvaptan treatment.
Fig. 11. Tolvaptan-induced autophagy prevented apoptosis in HepG2 cells.
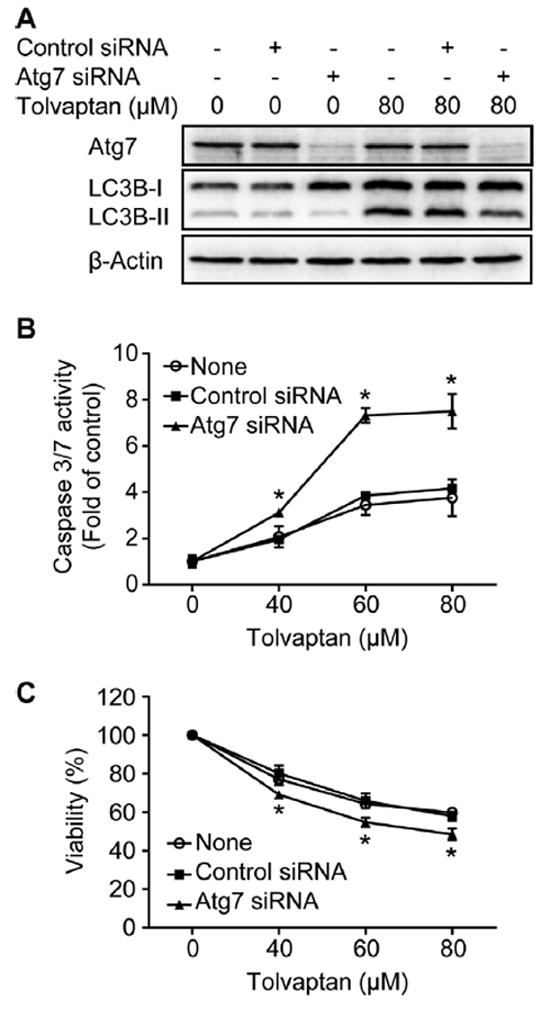
HepG2 cells were transiently transfected with control siRNA or Atg7 siRNA. At 72 h after siRNA transfection, cells were exposed to the indicated concentration of tolvaptan for 24 h. (A) Representative Western blot images of Atg7 and LC3B. β-Actin was used as a loading control. (B) Apoptosis and (C) cell viability were determined using capsase 3/7 activity and MTT assays, respectively. The results shown are the mean and standard deviation of three independent experiments. * Significantly (p < 0.05) different from cells transfected with control siRNA.
4. Discussion
In 2009, tolvaptan was approved by the U.S. FDA for the treatment of hyponatremia. Most published studies on tolvaptan have focused on its pharmacological effects and metabolic profile. Subsequently, tolvaptan was found to be associated with an increased risk of liver injury [3]. To the best of our knowledge, our study is the first to investigate the mechanisms underlying the potential hepatotoxicity of tolvaptan. We found that tolvaptan inhibited cell growth, delayed cell cycle progression, caused DNA damage, and triggered apoptosis in HepG2 cells. We also demonstrated a critical role of p38 activation, modulation of Bcl-2 family proteins, the ubiquitin-proteasome pathway, and autophagy in tolvaptan-induced cytotoxicity. Nevertheless, it should be noted that most of the data presented in the current study were obtained in cells following 24 or 48 h exposure, and it is not known whether these changes will persist during a longer exposure.
HepG2 cells have been demonstrated to be of great value in toxicological studies [49-53]. In addition, their capacity for genetic modifications, such as overexpressing and silencing genes of interest, is advantageous for in-depth mechanistic studies at the molecular level. Although human primary hepatocytes might be more relevant, the limited availability and high variability among different donors restrict their use [11]. Thus, HepG2 cells represent a useful model for mechanistic studies of hepatotoxicity.
CYP3A4 plays an important role in the phase I metabolism of tolvaptan [4,5]. Unexpectedly, we found that the overexpression of human CYP3A4 did not significantly affect tolvaptan-induced cytotoxicity compared with HepG2 cells and HepG2/vector cells. Although the difference was not significant, tolvaptan was slightly less toxic in HepG2/CYP3A4 cells compared to the other two cell lines, with the IC50 values being approximately 10% higher (Fig. 2C). This difference is consistent with the finding that there was only limited (12%) metabolism of tolvaptan in HepG2/CYP3A4 cells (Fig. 2B). Thus, these data suggest that tolvaptan rather than the metabolites resulting from CYP3A4 metabolism is responsible for the observed toxicities.
Delayed cell cycle progression is a frequent cause of cell growth inhibition [18]. Tolvaptan at 20–60 μM induced cell cycle arrest at the G0/G1 phase (Fig. 4A). Several key regulators of G1/S phase transition, including cyclin D1, cyclin D3, CDK4, and CDK6 were down-regulated upon tolvaptan treatment (Fig. 4C). Among these, the greatest decrease was observed with cyclin D3 and CDK4, and these changes occurred at as low as 20 μM tolvaptan, implying that the decrease in the levels of cyclin D3 and CDK4 may be responsible for tolvaptan-induced G0/G1 phase arrest. This notion was further supported by the finding that proteasome inhibition blocked the tolvaptan-mediated degradation of cyclin D3 and CDK4 and attenuated the tolvaptan-induced increase in G0/G1 phase cells (Fig. 8B).
Tolvaptan at concentrations ≥60 μM induced cell cycle arrest at G2/M phase (Fig. 4A and B), which correlated with a decrease in the levels of cyclin B1 and CDK1 (Fig. 4C), an increase in DNA damage (Fig. 5), and the activation of Chk2 (Fig. 5C). The control of G2/M phase transition involves two critical molecules, cyclin B1 and CDK1, the down-regulation of which has been demonstrated to result in the delay of M phase entry [54-57]. Furthermore, it is well-established that DNA damage can trigger cell cycle arrest, which allows cells time to repair the damage [22]. Therefore, it is possible that both the down-regulation of cyclin B1 and CDK1 and the induction of DNA damage contributed to G2/M phase cell arrest resulting from higher concentrations of tolvaptan (60–100 μM).
The delicate balance between pro-apoptotic and anti-apoptotic proteins of the Bcl-2 family is critical in controlling mitochondria-mediated intrinsic apoptosis [27,28]. Tolvaptan was found to down-regulate anti-apoptotic protein Bcl-2 and up-regulate pro-apoptotic proteins Bad and Bim. In addition, enhanced apoptosis in HepG2 cells co-treated with tolvaptan and the specific proteasome inhibitor MG-132 was associated with the cleavage of the pro-apoptotic proteins Bid and Bax. These findings suggest a critical role of the modulation of Bcl-2 family proteins in tolvaptan-induced apoptosis.
MAPKs regulate a variety of cellular activities, including apoptosis [30,31]. We demonstrated that tolvaptan activated p38 and ERK1/2, but not JNK, and, using specific inhibitors of MAPKs, that only the activation of p38 contributed to tolvaptan-induced apoptosis. Down-regulation of anti-apoptotic protein Bcl-2 was involved in p38-mediated apoptosis. Of note, several findings suggest that p38 activation is not solely responsible for tolvaptan-inducted apoptosis. First, the activation of p38 occurred at ≥60 μM tolvaptan, while apoptosis occurred at ≥40 μM tolvaptan; second, inhibition of p38 activity with SB239063 did not completely block tolvaptan-mediated apoptosis; and third, although SB239063 reversed the tolvaptan-mediated decrease in Bcl-2, it had no significant effect on the level of Bad and Bim. These data imply that tolvaptan-induced apoptosis involves other currently unidentified pathways.
One interesting finding of this study is that the proteasome inhibitor MG-132 sensitized HepG2 cells to tolvaptan-induced apoptosis and cytotoxicity. This deserves attention because some proteasome inhibitors are used clinically as prescription drugs. For instance, bortezomib is the first therapeutic proteasome inhibitor approved for treating relapsed multiple myeloma and mantle cell lymphoma [58]. Carfilzomib, a second-generation proteasome inhibitor, is also used to treat patients with multiple myeloma who have received at least two prior therapies [59]. MG-132 is a potent and specific proteasome inhibitor widely used in in vitro studies. Although MG-132 is not a clinical drug, the increased cytotoxicity of tolvaptan in the presence of MG-132 raise concerns about potential adverse effects resulting from drug-drug interactions between tolvaptan and proteasome inhibitors, especially considering the fact that the concentration of MG-132 used in this study was in the nanomolar range (100 nM) and not cytotoxic. When co-treated with MG-132, apoptosis and decreased cell viability was observed in cells exposed to 10 μM tolvaptan, which is approaching to the plasma levels of tolvaptan found in humans. It is possible that patients who take both tolvaptan and proteasome inhibitors might have a higher risk of developing liver injury.
The clinical dosage of tolvaptan for the treatment of hyponatremia ranges from 15 to 60 mg once daily. Pharmacokinetic studies have shown that the average therapeutic Cmax of tolvaptan is around 0.7 μM in Japanese [60,61] and 1.0 μM in Caucasians [61] following a single oral dose of 60 mg tolvaptan. Co-administration of grapefruit juice with 60 mg tolvaptan increased the Cmax value by 1.9 fold, from 0.7 μM to 1.3 μM [4]. Co-administration of ketoconazole with 30 mg tolvaptan increased the Cmax value by 3.4 fold, from 0.4 μM to 1.3 μM [5]. Although the cytotoxic concentrations of tolvaptan reported here are higher than the plasma concentration in humans, we believe they were reasonable in the present mechanistic study for two reasons. First, the concentration of tolvaptan in human liver is currently unknown, and there are many uncertainties in extrapolating plasma concentrations to hepatocyte concentrations. Second, it is well-known that individual susceptibility to drugs can be affected by a number of factors, including genetic variability, age, drug-drug interactions, and pre-existing diseases [62-64]. To identify drugs with potential idiosyncratic hepatotoxicity, it has been suggested that a concentration equivalent to 100-fold of the therapeutic Cmax should be tested [65]. The cytotoxic concentrations of tolvaptan presented in this study (10–100 μM) are within the range of 100 times of the therapeutic Cmax (70–130 μM).
In conclusion, tolvaptan delayed cell cycle progression, caused DNA damage, and induced apoptosis in human HepG2 cells. Activation of p38 and modulation of Bcl-2 family members contributed to tolvaptan-induced apoptosis and cytotoxicity, while the ubiquitin-proteasome pathway and autophagy seemed to be pro-survival mechanisms.
Acknowledgments
Yuanfeng Wu and Si Chen were supported by an appointment to the Postgraduate Research in the Division of Biochemical Toxicology at the National Center for Toxicological Research administered by Oak Ridge Institute for Science Education through an interagency agreement between the U.S. Department of Energy and the U.S. FDA.
Footnotes
The views presented in this article do not necessarily reflect those of the U.S. Food and Drug Administration.
Conflict of interest statement
The authors declare that there are no conflicts of interest.
References
- 1.Friedman B, Cirulli J. Hyponatremia in critical care patients: frequency, outcome, characteristics, and treatment with the vasopressin V2-receptor antagonist tolvaptan. J Crit Care. 2013;28(219):e1–e12. doi: 10.1016/j.jcrc.2012.06.001. [DOI] [PubMed] [Google Scholar]
- 2.Schrier RW, Gross P, Gheorghiade M, Berl T, Verbalis JG, Czerwiec FS, et al. Tolvaptan, a selective oral vasopressin V2-receptor antagonist, for hyponatremia, N Engl J Med. 2006;355:2099–2112. doi: 10.1056/NEJMoa065181. [DOI] [PubMed] [Google Scholar]
- 3.Torres VE, Chapman AB, Devuyst O, Gansevoort RT, Grantham JJ, Higa-shihara E, et al. Tolvaptan in patients with autosomal dominant polycystic kidney disease. N Engl J Med. 2012;367:2407–2418. doi: 10.1056/NEJMoa1205511. [DOI] [PMC free article] [PubMed] [Google Scholar]
- 4.Shoaf SE, Mallikaarjun S, Bricmont P. Effect of grapefruit juice on the pharmacokinetics of tolvaptan, a non-peptide arginine vasopressin antagonist, in healthy subjects. Eur J Clin Pharmacol. 2012;68:207–211. doi: 10.1007/s00228-011-1106-4. [DOI] [PubMed] [Google Scholar]
- 5.Shoaf SE, Bricmont P, Mallikaarjun S. Effects of CYP3A4 inhibition and induction on the pharmacokinetics and pharmacodynamics of tolvaptan, a non-peptide AVP antagonist in healthy subjects. Br J Clin Pharmacol. 2012;73:579–587. doi: 10.1111/j.1365-2125.2011.04114.x. [DOI] [PMC free article] [PubMed] [Google Scholar]
- 6.Frémin C, Meloche S. From basic research to clinical development of MEK1/2 inhibitors for cancer therapy. J Hematol Oncol. 2010;3:8. doi: 10.1186/1756-8722-3-8. [DOI] [PMC free article] [PubMed] [Google Scholar]
- 7.Roskoski R., Jr MEK1/2 dual-specificity protein kinases: structure and regulation. Biochem Biophys Res Commun. 2012;417:5–10. doi: 10.1016/j.bbrc.2011.11.145. [DOI] [PubMed] [Google Scholar]
- 8.Young PR, McLaughlin MM, Kumar S, Kassis S, Doyle ML, McNulty D, et al. Pyridinyl imidazole inhibitors of p38 mitogen-activated protein kinase bind in the ATP site. J Biol Chem. 1997;272:12116–12121. doi: 10.1074/jbc.272.18.12116. [DOI] [PubMed] [Google Scholar]
- 9.Tsubuki S, Saito Y, Tomioka M, Ito H, Kawashima S. Differential inhibition of calpain and proteasome activities by peptidyl aldehydes of di-leucine and tri-leucine. J Biochem. 1996;119:572–576. doi: 10.1093/oxfordjournals.jbchem.a021280. [DOI] [PubMed] [Google Scholar]
- 10.Chen S, Xuan J, Couch L, Iyer A, Wu Y, Li Q-Z, et al. Sertraline induces endoplasmic reticulum stress in hepatic cells. Toxicology. 2014;322:78–88. doi: 10.1016/j.tox.2014.05.007. [DOI] [PMC free article] [PubMed] [Google Scholar]
- 11.Guo L, Dial S, Shi L, Branham W, Liu J, Fang J-L, et al. Similarities and differences in the expression of drug-metabolizing enzymes between human hepatic cell lines and primary human hepatocytes. Drug Metab Dispos. 2011;39:528–538. doi: 10.1124/dmd.110.035873. [DOI] [PMC free article] [PubMed] [Google Scholar]
- 12.Chen S, Dobrovolsky VN, Liu F, Wu Y, Zhang Z, Mei N, et al. The role of autophagy in usnic acidinduced toxicity in hepatic cells. Toxicol Sci. 2014;142:33–44. doi: 10.1093/toxsci/kfu154. [DOI] [PMC free article] [PubMed] [Google Scholar]
- 13.Wu Y, Beland FA, Chen S, Fang J-L. Extracellular signal-regulated kinases 1/2 and Akt contribute to triclosan-stimulated proliferation of JB6 Cl 41-5a cells. Arch Toxicol. 2014 doi: 10.1007/s00204-014-1308-5. http://dx.doi.org/10.1007/s00204-014-1308-5. [DOI] [PubMed]
- 14.Fang J-L, Beland FA. Long-term exposure to zidovudine delays cell cycle progression, induces apoptosis, and decreases telomerase activity in human hepatocytes. Toxicol Sci. 2009;111:120–130. doi: 10.1093/toxsci/kfp136. [DOI] [PMC free article] [PubMed] [Google Scholar]
- 15.Crosio C, Fimia GM, Loury R, Kimura M, Okano Y, Zhou H, et al. Mitotic phosphorylation of histone H3: spatio-temporal regulation by mammalian Aurora kinases. Mol Cell Biol. 2002;22:874–885. doi: 10.1128/MCB.22.3.874-885.2002. [DOI] [PMC free article] [PubMed] [Google Scholar]
- 16.Wu Y, Qi X, Gong L, Xing G, Chen M, Miao L, et al. Identification of BC005512 as a DNA damage responsive murine endogenous retrovirus of GLN family involved in cell growth regulation. PLoS ONE. 2012;7:e35010. doi: 10.1371/journal.pone.0035010. [DOI] [PMC free article] [PubMed] [Google Scholar]
- 17.Wu Y, Wu Q, Beland FA, Ge P, Manjanatha MG, Fang J-L. Differential effects of triclosan on the activation of mouse and human peroxisome proliferator-activated receptor alpha. Toxicol Lett. 2014;231:17–28. doi: 10.1016/j.toxlet.2014.09.001. [DOI] [PubMed] [Google Scholar]
- 18.Vermeulen K, Van Bockstaele DR, Berneman ZN. The cell cycle: a review of regulation, deregulation and therapeutic targets in cancer. Cell Prolif. 2003;36:131–149. doi: 10.1046/j.1365-2184.2003.00266.x. [DOI] [PMC free article] [PubMed] [Google Scholar]
- 19.Ekholm SV, Reed SI. Regulation of G1 cyclin-dependent kinases in the mammalian cell cycle. Curr Opin Cell Biol. 2000;12:676–684. doi: 10.1016/s0955-0674(00)00151-4. [DOI] [PubMed] [Google Scholar]
- 20.Collins AR, Oscoz AA, Brunborg G, Gaivão I, Giovannelli L, Kruszewski M, et al. The comet assay: topical issues. Mutagenesis. 2008;23:143–151. doi: 10.1093/mutage/gem051. [DOI] [PubMed] [Google Scholar]
- 21.Rogakou EP, Pilch DR, Orr AH, Ivanova VS, Bonner WM. DNA double-stranded breaks induce histone H2AX phosphorylation on serine 139. J Biol Chem. 1998;273:5858–5868. doi: 10.1074/jbc.273.10.5858. [DOI] [PubMed] [Google Scholar]
- 22.Abraham RT. Cell cycle checkpoint signaling through the ATM and ATR kinases. Genes Dev. 2001;15:2177–2196. doi: 10.1101/gad.914401. [DOI] [PubMed] [Google Scholar]
- 23.Slee EA, Adrain C, Martin SJ. Executioner caspase-3, -6, and -7 perform distinct, non-redundant roles during the demolition phase of apoptosis. J Biol Chem. 2001;276:7320–7326. doi: 10.1074/jbc.M008363200. [DOI] [PubMed] [Google Scholar]
- 24.Danial NN, Korsmeyer SJ. Cell death: critical control points. Cell. 2004;116:205–219. doi: 10.1016/s0092-8674(04)00046-7. [DOI] [PubMed] [Google Scholar]
- 25.Tait SWG, Green DR. Mitochondria and cell death: outer membrane permeabilization and beyond. Nat Rev Mol Cell Biol. 2010;11:621–632. doi: 10.1038/nrm2952. [DOI] [PubMed] [Google Scholar]
- 26.Taylor RC, Cullen SP, Martin SJ. Apoptosis: controlled demolition at the cellular level. Nat Rev Mol Cell Biol. 2008;9:231–241. doi: 10.1038/nrm2312. [DOI] [PubMed] [Google Scholar]
- 27.Chao DT, Korsmeyer SJ. BCL-2 family: regulators of cell death. Annu Rev Immunol. 1998;16:395–419. doi: 10.1146/annurev.immunol.16.1.395. [DOI] [PubMed] [Google Scholar]
- 28.Gross A, McDonnell JM, Korsmeyer SJ. BCL-2 family members and the mitochondria in apoptosis. Genes Dev. 1999;13:1899–1911. doi: 10.1101/gad.13.15.1899. [DOI] [PubMed] [Google Scholar]
- 29.Martinou J-C, Youle RJ. Mitochondria in apoptosis: Bcl-2 family members and mitochondrial dynamics. Dev Cell. 2011;21:92–101. doi: 10.1016/j.devcel.2011.06.017. [DOI] [PMC free article] [PubMed] [Google Scholar]
- 30.Keshet Y, Seger R. The MAP kinase signaling cascades: a system of hundreds of components regulates a diverse array of physiological functions. Methods Mol Biol. 2010;661:3–38. doi: 10.1007/978-1-60761-795-2_1. MAP Kinase Signaling Protocols, Methods in Molecular Biology. [DOI] [PubMed] [Google Scholar]
- 31.Morrison DK. MAP kinase pathways. Cold Spring Harbor Perspect Biol. 2012;4:a011254. doi: 10.1101/cshperspect.a011254. [DOI] [PMC free article] [PubMed] [Google Scholar]
- 32.Chang L, Karin M. Mammalian MAP kinase signalling cascades. Nature. 2001;410:37–40. doi: 10.1038/35065000. [DOI] [PubMed] [Google Scholar]
- 33.Nakayama KI, Nakayama K. Ubiquitin ligases: cell-cycle control and cancer. Nat Rev Cancer. 2006;6:369–381. doi: 10.1038/nrc1881. [DOI] [PubMed] [Google Scholar]
- 34.Teixeira LK, Reed SI. Ubiquitin ligases and cell cycle control. Annu Rev Biochem. 2013;82:387–414. doi: 10.1146/annurev-biochem-060410-105307. [DOI] [PubMed] [Google Scholar]
- 35.Orlowski RZ. The role of the ubiquitin-proteasome pathway in apoptosis. Cell Death Differ. 1999;6:303–313. doi: 10.1038/sj.cdd.4400505. [DOI] [PubMed] [Google Scholar]
- 36.Wójcik C. Regulation of apoptosis by the ubiquitin and proteasome pathway. J Cell Mol Med. 2002;6:25–48. doi: 10.1111/j.1582-4934.2002.tb00309.x. [DOI] [PMC free article] [PubMed] [Google Scholar]
- 37.Kim H, Tu H-C, Ren D, Takeuchi O, Jeffers JR, Zambetti GP, et al. Stepwise activation of BAX and BAK by tBID, BIM, and PUMA initiates mitochondrial apoptosis. Mol Cell. 2009;36:487–499. doi: 10.1016/j.molcel.2009.09.030. [DOI] [PMC free article] [PubMed] [Google Scholar]
- 38.Li H, Zhu H, Xu C-J, Yuan J. Cleavage of BID by caspase 8 mediates the mitochondrial damage in the Fas pathway of apoptosis. Cell. 1998;94:491–501. doi: 10.1016/s0092-8674(00)81590-1. [DOI] [PubMed] [Google Scholar]
- 39.Wood DE, Newcomb EW. Cleavage of Bax enhances its cell death function. Exp Cell Res. 2000;256:375–382. doi: 10.1006/excr.2000.4859. [DOI] [PubMed] [Google Scholar]
- 40.Levine B, Kroemer G. Autophagy in the pathogenesis of disease. Cell. 2008;132:27–42. doi: 10.1016/j.cell.2007.12.018. [DOI] [PMC free article] [PubMed] [Google Scholar]
- 41.Mizushima N, Yoshimori T, Levine B. Methods in mammalian autophagy research. Cell. 2010;140:313–326. doi: 10.1016/j.cell.2010.01.028. [DOI] [PMC free article] [PubMed] [Google Scholar]
- 42.Baehrecke EH. Autophagy: dual roles in life and death. Nat Rev Mol Cell Biol. 2005;6:505–510. doi: 10.1038/nrm1666. [DOI] [PubMed] [Google Scholar]
- 43.Apostolova N, Gomez-Sucerquia LJ, Gortat A, Blas-Garcia A, Esplugues JV. Autophagy as a rescue mechanism in Efavirenz-induced mitochondrial dysfunction: a lesson from hepatic cells. Autophagy. 2011;7:1402–1404. doi: 10.4161/auto.7.11.17653. [DOI] [PubMed] [Google Scholar]
- 44.Chen S, Melchior WB, Jr, Wu Y, Guo L. Autophagy in drug-induced liver toxicity. J Food Drug Anal. 2014;22:161–168. doi: 10.1016/j.jfda.2014.03.007. [DOI] [PMC free article] [PubMed] [Google Scholar]
- 45.Ni H-M, Bockus A, Boggess N, Jaeschke H, Ding W-X. Activation of autophagy protects against acetaminophen-induced hepatotoxicity. Hepatology. 2012;55:222–231. doi: 10.1002/hep.24690. [DOI] [PMC free article] [PubMed] [Google Scholar]
- 46.Kabeya Y, Mizushima N, Ueno T, Yamamoto A, Kirisako T, Noda T, et al. LC3, a mammalian homologue of yeast Apg8p, is localized in autophagosome membranes after processing. EMBO J. 2000;19:5720–5728. doi: 10.1093/emboj/19.21.5720. [DOI] [PMC free article] [PubMed] [Google Scholar]
- 47.Shvets E, Fass E, Elazar Z. Utilizing flow cytometry to monitor autophagy in living mammalian cells. Autophagy. 2008;4:621–628. doi: 10.4161/auto.5939. [DOI] [PubMed] [Google Scholar]
- 48.Komatsu M, Waguri S, Ueno T, Iwata J, Murata S, Tanida I, et al. Impairment of starvation-induced and constitutive autophagy in Atg7-deficient mice. J Cell Biol. 2005;169:425–434. doi: 10.1083/jcb.200412022. [DOI] [PMC free article] [PubMed] [Google Scholar]
- 49.Dykens JA, Jamieson JD, Marroquin LD, Nadanaciva S, Xu JJ, Dunn MC, et al. In vitro assessment of mitochondrial dysfunction and cytotoxicity of nefazodone, trazodone, and buspirone. Toxicol Sci. 2008;103:335–345. doi: 10.1093/toxsci/kfn056. [DOI] [PubMed] [Google Scholar]
- 50.Felser A, Blum K, Lindinger PW, Bouitbir J, Krähenbühl S. Mechanisms of hepatocellular toxicity associated with dronedarone—a comparison to amiodarone. Toxicol Sci. 2013;131:480–490. doi: 10.1093/toxsci/kfs298. [DOI] [PubMed] [Google Scholar]
- 51.Greer ML, Barber J, Eakins J, Kenna JG. Cell based approaches for evaluation of drug-induced liver injury. Toxicology. 2010;268:125–131. doi: 10.1016/j.tox.2009.08.007. [DOI] [PubMed] [Google Scholar]
- 52.Juan-García A, Manyes L, Ruiz M-J, Font G. Involvement of enniatins-induced cytotoxicity in human HepG2 cells. Toxicol Lett. 2013;218:166–173. doi: 10.1016/j.toxlet.2013.01.014. [DOI] [PubMed] [Google Scholar]
- 53.Nguyen KC, Willmore WG, Tayabali AF. Cadmium telluride quantum dots cause oxidative stress leading to extrinsic and intrinsic apoptosis in hepatocellular carcinoma HepG2 cells. Toxicology. 2013;306:114–123. doi: 10.1016/j.tox.2013.02.010. [DOI] [PubMed] [Google Scholar]
- 54.Brown JW, Prieto LM, Perez-Stable C, Montoya M, Cappell S, Fishman LM. Estrogen and progesterone lower cyclin B1 and D1 expression, block cell cycle in G2/M, and trigger apoptosis in human adrenal carcinoma cell cultures. Horm Metab Res. 2008;40:306–310. doi: 10.1055/s-2008-1073140. [DOI] [PubMed] [Google Scholar]
- 55.Huang W-W, Ko S-W, Tsai H-Y, Chung J-G, Chiang J-H, Chen K-T, et al. Cantharidin induces G2/M phase arrest and apoptosis in human colorectal cancer colo 205 cells through inhibition of CDK1 activity and caspase-dependent signaling pathways. Int J Oncol. 2011;38:1067–1073. doi: 10.3892/ijo.2011.922. [DOI] [PubMed] [Google Scholar]
- 56.Innocente SA, Abrahamson JL, Cogswell JP, Lee JM. p53 regulates a G2 checkpoint through cyclin B1. Proc Natl Acad Sci U S A. 1999;96:2147–2152. doi: 10.1073/pnas.96.5.2147. [DOI] [PMC free article] [PubMed] [Google Scholar]
- 57.Wu W, Ye H, Wan L, Han X, Wang G, Hu J, et al. Millepachine, a novel chalcone, induces G2/M arrest by inhibiting CDK1 activity and causing apoptosis via ROS-mitochondrial apoptotic pathway in human hepatocarcinoma cells in vitro and in vivo. Carcinogenesis. 2013;34:1636–1643. doi: 10.1093/carcin/bgt087. [DOI] [PubMed] [Google Scholar]
- 58.Chen D, Frezza M, Schmitt S, Kanwar J, Dou QP. Bortezomib as the first proteasome inhibitor anticancer drug: current status and future perspectives. Curr Cancer Drug Targets. 2011;11:239–253. doi: 10.2174/156800911794519752. [DOI] [PMC free article] [PubMed] [Google Scholar]
- 59.Khan ML, Stewart AK. Carfilzomib: a novel second-generation proteasome inhibitor. Future Oncol. 2011;7:607–612. doi: 10.2217/fon.11.42. [DOI] [PMC free article] [PubMed] [Google Scholar]
- 60.Kim SR, Hasunuma T, Sato O, Okada T, Kondo M, Azuma J. Pharmacokinetics, pharmacodynamics and safety of tolvaptan, a novel, oral, selective nonpeptide AVP V2-receptor antagonist: results of single- and multiple-dose studies in healthy Japanese male volunteers. Cardiovasc Drugs Ther. 2011;25(Suppl. 1):S5–S17. doi: 10.1007/s10557-011-6299-3. [DOI] [PubMed] [Google Scholar]
- 61.Shoaf SE, Kim SR, Bricmont P, Mallikaarjun S. Pharmacokinetics and pharmacodynamics of single-dose oral tolvaptan in fasted and non-fasted states in healthy Caucasian and Japanese male subjects. Eur J Clin Pharmacol. 2012;68:1595–1603. doi: 10.1007/s00228-012-1295-5. [DOI] [PubMed] [Google Scholar]
- 62.Dorne JLCM, Walton K, Renwick AG. Human variability in xenobiotic metabolism and pathway-related uncertainty factors for chemical risk assessment: a review. Food Chem Toxicol. 2005;43:203–216. doi: 10.1016/j.fct.2004.05.011. [DOI] [PubMed] [Google Scholar]
- 63.Lee WM. Drug-induced hepatotoxicity. N Engl J Med. 2003;349:474–485. doi: 10.1056/NEJMra021844. [DOI] [PubMed] [Google Scholar]
- 64.Routledge PA, O’Mahony MS, Woodhouse KW. Adverse drug reactions in elderly patients. Br J Clin Pharmacol. 2004;57:121–126. doi: 10.1046/j.1365-2125.2003.01875.x. [DOI] [PMC free article] [PubMed] [Google Scholar]
- 65.Xu JJ, Henstock PV, Dunn MC, Smith AR, Chabot JR, de Graaf D. Cellular imaging predictions of clinical drug-induced liver injury. Toxicol Sci. 2008;105:97–105. doi: 10.1093/toxsci/kfn109. [DOI] [PubMed] [Google Scholar]