

Abstract
Background
Telemedical programs for patients with chronic heart failure have shown inconsistent effects on survival and hospitalization. Few studies analyzed effects of telemedical interventions on health costs, although this outcome may determine whether or not a successful program will be adopted by health insurance providers. We evaluated a large sized telemedicine program provided by a German statutory health insurance, consisting of regular telephone contacts and, for a subgroup of the participants, provision of an electronic scale in a routine care setting. We examined the effects of the program on the total healthcare costs after one year compared to a matched control group.
Methods
The evaluation was based on reimbursement data of the statutory health insurance. Participants of the program were matched to appropriate controls using a combination of exact (e.g. 5-year age group, gender, NYHA class) and propensity score (e.g. medication, psychiatric comorbidity) matching.
The total health costs after one year were calculated on the basis of regression analyses in an intention-to-treat-approach. In a sensitivity analysis, the subgroup of patients with a documented beginning of the intervention was examined.
Results
Two thousand six hundred twenty two patients with chronic heart failure (55% male, mean age: 73.7 years) were included in the intervention program. 1943 participants (74%) could be matched with appropriate control patients. The telemedicine monitoring program for patients with chronic heart failure reduced total health costs after 12 months of the intervention: − 276€ per quarter year in rural regions and − 18€ in urban regions compared to the control group.
Conclusions
The telemedicine program could reduce total health costs, especially in rural regions in Germany.
Keywords: Chronic heart failure, Telemedical monitoring, Reimbursement data, Propensity score matching, Health costs
Background
Chronic heart failure (CHF) is a frequent cause of disability, emergency hospital admission and premature death [1, 2]. The prevalence and incidence rates of heart failure increase with age [3]. Due to demographic changes and the increasing probability to survive an acute myocardial infarction and diseases of the heart valves and the myocardium, the number of CHF-patients will continue to increase in the next years [4].
At the same time, chronic heart failure continues to be a fatal disease, with only 35% patients surviving 5 years after the first diagnosis [3]. In 2002, German health insurance companies paid 2.3 times more for patients with than without CHF [5]. Total health costs of CHF in Germany were estimated at 2.9 billion€ in 2006 [6].
Telemedicine programs have been developed to improve monitoring and therapy of patients with chronic diseases [7]. Telemonitoring of patients with chronic heart failure can be used to detect early warning signs of impending decompensation and may be an effective strategy for disease management in high-risk heart failure patients to prevent hospitalizations and mortality [8].
Only a few studies examined the effect of telemedicine programs for CHF patients on total health costs. Systematic reviews report predominantly lower health costs for patients randomized to the intervention group [7–9]. A recent Cochrane review included 41 studies on structured telephone support or telemonitoring programs for patients with CHF. Four of fifteen studies that reported health cost analyses reported reductions in health costs, two studies reported increases in costs [7].
We evaluated the telemonitoring program “AOK-Curaplan Herz Plus” for patients with CHF, offered by a large statutory health insurance in Germany. The program comprised regular telephone coaching by special trained nurses in a telemedicine center, a modem-connected electronic scale in a subgroup of the patients, and the provision of information leaflets about coping with heart failure [10]. The primary outcome of this evaluation was total health costs per quarter year during the first year after enrolment into the intervention program for the entire intervention group (intention to treat analysis) compared to a matched control group. Secondary outcome was total health costs two years after enrolment. Further, a sensitivity analysis was conducted on total health costs per quarter year during the first year after enrolment in the subgroup of patients with a documented begin of the intervention (treated analysis).
Methods
Intervention program
AOK-Curaplan Herz Plus is a telemedicine program for patients suffering from CHF, offered by the statutory health insurance AOK Nordost in Germany. The program consists of regular telephone coaching and counseling, provision of information leaflets about disease-related themes, and a telemedical scale for weight monitoring. Telephone coaching and counseling is conducted by trained nurses in a telemedicine service center, specialized on medical services. Telephone contacts include feedback to conspicuous weight increase, talks to patient-individual topics and standard themes (e.g. diet, exercise, adherence to medication) [9]. Telephone contacts are conducted every 4 to 12 weeks, dependent on the patients’ individual needs. If needed, patients can contact the telemedicine service center any time. In case of a deteriorating health situation, the nurses give concrete recommendations or contact the treating physician. The frequency of the telephone calls is individually tailored to each patient. The program is implemented in routine healthcare, additional to usual care, and has no defined duration. AOK-Curaplan Herz Plus started in 2006 and is still running in the German federal states of Berlin and Brandenburg.
Usual care for patients with CHF is based on German and international treatment guidelines.
Participants
The intervention was implemented in a regular care setting. Patients with a diagnosis of CHF (ICD-10 diagnosis codes I50.12, I50.13 or I50.14 and NYHA class > I) with a high risk for a heart failure related hospitalization were informed about the program and invited to participate. High risk was defined as a prior heart-failure related hospitalization. Exclusion criterion was the presence of any diagnosed mental disorder at the time of recruitment. The recruitment of patients occurred during two phases: from 2006 to 2009, eligible patients were included by their treating general practitioners and cardiologists in private practices. Since 2009, eligible participants were retrieved from the database of the statutory health insurance AOK Nordost and were contacted directly by the health insurance company. All participating patients provided written informed consent.
Study design
To analyze the effect of the intervention on total health costs compared to an appropriate control group (intention-to-treat analysis), a quasi-experimental design was implemented [11].
Data from 2606 intervention patients and from 205,738 other patients fulfilling the inclusion criteria for the telemedicine program from the time period between the last quarter year of 2006 until the second quarter year of 2012 were retrieved from the database of the statutory health insurance. The data was on a patient-individual level, but completely anonymized, and, except for information about the federal state, without any regional data, so that it was not possible to re-identify single patients. The database included data to all matching variables and outcomes.
The control group was compiled using a combination of exact matching and propensity score matching (see section “matching” for further details). The control patients were retrieved from the total database of the statutory health insurance. For patients of the intervention group, the quarter year of enrollment served as baseline. Figure 1 shows the study design with baseline and follow-up analyses.
Fig. 1.
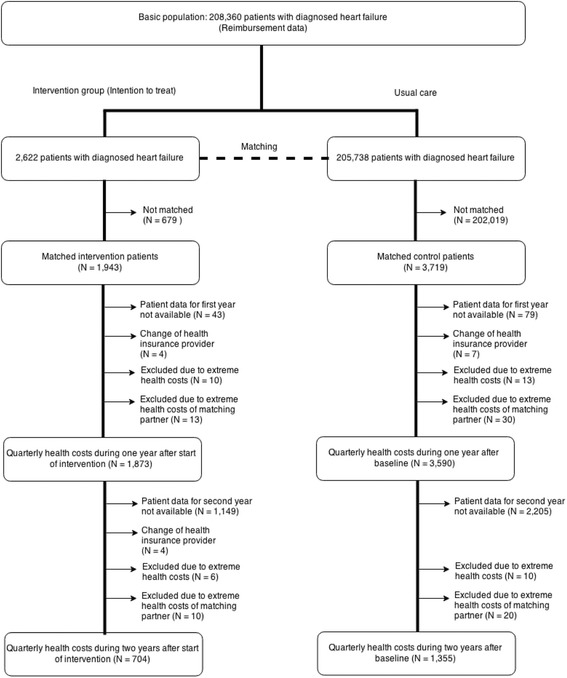
Consort diagram showing the selection of patients to be included in the analysis (intention-to-treat analysis)
In a subsequent sensitivity analysis, the subgroup of patients with a documented start of the intervention was examined (treated analysis). Because of the highly variable time periods between recruitment and start of the intervention throughout the patient group, we conducted a separate matching procedure for the treated analysis using the quarter year of the start of the intervention as baseline quarter year.
Both matching procedures and statistical analyses were based on reimbursement data provided by the AOK Nordost. To analyze the effects of the intervention multivariate regression models were fitted including all matching variables and an array of potential confounders [12].
Matching procedure
The control group was retrieved from the total database of the statutory health insurance. The base population consisted of all patients with a diagnosis of chronic heart failure. We combined exact and propensity score matching using a nearest neighbor method (greedy algorithm) with restrictions in selected covariates (matching without replace, two controls per case at the maximum) [13].
Intervention patients were matched for their quarter year of enrolment (respectively, the quarter year of starting the intervention in the sensitivity analysis) and controls were drawn dynamically. Dynamically means that controls could be matched to an intervention patient every quarter year as long as they were insured, still alive and not matched in a prior quarter year to another intervention patient.
The following variables had to match exactly: sex, 5-year-age group, NYHA class, number of hospital admissions in the 12 months prior to enrolment, cost category (23 categories) and the presence of any mental or behavioral disorders (ICD-10: F00 – F99). Patients with missing information in any of these variables were excluded from the matching procedure. The following parameters were included as propensity score matching criteria: cardiovascular medication in 6 groups of active agents in the baseline quarter year (angiotensin-converting enzymes, beta-blockers, renin-inhibitors, cardiac glycosides, diuretics, and AT1 receptor blockers) and mental and behavioral disorders in 11 diagnoses groups in the baseline quarter year). Mental illness was considered as a disabling factor for successful program participation. However, a considerable number of patients with mental illness were enrolled. Accordingly, mental disorders had to be included in the matching procedure.
Exclusion of extreme-cost-patients and capping of high costs
The statutory health insurance uses an algorithm to exclude patients with extreme costs and to cap costs exceeding a defined threshold in their internal analyses to prevent that single outliers bias the results. The underlying assumption is that very high costs are caused by events that are not associated with the disease (e.g. accidents). We followed this algorithm and excluded patients with health costs over 100,000€ per year. Matching partners of high cost patients were also excluded. Additionally, in all remaining patients, inpatient health costs were capped to a maximum of 20,000€ per year, costs for home health care to 15,000€ per year and medication costs to 7000€ per year.
Statistical analysis
The primary analysis was an intention-to-treat analysis which included all matched patients. After matching, all matched patients received a statistical weight to account for the fact, that for some patients only one matching partner could be assigned (1 for 1943 matched intervention patients, 0.957 for 3552 patients of the control group who were matched to two partners in the intervention group and 1.914 for 167 control patients for whom only one matching partner could be identified).
In the baseline analysis, group differences in continuous variables were compared using the t-test, the chi-square test was used to compare categorical variables.
Primary endpoint of the analysis was the average of the total health costs over the four quarter years of the first year after recruitment. If patients survived less than four quarter years after baseline, we calculated the average of the quarter years when patients were still alive. The analysis of the two-year follow-up proceeded the same way with a maximum of eight quarter years.
The analyses were conducted using multivariate linear regression models. All models were adjusted by all baseline matching variables and by the residential area of the patients (dichotomized as Berlin (= urban) and other (= rural)). An interaction term “study group x residential area” was included in the models because bivariate analyses indicated an effect modification of the intervention of the place of residence on the total health costs.
We considered a p-value < 0.05 statistically significant in all comparisons.
Statistics were calculated using R statistical software, version 3.0.0 (R Foundation for Statistical Computing, Vienna, Austria). We used the R packages “MatchIt” [14] for data matching, “survey” [15] for weighted descriptive analyses, and “stats” [16] for regression models.
Results
Intention-to-treat analysis
Patients were excluded from the regression analyses for the following reasons: 1) missing follow up data (health cost data were available until the fourth quarter year of 2011), 2) patients changed their health insurance company during follow-up time, 3) extreme health costs above 100,000€/year either of a patient (see methods for details) (Fig. 1).
Matching
One thousand nine hundred forty three intervention patients (74% of the patients in the intervention group) could be matched to 3719 control patients. Most frequent cause of failing matching was missing information about the NYHA-class (60% of the 679 not matched intervention patients).
Baseline characteristics
Table 1 shows the distribution of parameter-values for the quarter year of enrolment in the intervention program for patients of the intervention group, and the quarter year of matching for patients of the control group (baseline quarter year). 54% of the patients in both groups were males; the mean age was 74.4 years. NYHA II and III were the most frequent NYHA classes. The total health costs per quarter year in the year prior to the baseline quarter year averaged 3747€ (SD: 3007€) in the intervention group and 3750€ (SD: 3021€) in the control group. 743 patients of the intervention group (38%) had at least one diagnosed mental disorder (ICD-10 Chapter V) in the baseline quarter year.
Table 1.
Baseline characteristics of the intervention patients and controls
| Variable | Mean (SD) / N (%) | Test statistics | ||
|---|---|---|---|---|
| Intervention group (N = 1943) | Control group (N = 3719) | |||
| Sex | Male | 1052 (54.14%) | 2014 (54.15%) | – |
| Female | 891 (45.86%) | 1705 (45.85%) | ||
| Age groups | 41–45 years | 8 (0.41%) | 15 (0.41%) | – |
| 46–50 years | 22 (1.13%) | 42 (1.12%) | ||
| 51–55 years | 46 (2.37%) | 88 (2.36%) | ||
| 56–60 years | 69 (3.55%) | 132 (3.54%) | ||
| 61–65 years | 127 (6.54%) | 243 (6.52%) | ||
| 66–70 years | 305 (15.70%) | 585 (15.72%) | ||
| 71–75 years | 426 (21.92%) | 816 (21.93%) | ||
| 76–80 years | 441 (22.70%) | 845 (22.73%) | ||
| 81–85 years | 314 (16.16%) | 601 (16.16%) | ||
| 86–90 years | 159 (8.18%) | 304 (8.18%) | ||
| 91–95 years | 26 (1.34%) | 49 (1.33%) | ||
| Mean age [years] | 74.44 (SD 8.97) | 74.48 (SD 9.04) | t = − 0.125, p = 0.9004 | |
| NYHA class | NYHA I | 19 (0.98%) | 36 (0.98%) | – |
| NYHA II | 614 (31.60%) | 1175 (31.60%) | ||
| NYHA III | 779 (40.09%) | 1491 (40.09%) | ||
| NYHA IV | 531 (27.33%) | 1016 (27.33%) | ||
| Hospital admissions | All causes | 2.54 (SD 1.73) | 2.53 (SD 1.88) | t = 0.090, p = 0.9283 |
| (baseline year) | Related to CHF | 1.37 (SD 0,86) | 1.37 (SD 0.86) | – |
| Emergency hospitalization (baseline year) | All causes | 0.65 (SD 1.27) | 0.55 (SD 1.30) | t = 2.752, p = 0.0059** |
| Total health costs [€] (quarterly mean in baseline year, SD) | All regions | 3747 (3007) | 3750 (3021) | t = −0.037, p = 0.9705 |
| Urban | 3723 (2900) | 3959 (3503) | t = −1.555, p = 0.1201 | |
| Rural | 3820 (3313) | 3677 (2829) | t = 0.882, p = 0.3777 | |
| Health cost [€] (mean, SD) | In-patient | 2464 (2376) | 2403 (2322) | t = 0.896, p = 0.3702 |
| Outpatient | 296 (635) | 294 (764) | t = 0.126, p = 0.9000 | |
| Drugs | 547 (788) | 564 (751) | t = − 0.752, p = 0.4523 | |
| Remedy | 49 (131) | 39 (126) | t = 2.705, p = 0.0068** | |
| Adjuvant | 97 (213) | 110 (226) | t = −2.100, p = 0.0358* | |
| Home health care | 127 (525) | 140.06 (426) | t = −0.919, p = 0.3583 | |
| Travel costs | 160 (271) | 198 (304) | t = −4.660, p < 0.0001*** | |
| Rehabilitation | 7 (44) | 3 (27) | t = 3.738, p = 0.0002*** | |
| Medication (percentage “yes” per active agent in baseline quarter) | Angiotensin-converting enzymes | 845 (43.49%) | 1637 (44.01%) | Chi2 = 0.119, p = 0.7301 |
| Beta-blockers | 1261 (64.90%) | 2340 (62.93%) | Chi2 = 2.057, p = 0.1515 | |
| Renin-inhibitors | 36 (1.85%) | 51 (1.36%) | Chi2 = 1.754, p = 0.1853 | |
| Cardiac glycosides | 279 (14.36%) | 548 (14.73%) | Chi2 = 0.111, p = 0.7388 | |
| Diuretics | 1298 (66.80%) | 2507 (67.40%) | Chi2 = 0.178, p = 0.6727 | |
| AT1 receptor blocker | 385 (19.81%) | 651 (17.51%) | Chi2 = 4.397, p = 0.0360* | |
| Mental and behavioral disorders | Yes | 743 (38.24%) | 1421 (38.20%) | – |
| disorders (baseline quarter) | No | 1200 (61.76%) | 2298 (61.80%) | |
| Residential Area | Berlin | 1461 (75.19%) | 969 (26.06%) | Chi2 = 1411.6, p < 0.0001*** |
| Brandenburg | 436 (22.44%) | 1482 (39.84%) | ||
| Mecklenburg-Western Pomerania | 27 (1.39%) | 1235 (33.20%) | ||
| Other | 19 (0.98%) | 34 (0.90%) | ||
| Nursing care level of carea | No care | 1398 (71.95%) | 2678 (72.02%) | Chi2 = 20.932, p = 0.0001*** |
| Level 1 | 376 (19.35%) | 615 (16.53%) | ||
| Level 2 | 159 (8.18%) | 370 (9.94%) | ||
| Level 3 | 10 (0.51%) | 56 (1.52%) | ||
| Living in nursing home | Yes | 159 (8.18%) | 498 (13.39%) | Chi2 = 33.182, p < 0.0001*** |
| No | 1784 (91.82%) | 3221 (86.61%) | ||
aStandardized classification of the level of nursing care in Germany, Significance codes: ***p < 0.001, **p < 0.01, *p < 0.05
Intervention and control group were similar in most variables. Significant differences concerned the medication with AT1 receptor blockers, the number of emergency hospitalizations, the residential area, the level of care, and the proportion of patients living in a nursing home.
One-year follow-up
Figure 1 shows the flowchart of the analysis; 5433 of 5662 patients could be included in the one-year-follow-up analysis. The processed mean average quarterly health costs in the first year following the recruitment the total health care costs differ by 8€ overall between the intervention (2921€) and control (2929€) groups. Comparing the health costs of various subgroups of patients reveals considerable differences. As expected, costs are much higher in the group of patients who died in the year after recruitment. Rural patients caused lower health costs in both groups compared to the patients in Berlin. The crude difference between intervention and control patients was − 64€ in Berlin and − 259€ in rural regions, indicating effect modification which needed to be appropriately addressed in the fully adjusted model. Average health costs in the first year after baseline were broken down to cost segments. Inpatient costs contribute the largest part of the total health costs in both groups (Table 2).
Table 2.
Unadjusted subgroup means of processeda quarterly health costs in the first year after baselineb
| Intervention group | Control group | |||
|---|---|---|---|---|
| Mean (CI 95%) | N | Mean (CI 95%) | N | |
| All Patients | € 2921 (2773–3068) | 1873 | € 2929 (2816–3041) | 3590 |
| Survived first year | € 2397 (2279–2515) | 1670 | € 2417 (2320–2514) | 3105 |
| Died | € 7229 (6509–7948) | 203 | € 6176 (5728–6625) | 485 |
| Male | € 2941 (2740–3142) | 1004 | € 3013 (2854–3172) | 1925 |
| Female | € 2897 (2679–3115) | 869 | € 2830 (2673–2987) | 1665 |
| Urban (Berlin) | € 3023 (2845–3200) | 1405 | € 3086 (2844–3329) | 930 |
| Rural | € 2615 (2360–2869) | 468 | € 2873 (2748–2999) | 2660 |
| Total health costs | € 2921 (2773–3068) | 1873 | € 2929 (2816–3041) | 3590 |
| Inpatient | € 1557 (1441–1673) | 1873 | € 1500 (1419–1580) | 3590 |
| Outpatient | € 364 (322–405) | 1873 | € 346 (309–382) | 3590 |
| Drugs | € 508 (487–529) | 1873 | € 531 (515–547) | 3590 |
| Remedy | € 57 (50–63) | 1873 | € 47 (42–51) | 3590 |
| Adjuvant | € 115 (104–126) | 1873 | € 133 (124–142) | 3590 |
| Home health care | € 155 (134–176) | 1873 | € 179 (163–194) | 3590 |
| Travel costs | € 160 (142–178) | 1873 | € 193 (176–209) | 3590 |
| Rehabilitation | € 5 (3–6) | 1873 | € 2 (1–3) | 3590 |
aHealth costs after performing the excluding-and-capping algorithm
bMaximally 4 quarter years, less for patients who died within first year
To represent the modification of the intervention effect by place of residence of the patients (urban or rural) we added the interaction term “study group x residential area” into the regression model. Table 3 shows the regression model for total health costs in the first year of follow up. This model was adjusted for all matching variables, the patients’ residential area and the interaction between study group and residential area. Statistically significant determinants for lower health costs were the intake of a beta-blocker (p = 0.0014). Significant predictors for higher health costs were higher baseline health costs (p < 0.0001), the intake of diuretics (p < 0.0001) a diagnosis in the group of organic, mental disorders (F00 – F09, p = 0.0018).
Table 3.
Results of regression analysis of processeda quarterly health costs in first year after baseline (N = 5463)
| Reference | Estimate [in €] |
CI 95% | P-value | ||
|---|---|---|---|---|---|
| 2.5% | 97.5% | ||||
| Study group | Control group | −276.04 | − 573.18 | 21.10 | 0.0686 |
| Residential area (Berlin vs. rural) | Rural | 180.81 | −49.03 | 410.65 | 0.1231 |
| Interaction: Group x Residential area | 257.77 | −131.35 | 646.90 | 0.1941 | |
| Age group | |||||
| 46–50 years | 41–45 years | 878.30 | − 652.97 | 2409.58 | 0.2609 |
| 51–55 years | 41–45 years | 669.75 | − 749.92 | 2089.43 | 0.3551 |
| 56–60 years | 41–45 years | 641.50 | −743.15 | 2026.14 | 0.3638 |
| 61–65 years | 41–45 years | 448.94 | − 905.54 | 1803.43 | 0.5159 |
| 66–70 years | 41–45 years | 828.90 | −502.34 | 2160.14 | 0.2223 |
| 71–75 years | 41–45 years | 1117.78 | − 210.13 | 2445.69 | 0.0990 |
| 76–80 years | 41–45 years | 1160.55 | − 167.31 | 2488.41 | 0.0867 |
| 81–85 years | 41–45 years | 973.17 | − 359.70 | 2306.04 | 0.1524 |
| 86–90 years | 41–45 years | 876.95 | − 471.87 | 2225.77 | 0.2025 |
| 91–95 years | 41–45 years | 1168.45 | − 340.20 | 2677.11 | 0.1290 |
| Sex | Male | −73.85 | −245.19 | 97.49 | 0.3982 |
| NYHA class | |||||
| NYHA II | NYHA I | 18.38 | − 793.15 | 829.91 | 0.9646 |
| NYHA III | NYHA I | 210.53 | −600.60 | 1021.65 | 0.6109 |
| NYHA IV | NYHA I | 398.18 | −419.09 | 1215.45 | 0.3396 |
| Hospitalizations related to CHF | (continuous) | 52.03 | −51.72 | 155.79 | 0.3256 |
| Baseline health costs | (continuous) | 0.37 | 0.34 | 0.40 | < 0.0001*** |
| Intake of medication related to CHF (yes / no by groups of agents) | |||||
| Angiotensin-converting enzyme | no | − 139.92 | −313.52 | 33.69 | 0.1142 |
| Beta-blocker | no | −279.06 | − 450.13 | − 107.98 | 0.0014** |
| Renin-inhibitors | no | −75.07 | − 734.15 | 584.01 | 0.8233 |
| Cardiac glycosides | no | 147.81 | −81.40 | 377.01 | 0.2062 |
| Diuretics | no | 394.65 | 214.89 | 574.40 | < 0.0001*** |
| AT1 receptor blocker | no | −25.55 | − 247.64 | 196.54 | 0.8216 |
| Mental and behavioral disorders (yes / no by blocks of ICD-10 Chapter V) | |||||
| F00 – F09 (Organic, including symptomatic, mental disorders) | no | 465.72 | 173.79 | 757.65 | 0.0018** |
| F10 – F19 (Mental and behavioral disorders due to psychoactive substance use) | no | 39.64 | − 257.67 | 336.94 | 0.7938 |
| F20 – F29 (Schizophrenia, schizotypal and delusional disorders) | no | −34.52 | − 936.45 | 867.41 | 0.9402 |
| F30 – F39 (Mood [affective] disorders) | no | 109.85 | −120.77 | 340.48 | 0.3504 |
| F40 – F49 (Neurotic, stress-related and somatoform disorders) | no | 51.25 | − 188.92 | 291.42 | 0.6757 |
| F50 – F59 (Behavioral syndromes associated with physiological disturbances and physical factors) | no | 343.92 | − 130.81 | 818.64 | 0.1556 |
| F60 – F69 (Disorders of adult personality and behavior) | no | −120.35 | − 859.94 | 619.25 | 0.7497 |
| F70 – F79 (Mental retardation) | no | 321.91 | −921.90 | 1565.71 | 0.6119 |
| F80 – F89 (Disorders of psychological development) | no | – | – | – | – |
| F90 – F98 (Behavioral and emotional disorders with onset usually occurring in childhood and adolescence) | no | 612.00 | − 991.08 | 2215.09 | 0.4542 |
| F99 – F99 (Unspecified mental disorders) | no | 490.90 | − 1333.73 | 2315.52 | 0.5979 |
| Intercept | – | 249.86 | − 1318.15 | 1817.88 | 0.7548 |
aHealth costs after performing the excluding-and-capping algorithm, Significance codes: ***p < 0.001, **p < 0.01, *p < 0.05
Compared to the matched controls, total health costs in the first year after baseline were lower in the intervention group. The difference between both groups was − 276€ in rural regions and − 18€. Neither the parameters for the study group nor for the residential area and the interaction between them were statistically significant.
Two-year follow-up
Table 4 shows the regression model for the two-year follow up (sensitivity analysis planned a priori). The model was adjusted for the same parameters as the model for the one-year-follow up. Statistically significant determinant for lower health costs was the intake of beta blockers (p = 0.0007). Higher baseline health costs (p < 0.0001) and the intake of diuretics (p = 0.0003) were significant determinants for higher health costs. The intervention group showed lower health costs in rural regions (− 299€ per quarter year) but higher health costs in Berlin (+ 109€, compound effect of study group (− 299€) and interaction of group and residential area (+ 407€)) compared to the control group.
Table 4.
Results of regression analysis of processeda quarterly health costs in first two years after baseline (N = 2059)
| Reference | Estimate | CI 95% | p-value | ||
|---|---|---|---|---|---|
| 2.5% | 97.5% | ||||
| Study group | Control group | −298.58 | − 1312.13 | 714.97 | 0.5635 |
| Residential area (Berlin vs rural) | Rural | 262.69 | − 101.60 | 626.98 | 0.1575 |
| Interaction: Group x Residential area | 407.35 | 407.35 | 1493.06 | 0.4619 | |
| Age group | |||||
| 46–50 years | 41–45 years | 2832.23 | − 782.80 | 6447.27 | 0.1246 |
| 51–55 years | 41–45 years | 2875.11 | −606.67 | 6356.89 | 0.1055 |
| 56–60 years | 41–45 years | 2600.31 | −823.07 | 6023.69 | 0.1365 |
| 61–65 years | 41–45 years | 2569.53 | −820.65 | 5959.71 | 0.1373 |
| 66–70 years | 41–45 years | 2840.77 | − 533.57 | 6215.11 | 0.0989 |
| 71–75 years | 41–45 years | 3259.24 | − 109.66 | 6628.14 | 0.0579 |
| 76–80 years | 41–45 years | 3318.69 | − 50.93 | 6688.32 | 0.0536 |
| 81–85 years | 41–45 years | 3017.17 | −356.79 | 6391.14 | 0.0796 |
| 86–90 years | 41–45 years | 2919.52 | − 469.23 | 6308.27 | 0.0913 |
| 91–95 years | 41–45 years | 2870.68 | − 689.65 | 6431.00 | 0.1140 |
| Sex | Male | −96.52 | − 369.46 | 176.42 | 0.4881 |
| NYHA class | |||||
| NYHA II | NYHA I | 314.97 | −757.31 | 1387.24 | 0.5646 |
| NYHA III | NYHA I | 375.11 | − 696.74 | 1446.96 | 0.4926 |
| NYHA IV | NYHA I | 776.31 | −302.57 | 1855.18 | 0.1584 |
| Hospitalizations related to CHF | (continuous) | −27.61 | − 195.63 | 140.40 | 0.7472 |
| Baseline health costs | (continuous) | 0.34 | 0.29 | 0.39 | < 0.0001*** |
| Intake of medication related to CHF (yes / no by groups of agents) | |||||
| Angiotensin-converting enzyme | no | −251.08 | − 520.92 | 18.76 | 0.0682 |
| Beta-blocker | no | − 470.81 | − 741.91 | −199.71 | 0.0007*** |
| Renin-inhibitors | no | −283.79 | − 1553.61 | 986.03 | 0.6612 |
| Cardiac glycosides | no | 97.57 | − 252.61 | 447.75 | 0.5848 |
| Diuretics | no | 533.86 | 247.94 | 819.78 | 0.0003*** |
| AT1 receptor blocker | no | −140.25 | −491.33 | 210.83 | 0.4335 |
| Mental and behavioral disorders (yes / no by blocks of ICD-10 Chapter V) | |||||
| F00 – F09 (Organic, including symptomatic, mental disorders) | no | 386.31 | −87.09 | 859.70 | 0.1097 |
| F10 – F19 (Mental and behavioral disorders due to psychoactive substance use) | no | −83.55 | − 544.49 | 377.39 | 0.7223 |
| F20 – F29 (Schizophrenia, schizotypal and delusional disorders) | no | − 288.83 | − 1375.19 | 797.53 | 0.6021 |
| F30 – F39 (Mood [affective] disorders) | no | 30.78 | − 326.67 | 388.23 | 0.8659 |
| F40 – F49 (Neurotic, stress-related and somatoform disorders) | no | 11.66 | − 351.60 | 374.92 | 0.9498 |
| F50 – F59 (Behavioral syndromes associated with physiological disturbances and physical factors) | no | −86.95 | − 775.45 | 601.54 | 0.8044 |
| F60 – F69 (Disorders of adult personality and behavior) | no | 816.43 | − 367.37 | 2000.23 | 0.1764 |
| F70 – F79 (Mental retardation) | no | 291.70 | − 2155.13 | 2738.54 | 0.8152 |
| F80 – F89 (Disorders of psychological development) | no | – | – | – | – |
| F90 – F98 (Behavioral and emotional disorders with onset usually occurring in childhood and adolescence) | no | −340.42 | − 2933.64 | 2252.80 | 0.7969 |
| F99 – F99 (Unspecified mental disorders) | no | 5878.45 | − 562.31 | 12,319.21 | 0.0736 |
| Intercept | – | − 1689.37 | − 5226.05 | 1847.32 | 0.3490 |
aHealth costs after performing the excluding-and-capping algorithm, Significance codes: ***p < 0.001, **p < 0.01, *p < 0.05
Sensitivity analysis (treated patients)
In a sensitivity analysis, the total health costs per quarter year of patients with a documented start of treatment were compared to a separately matched control group. Here, only the one-year follow-up was analyzed because data of a large part of the participants were not available for two-year follow-up. The intervention group showed lower health costs in rural regions (− 551€ per quarter year) and in urban regions (− 267€, compound effect of study group (− 551€) and interaction of group and residential area (+ 284€)) as well.
Discussion
In an analysis based on routine data, collected for reimbursement purposes, it was shown that the total health costs for intervention patients after one year were lower compared to a control group that had been matched for a large array of variables. Beside age, NYHA-class and baseline health costs, somewhat unexpectedly, the place of residence of the participating patients (urban or rural) was an important determinant for the development of the health costs over time (generally with better development for patients with a rural place of residence). A possible cause could be the higher availability of health care services in urban areas that tend to be more cost-intensive at the same time.
In addition to the intention-to-treat analysis, we performed a treated analysis with patients for which the beginning of the intervention was positively documented. The results of the treated analysis support the findings of the more conservative intention-to-treat approach.
Hendricks et al. analyzed inpatient treatment costs of 1202 patients participating in a telemedicine monitoring program from a large German statutory health insurance company. The follow-up time was 54 months. The average annual costs for CHF related inpatient treatment in the intervention group were significantly lower than the equivalent costs in the control group (684€ per patient, Mann-Whitney-U-Test: p < 0.0001). Both groups show no significant differences in respect of number of hospital days and average costs per hospital stay [17].
In a prospective study on inpatient costs, 502 patients were randomized into an intervention and a control group. The intervention consisted of the monitoring of the body weight of the participants during one year. After an average observation period of 12 months, the annual hospital costs were reduced by 7128€ per patient while annual drug expenditure had increased by 245€ per patient (not significant). The total treatment costs had decreased by 6993€ per patient (p = 0.05). Reported savings are much greater compared to our results. But unfortunately, the authors don’t adjust the results for baseline differences [18].
Neumann et al. evaluated the results of the HeartNetCare-HF (HNC) study (Würzburg / Germany). The overall costs per person were 3535€ in the HNC intervention group (n = 352) and 3038€ in the usual group (n = 363) within six months (p value for difference: 0.10). The HNC group showed a reduced risk of all-cause death (9% vs. 14%, p = 0.03). The authors state a positive cost-effectiveness (the ratio between the difference in costs and the difference in all-cause mortality) since HNC accounted for 8284€ per death avoided within the 6 months [19].
Zertiva is a telemedicine program for patients with CHF, offered by the statutory health insurance “Techniker Krankenkasse”. 164 Patients were included after they had been hospitalized due to CHF; the follow-up period was 180 days. The standard care cohort was retrieved from routine data. The telemedicine group showed lower total health costs after 180 days compared to the matched controls (2292€ per patient and 3746€, respectively). Effectiveness adjusted health costs (total health costs divided by “success rate”, meaning no hospitalization due to CHF during follow-up period) accounted for 3065€ for the telemedicine group and 6397€ for the control group, respectively [20].
In a retrospective analysis, conducted on the basis of data from 2009 until 2013 of a comprehensive telehealth program (existing of the transmission of vital data, daily telephone coaching, and continuous decision-making support) the cost data of 575 patients with chronic cardiovascular diseases were compared to the data of 1178 matched patients. The monthly average medical costs were US$588 (SD 1498) in the telehealth group and US$1164 (SD 3037) in the matched control group (p = 0.02) [21]. This study was conducted in Taiwan and results might less comparable to our study.
In many studies on telemonitoring for CHF patients, survival and the number of hospitalizations are endpoints. The effects of telemonitoring on health costs have been analyzed only in few studies. Often, only inpatient health costs instead of total health costs were considered as endpoint. Previous studies differ in design (randomized controlled design vs. use of routine data for comparison), average age, NYHA stage at baseline, and follow-up time. However, in most previous studies intervention groups tend to show reductions in health costs. Compared to our intervention patients, other study groups tend to be younger at baseline, have a lower NYHA class and have a lower number of participants. Moreover, other settings tend to be more specific, included patients seem to less heterogeneous and therefore less reflecting the total group of patients.
Strengths and limitations
A strength of this study is the large number of participating patients and its closeness to regular health care. All data used for the analysis were retrieved from original reimbursement data. Hence, there was no systematic difference in the data structure or data assessment between the patients in the intervention, and in the control group. The documentation of total direct health costs was complete and valid comparisons could be calculated. Since the intervention was conducted in a routine care setting, the results are likely transferable to the entire non-institutionalized CHF population of this statutory health insurance.
The study has several limitations. By applying propensity score matching we can only approximate the advantages of randomized trials. Data on social demographic variables were not available and despite a comprehensive two step matching process some residual confounding may have persisted due to unobserved variables. We could only match patients whose latest diagnose of NYHA class was within the timeframe of the available data (but before the date of matching).
A large part of the patients did not meet the inclusion and exclusion criteria because they had a diagnosed mental disorder at baseline. Possible causes were 1) participating cardiologists were not aware of diagnoses of mental disorders with their patients, 2) exact dates of diagnoses are not available in the data base, the data is stored on the basis of quarter years, and 3) data is reported retrospectively by the providers of medical services.
The large number of patients with mental disorders may have had an influence on the effect size of the intervention. On the other hand, including patients with mental disorders meets the real composition of the patient group and increases the external validity of the results.
The follow-up time is relatively short. Results might be inflated [22, 23] since long term effects like regression to the mean could not be analyzed. Interventions to maintain good adherence for long-term lifestyle changes can be very challenging [24]. The health insurance could not provide information on the number of telephone contacts per patient. As part of the program some patients had received additional services (such as provision of a modem-connected scale), but this was unknown for the individual patients. Finally, only data of one health insurance were available, therefore the results can only be representative for the member population of this statutory health insurance, not for the entirety of CHF patients.
Implications of telemonitoring programs for the treatment of CHF patients
The analysis of the telemonitoring program of the AOK Nordost and the results of other programs show that telemonitoring programs do not increase costs of treatment. This opens good opportunities to integrate telemonitoring programs in the treatment and monitoring of patients with CHF. Especially in rural regions with large distances to providers of medical services, this kind of intervention can ensure or improve the quality of healthcare.
Conclusions
The AOK-Curaplan Herz Plus program reduced short-term health costs, especially in rural regions. The sensitivity analysis (treated approach) shows larger effects which is an indication that the effects do really originate from the telemedicine intervention and that the true impact might be larger than observed in the primary intention-to-treat-analysis.
Acknowledgements
We thank the AOK Nordost for supplying the reimbursement data for the analyses.
Funding
The study was funded by the statutory health insurance AOK Nordost. The AOK Nordost supplied the reimbursement data. The AOK Nordost had no influence on the design of the study, the analysis of the data, the interpretation of the results and the writing of the manuscript.
Availability of data and materials
The data were supplied by the AOK Nordost for this project only. It is not allowed to make these data publicly available.
Abbreviations
- CHF
Chronic heart failure
- HNC
HeartNetCare-Heart Failure Study
- NYHA
New York Heart Association
Authors’ contributions
RH, WH and NvdB designed the study. RH performed the statistical analyses. RH, WH and NvdB interpreted the results. RH wrote the manuscript. All authors read and approved the manuscript.
Ethics approval and consent to participate
Not applicable. Only de-identified health insurance data were used in this study. The statutory health insurance AOK Nordost supplied completely de-identified data and gave us permission to analyze the data in this project and to publish the results in aggregated form.
Consent for publication
Not applicable
Competing interests
The authors declare that they have no competing interests.
Publisher’s Note
Springer Nature remains neutral with regard to jurisdictional claims in published maps and institutional affiliations.
Contributor Information
Robert Herold, Email: r.herold@uke.de.
Wolfgang Hoffmann, Email: wolfgang.hoffmann@uni-greifswald.de.
Neeltje van den Berg, Email: neeltje.vandenberg@uni-greifswald.de.
References
- 1.Statistisches Bundesamt, editor. Diagnosedaten der Patienten und Patientinnen in Krankenhäusern - Fachserie 12 Reihe 6.2.1. Wiesbaden; 2012. p. 103.
- 2.Statistisches Bundesamt, editor. Todesursachen in Deutschland - Fachserie 12 Reihe 4. Wiesbaden; 2013. p. 53.
- 3.Mozaffarian D, Benjamin EJ, Go AS, Arnett DK, Blaha MJ, Cushman M, et al. Heart disease and stroke statistics—2016 update. Circulation. 2016;133:e38–e360. doi: 10.1161/CIR.0000000000000350. [DOI] [PubMed] [Google Scholar]
- 4.Roger VL. Epidemiology of heart failure. Circ Res. 2013;113(6):646–659. doi: 10.1161/CIRCRESAHA.113.300268. [DOI] [PMC free article] [PubMed] [Google Scholar]
- 5.Zugck C, Müller A, Helms TM, Wildau HJ, Becks T, Hacker J, et al. Gesundheitsökonomische Bedeutung der Herzinsuffizienz: Analyse bundesweiter Daten. Dtsch Med Wochenschr. 2010;135:633–638. doi: 10.1055/s-0030-1251912. [DOI] [PubMed] [Google Scholar]
- 6.Neumann T, Biermann J, Erbel R, Neumann A, Wasem J, Ertl G, et al. Heart failure: the commonest reason for hospital admission in Germany: medical and economic perspectives. Dtsch Arztebl Int. 2009;106(16):269–275. doi: 10.3238/arztebl.2009.0269. [DOI] [PMC free article] [PubMed] [Google Scholar]
- 7.Inglis SC, Clark RA, Dierckx R, Prieto-Merino D, Cleland JG. Structured telephone support or non-invasive telemonitoring for patients with heart failure. Cochrane Database Syst Rev. 2015;(10):CD007228. [DOI] [PMC free article] [PubMed]
- 8.Chaudhry SI, Phillips CO, Stewart SS, Riegel B, Mattera JA, Jerant AF, et al. Telemonitoring for patients with chronic heart failure: a systematic review. J Card Fail. 2007;13(1):56–62. doi: 10.1016/j.cardfail.2006.09.001. [DOI] [PMC free article] [PubMed] [Google Scholar]
- 9.Clark RA, Inglis SC, McAlister FA, JGF C, Stewart S. Telemonitoring or structured telephone support programmes for patients with chronic heart failure: systematic review and meta-analysis. BMJ. 2007;334(7600):942. doi: 10.1136/bmj.39156.536968.55. [DOI] [PMC free article] [PubMed] [Google Scholar]
- 10.Gesellschaft für Patientenhilfe DGP mbH. Leistungsmerkmale von Cordiva [Internet]. 2009. Available from: http://www.cordiva.de/de/html/cordiva-programmbeschreibung.html. Accessed 4 Apr 2018.
- 11.Stuart EA, Rubin DB. Best practices in quasi-experimental designs: matching methods for causal inference. In: Osborne JW, editor. Best practices in quantitative social science. Thousand Oaks: SAGE Publications, Inc.; 2007. pp. 155–176. [Google Scholar]
- 12.Ho DE, Imai K, King G, Stuart EA. Matching as nonparametric preprocessing for reducing model dependence in parametric causal inference. Polit Anal. 2007;15(3):199–236. doi: 10.1093/pan/mpl013. [DOI] [Google Scholar]
- 13.Rubin DB. Matching to remove Bias in observational studies. Biometrics. 1973;29(1):159–183. doi: 10.2307/2529684. [DOI] [Google Scholar]
- 14.Ho DE, Imai K, King G, Stuart EA. MatchIt: nonparametric preprocessing for parametric causal inference. J Stat Softw. 2011;42(8)
- 15.Lumley T. Analysis of complex survey samples. J Stat Softw. 2004;9(8):1–19. doi: 10.18637/jss.v009.i08. [DOI] [Google Scholar]
- 16.Core Team R. R: A language and environment for statistical computing. Vienna; 2015.
- 17.Hendricks V, Schmidt S, Vogt A, Gysan D, Latz V, Schwang I, et al. Case management program for patients with chronic heart failure: effectiveness in terms of mortality, hospital admissions and costs. Dtsch Arztebl Int. 2014;111(15):264–270. doi: 10.3238/arztebl.2014.0264. [DOI] [PMC free article] [PubMed] [Google Scholar]
- 18.Kielblock B, Frye C, Kottmair S, Hudler T, Siegmund-Schultze E, Middeke M. Impact of telemetric management on overall treatment costs and mortality rate among patients with chronic heart failure. Dtsch med Wochenschr. 2007;132(9):417–422. doi: 10.1055/s-2007-970350. [DOI] [PubMed] [Google Scholar]
- 19.Neumann A, Mostardt S, Biermann J, Gelbrich G, Goehler A, Geisler BP, et al. Cost-effectiveness and cost-utility of a structured collaborative disease management in the interdisciplinary network for heart failure (INH) study. Clin Res Cardiol. 2014;104(4):304–309. doi: 10.1007/s00392-014-0781-4. [DOI] [PubMed] [Google Scholar]
- 20.Heinen-Kammerer T, Kiencke P, Motzkat K, Nelles S, Liecker B, Petereit F, et al. Telemedizin in der Tertiärprävention: Wirtschaftlichkeitsanalyse des Telemedizin-Projektes Zertiva bei Herzinsuffizienz-Patienten der Techniker Krankenkasse. In: Kirch W, Badura B, et al., editors. Prävention. Berlin/Heidelberg: Springer-Verlag; 2006. [Google Scholar]
- 21.Ho YL, Yu JY, Lin YH, Chen YH, Huang CC, Hsu TP, et al. Assessment of the cost-effectiveness and clinical outcomes of a fourth-generation synchronous telehealth program for the management of chronic cardiovascular disease. J Med Internet Res. 2014;16(6):e145. doi: 10.2196/jmir.3346. [DOI] [PMC free article] [PubMed] [Google Scholar]
- 22.Ioannidis JPA. Why most discovered true associations are inflated. Epidemiology. 2008;19(5):640–648. doi: 10.1097/EDE.0b013e31818131e7. [DOI] [PubMed] [Google Scholar]
- 23.Krum H, Tonkin A. Why do phase III trials of promising heart failure drugs often fail? The contribution of “regression to the truth”. J Card Fail. 2003;9(5):364–367. doi: 10.1054/S1071-9164(03)00018-6. [DOI] [PubMed] [Google Scholar]
- 24.Friedman LM, Furberg CD, Demets DL. Participant adherence. Fundamentals of Clinical Trials. 2010:251–68.
Associated Data
This section collects any data citations, data availability statements, or supplementary materials included in this article.
Data Availability Statement
The data were supplied by the AOK Nordost for this project only. It is not allowed to make these data publicly available.