Abstract
Background
MiR-182-5p, as a member of miRNA family, can be detected in lung cancer and plays an important role in lung cancer. To explore the clinical value of miR-182-5p in lung squamous cell carcinoma (LUSC) and to unveil the molecular mechanism of LUSC.
Methods
The clinical value of miR-182-5p in LUSC was investigated by collecting and calculating data from The Cancer Genome Atlas (TCGA) database, the Gene Expression Omnibus (GEO) database, and real-time quantitative polymerase chain reaction (RT-qPCR). Twelve prediction platforms were used to predict the target genes of miR-182-5p. Protein-protein interaction (PPI) networks and gene ontology (GO), and Kyoto Encyclopedia of Genes and Genomes (KEGG) analyses were used to explore the molecular mechanism of LUSC.
Results
The expression of miR-182-5p was significantly over-expressed in LUSC than in non-cancerous tissues, as evidenced by various approaches, including the TCGA database, GEO microarrays, RT-qPCR, and a comprehensive meta-analysis of 501 LUSC cases and 148 non-cancerous cases. Furthermore, a total of 81 potential target genes were chosen from the union of predicted genes and the TCGA database. GO and KEGG analyses demonstrated that the target genes are involved in pathways related to biological processes. PPIs revealed the relationships between these genes, with EPAS1, PRKCE, NR3C1, and RHOB being located in the center of the PPI network.
Conclusions
MiR-182-5p upregulation greatly contributes to LUSC and may serve as a biomarker in LUSC.
Keywords: GEO, Lung squamous cell carcinoma, RT-qPCR, Target genes, TCGA
Background
Lung cancer is a major cause of death associated with cancer, and its rate continues to increase [1, 2]. Non-small cell lung cancer (NSCLC) accounts for 80% of all lung cancer cases. Subgroups of NSCLC include lung adenocarcinoma, lung squamous cell carcinoma (LUSC), and lung large cell carcinoma. According to recent studies, most patients are diagnosed at an advanced stage, which leads to low cure rates. Only a minority of patients can be treated by surgery [1, 3]. Some patients are treated with chemotherapy, radiation therapy, and targeted therapy, but the 5-year survival rate remains low and many patients are at risk of recurrence [2–6]. The cure rate of lung cancer can be improved by early confirmation. At present, the diagnosis of lung cancer mainly depends on the pathological biopsy. Therefore, it is significant to explore the molecular mechanism of lung cancer and to improve its diagnosis and treatment [7].
MicroRNAs (miRNAs) are a type of endogenous non-coding RNA consisting of 19 to 24 nucleotides with regulatory functions [8–11]. miRNAs play important roles in biological processes. For example, miRNAs regulate the degradation of target mRNAs and deter their translation [8, 12]. Recent reports have shown that miRNAs are involved in the formation, development, and transformation of lung cancer [13–17]. Therefore, we can use miRNAs to detect, diagnose, and cure cancer [9, 13, 18–20].
MiR-182-5p, as a member of miRNAs family, can be detected in many cancers, for example, lung cancer, and the expression of miR-182-5p is upregulated [6, 21]. Several studies indicated that miR-182-5p acts as an onco-miR to enhance tumor cell proliferation [21–23]. However, previous studies have focused on particular aspects of miR-182-5p in LUSC and thus lacked a comprehensive description. The expression value of miR-182-5p was not shown in previous articles, which have often displayed p values of a statistical test. Therefore, data cannot be obtained. In this study, we analyzed 388 LUSC samples from The Cancer Genome Atlas (TCGA) and Gene Expression Omnibus (GEO) database to verify the clinical value of miR-182-5p in LUSC. Next, 23 clinical LUSC samples were used to further prove the clinical value of miR-182-5p. The PubMed, Wiley Online Library, EBSCO, Cochrane Central Register of Controlled Trials, Web of Science, Google Scholar, Ovid, EMBASE, and LILACS were also searched to obtain document sources. Furthermore, we used miRBase (http://www.mirbase.org/) to discern the target genes of miR-182-5p and investigated the enrichment pathways and target genes by KEGG pathway and GO enrichment analyses and protein-protein interaction (PPI) networks. On the basis of the previous literature, we combined more samples and using various methods to reduce the difference between the existing literatures. We hope this study provides comprehensive information on miR-182-5p for the occurrence and progression of LUSC.
Methods
MiR-182 expression in LUSC samples from TCGA database
TCGA database provides comprehensive cancer genomic datasets for researchers where data are available to search, download, and analyze. In this study, we searched TCGA database (https://cancergenome.nih.gov/) to examine miR-182 expression in LUSC tissues. We obtained the miRNA profiles of 338 LUSC tissues and 45 non-cancerous tissues together with the clinical info. Afterward, miR-182 expression was examined from the miRNA profiles. The extracted data were normalized and processed by log2 transformation. Subsequently, statistical analyses were performed to evaluate the miR-182 expression in LUSC tissues and the correlation between miR-182 expression and relevant clinical data. Additionally, to further analyze the overall survival of LUSC, a Kaplan-Meier curve was constructed using the median miR-182 expression value.
MiR-182-5p expression in LUSC tissues from the GEO database
We mined the GEO database (http://www.ncbi.nlm.nih.gov/geo/) to obtain microarray profiles from LUSC samples using the following search terms: (cancer OR carcinoma OR adenocarcinoma OR tumour OR tumor OR malignanc* OR neoplas*) AND (lung OR pulmonary OR respiratory OR respiration OR aspiration OR bronchi OR bronchioles OR alveoli OR pneumocytes OR “air way”). The search results were then specified using the following filters: Series[Entry type], Homo sapiens[Organism]. The microarrays were selected according to the inclusion criteria as follows: miR-182 expression was examined in LUSC tissues and non-cancerous tissues. Microarrays were considered ineligible according to the following exclusion criteria: (1) microarrays did not meet the inclusion criteria; (2) the microarray profile did not include miR-182 expression; (3) the microarray only provided LUSC tissues without a control group; (4) an insufficient number of LUSC samples for analysis; and (5) microarrays used cell line samples. A total of seven datasets were obtained, namely, GSE16025, GSE25508, GSE29248, GSE47525, GSE19945, GSE51853, and GSE74190.
Clinical samples
In our study, 23 formalin-fixed, paraffin-embedded LUSC tissues and their adjacent normal tissues were collected from the Pathology Department of the First Affiliated Hospital of Guangxi Medical University between January 2012 and February 2014. All samples were pathologically confirmed as LUSC by two independent pathologists (Z.-y.L. and G.C.). The study was approved by the Ethics Committee of the First Affiliated Hospital of Guangxi Medical University, and the clinical parameters of 23 patients were shown in Table 1.
Table 1.
Clinical parameters of 23 LUSC patients
| Clinicopathological parameter | n | |
|---|---|---|
| Tissue | LUSC | 23 |
| Non-cancer | 23 | |
| Gender | Male | 18 |
| Female | 5 | |
| Age (years) | < 60 | 15 |
| ≥ 60 | 8 | |
| Smoke | No | 12 |
| Yes | 11 | |
| Tumor size | ≤ 3 cm | 7 |
| > 3 cm | 16 | |
| Vascular invasion | No | 20 |
| Yes | 3 | |
| TNM | I-II | 10 |
| III-IV | 13 | |
| Lymph node metastasis | No | 11 |
| Yes | 12 | |
| Pathological grading | II | 16 |
| III | 7 | |
RT-qPCR
To detect the expression of miR-182 in 23 pairs of samples, RT-qPCR was carried out on an Applied Biosystems PCR 7900 system. Total RNA was extracted and normalized as previously reported [24–28]. The expression levels of miR-182 were evaluated with a mirVana RT-qPCR miRNA Detection Kit (Ambion Inc., Austin, TX, USA). The combination of miR-103 and miR-191 was considered an endogenous control and served as a reference in our previous study [29]. TaqMan MicroRNA Assays from Applied Biosystems were used in the PCR system, and the sequences were as follows: miR-182 (Cat. No. 4427975-002334): UUUGGCAAUGGUAGAACUCACACU; miR-103 (Cat. No. 4427975-000439): AGCAGCAUUGUACAGGGCUAUGA; and miR-191 (Cat. No. 4427975-000490): CAACGGAAUCCCAAAAGCAGCU. The expression of miR-182 in the FFPE experiments was computed with the formula 2-Δcq.
Literature
The keywords were used to search the literature of miR-182-5p in LUSC from PubMed, Wiley Online Library, EBSCO, Cochrane Central Register of Controlled Trials, Web of Science, Google Scholar, Ovid, EMBASE, and LILACS, until 5 October 2017, and the keywords were as follows: (cancer OR carcinoma OR adenocarcinoma OR tumour OR tumor OR malignanc* OR neoplas*) AND (Lung OR pulmonary OR respiratory OR respiration OR aspiration OR bronchi OR bronchioles OR alveoli OR pneumocytes OR “air way”) AND (miR-182 OR miRNA-182 OR microRNA-182 OR miR182 OR miRNA182 OR microRNA182 OR “miR 182” OR “miRNA 182” OR “microRNA 182”OR miR-182-5p OR miRNA-182-5p OR microRNA-182-5p). The studies which were included need to meet the following criteria: (1) the expression of miR-182-5p in LUSC must be detected by Homo sapiens, and (2) the data of the expression of miR-182-5p can be extracted in the studies.
Meta-analysis
A comprehensive meta-analysis was performed using Stata 14.0 software by combining the four sources (RT-qPCR data, TCGA data, GEO datasets, and the literature) reporting miR-182 expression in LUSC. The respective meta-analysis for RT-qPCR data, TCGA data, and GEO datasets was also performed. Pooled data in the meta-analysis were assessed by the standard mean difference (SMD) with a 95% confidential interval (CI). Heterogeneity among the eligible microarrays was evaluated by the chi-squared and I-squared tests. The effect model was then determined according to the heterogeneity. Specifically, a fixed effects model was conducted for the meta-analysis when the heterogeneity was low (I2 ≤ 50% and p > 0.05) and a random effects model was selected if apparent heterogeneity existed (I2 > 50% or p ≤ 0.05) [30]. A summary receiver operating characteristic (sROC) curve was constructed to describe the diagnostic ability of miR-182-5p in LUSC.
MiR-182-5p predicted target genes
MiR-182 target genes were projected in silico with 12 databases (miRWalk, Microt4, miRanda, mirbridge, miRDB, miRMap, miRNAMap, Pictar2, PITA, RNAhybrid, Targetscan, and RNA22). Genes present in at least five databases were further regarded as predicted target genes of miR-182. Two databases (Tarbase and miRTarbase) were employed to gather miR-182 target genes with “strong evidence.” All miR-182 target genes verified by western blot, qPCR, or luciferase reporter assays were selected as validated genes. Moreover, we identified weakly expressed genes in LUSC from TCGA database. Finally, target genes of miR-182 were achieved from the three analyses (predicted genes, validated genes, and genes from TCGA database), which were utilized for further gene pathway analysis, GO analysis, statistical analysis, and generating ROC curves. A correlation analysis between hub genes and miR-182 was also conducted. For all analyses described above, a p-value < 0.05 was regarded to present a significant difference.
Functional enrichment analysis via bioinformatics
Predicted target genes were subjected to GO analysis in the DAVID database [31]. The BINGO plugin of Cytoscape was applied to visualize the GO network. The PPI networks were constructed using STRING 10.0 [32]. We also mapped genes to the KEGG database to identify significant signaling pathways. A p value < 0.001 was regarded to show statistical significance.
Statistical analysis
All statistical analyses were conducted using GraphPad 5.0 software. Student’s t test was used to detect a significant difference in the miR-182 expression between two groups, and one-way analysis of variance was used to study the miR-182 level among three or more groups. Furthermore, ROC curves were constructed, and the area under the curve (AUC) was calculated to assess the diagnostic role of miR-182 in LUSC. The diagnostic efficacy for LUSC was evaluated as low, moderate, or high depending on the AUC—0.5–0.7 (low), 0.7–0.9 (moderate), and 0.9–1.0 (high). A statistical alteration was considered to occur when p < 0.05.
Results
Clinical value of miR-182-5p
Expression of miR-182-5p in LUSC from TCGA database
A total of 338 LUSC cases and 45 adjacent non-cancer cases were collected from TCGA database (Table 2). The expression value of miR-182-5p in the LUSC group was 14.4295 ± 1.16110 and that in the non-cancer group was 12.2828 ± 0.64852. MiR-182-5p expression was clearly over-expressed in the LUSC group in comparison with the non-cancerous group (Fig. 1a). As shown in Fig. 1b, the ROC curve assessed the diagnostic ability of miR-182. To verify this result, we matched the data of 45 patients from TCGA database (Fig. 1c, d). MiR-182 expression was higher in LUSC tissue than in adjacent normal tissues (14.0102 ± 1.17344 and 12.2828 ± 0.64852, respectively, p < 0.001).
Table 2.
Clinicopathological parameters and miR-182 expression in LUSC data from TCGA database
| Characteristic | n | Relevant expression of miR-182 (log2x) | |||
|---|---|---|---|---|---|
| Mean ± SD | t/F value | p value | |||
| Tissue | LUSC | 338 | 14.4295 ± 1.16110 | − 18.590a | < 0.001 |
| Non-cancerous | 45 | 12.2828 ± 0.64852 | |||
| Gender | Male | 254 | 14.4792 ± 1.14885 | 1.371 | 0.171 |
| Female | 84 | 14.2791 ± 1.19174 | |||
| Age (years) | ≤ 60 | 177 | 14.4281 ± 1.13491 | − 0.023 | 0.982 |
| > 60 | 161 | 14.4310 ± 1.19279 | |||
| Pathologic T | T1 | 80 | 14.4445 ± 1.13309 | 0.912b | 0.435 |
| T2 | 189 | 14.4866 ± 1.16154 | |||
| T3 | 58 | 14.3072 ± 1.22759 | |||
| T4 | 11 | 13.9834 ± 0.98341 | |||
| T | T1 + T2 | 269 | 14.4741 ± 1.15120 | 1.396 | 0.164 |
| T3 + T4 | 69 | 14.2556 ± 1.19150 | |||
| Nodes | No | 217 | 14.4176 ± 1.15198 | − 0.250 | 0.803 |
| Yes | 121 | 14.4507 ± 1.18181 | |||
| Metastasis | No | 259 | 14.4528 ± 1.18483 | 0.669 | 0.504 |
| Yes | 79 | 14.3529 ± 1.08334 | |||
| Pathologic stage | I | 157 | 14.3819 ± 1.16704 | 0.654b | 0.581 |
| II | 125 | 14.4825 ± 1.20539 | |||
| III | 50 | 14.4849 ± 1.05204 | |||
| IV | 3 | 13.6550 ± 0.94917 | |||
| Stage | I-II | 282 | 14.4265 ± 1.18313 | − 0.065 | 0.948 |
| III-IV | 53 | 14.4379 ± 1.05597 | |||
| Anatomic organ subdivision | L_lower | 41 | 14.3997 ± 1.31582 | 0.795b | 0.529 |
| L_upper | 90 | 14.2951 ± 1.00576 | |||
| R_lower | 76 | 14.5891 ± 1.17043 | |||
| R_middle | 11 | 14.6375 ± 1.30430 | |||
| R_upper | 96 | 14.4124 ± 1.12167 | |||
| Tumor location | Peripheral | 73 | 14.3940 ± 1.12931 | 0.288 | 0.774 |
| Central | 107 | 14.3435 ± 1.17386 | |||
Statistically significant results (p < 0.05) are indicated in bold
LUSC lung squamous cell carcinoma, SD standard deviation
aStudent’s t test was used for comparison between the experimental and control groups
bOne-way analysis of variance (ANOVA) was used for the analysis of five groups
Fig. 1.
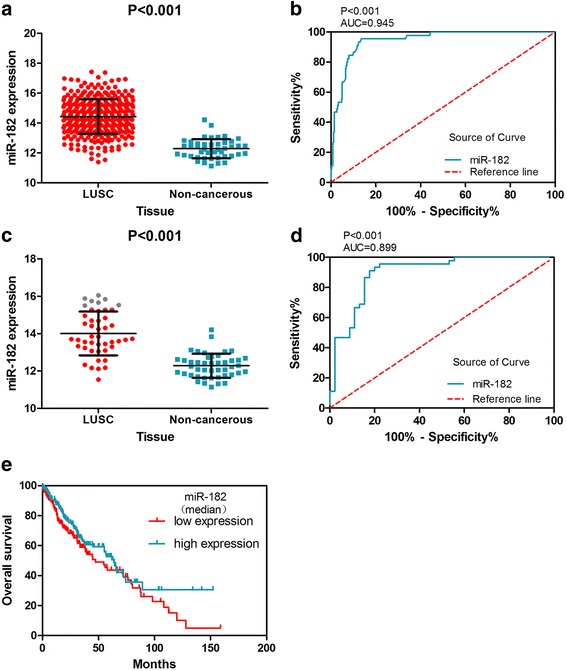
MiR-182 expression is increased in TCGA LUSC samples and has diagnostic value. a The expression of miR-182 in 338 LUSC and 45 non-cancerous lung tissues. b The ROC curve was generated to assess the diagnostic ability of miR-182 in 338 LUSC and 45 non-cancerous lung tissues. The AUC was 0.945 (95% CI 0.9167 to 0.9728, p < 0.001). The sensitivity was 86.39%, and the specificity was 95.56%. c MiR-182 expression in LUSC and adjacent normal tissues from 45 LUSC patients. d The ROC curve was generated to assess the diagnostic ability of miR-182 in LUSC and adjacent normal tissues from 45 LUSC patients. The AUC was 0.899 (95% CI 0.8329 to 0.9656, p < 0.001). The sensitivity was 80.00%, and the specificity was 93.33%. e Assessing the prognosis of TCGA LUSC patients using the Kaplan-Meier curve
Kaplan-Meier curves (Fig. 1e) were constructed to analyze the prognosis of miR-182-5p in LUSC patients. The curves display the median survival of LUSC patients with high miR-182-5p expression (63.73 months) and those with low miR-182-5p expression (47.43 months).
LUSC microarrays from the GEO database
GEO microarrays can be regarded as an auxiliary means to validate the expression of miR-182-5p in LUSC. A total of seven microarrays were selected from the GEO database, namely, GSE16025, GSE25508, GSE29248, GSE47525, GSE19945, GSE51853, and GSE74190 (Fig. 2). Four microarrays (GSE16025, GSE19945, GSE51853, and GSE74190) showed statistical significance in which the miR-182-5p expression level was remarkably increased in LUSC tissues. The expression of miR-182-5p in the GEO microarrays is shown in Table 3. The meta-analysis results are shown in Fig. 3. The forest plot (Fig. 3a) included the miR-182-5p expression data from the seven microarrays. The pooled SMD of miR-182-5p was 1.54 (95% CI 0.74 to 2.34) by the random effects model. The I-squared value was 77.4%, and the p value was less than 0.001. Furthermore, the sensitivity analysis (Fig. 3b) indicated no significant difference among the microarrays. We also assessed the publication bias using a funnel plot (Fig. 3c). The p value from Begg’s test was 1.000 and that from Egger’s test was 0.939. The sROC curve of the GEO microarrays is shown in Fig. 3d. The AUC was 0.97 (95% CI 0.95–0.98). Based on these results, we conclude that these microarrays had no significant publication bias.
Fig. 2.
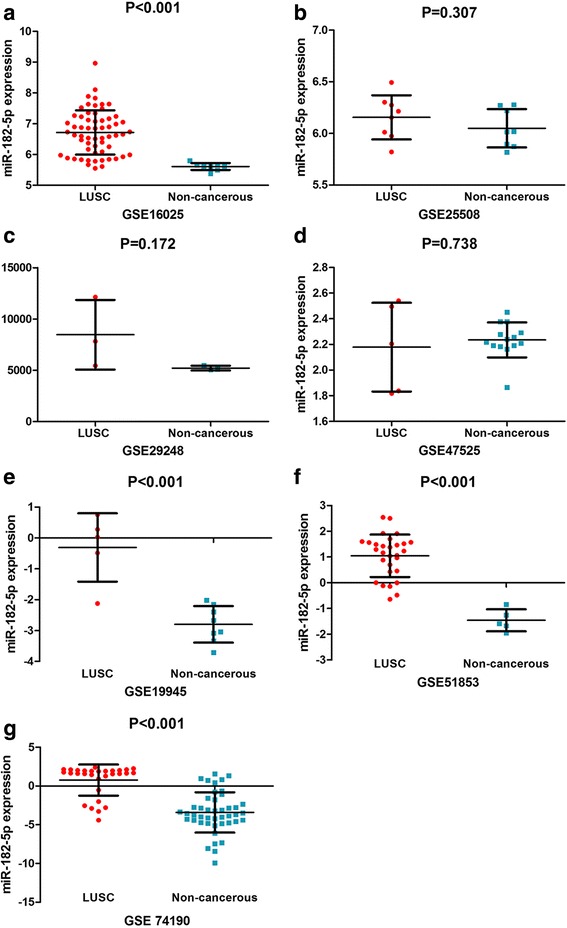
MiR-182-5p expression is over-expressed in LUSC tissues according to GEO microarrays. a Microarray GSE16025. b Microarray GSE25508. c Microarray GSE29248. d Microarray 47,525. e Microarray GSE19945. f Microarray GSE51853. g Microarray GSE74190
Table 3.
Expression of miR-182-5p in the GEO microarrays
| ID | Publication year | Tissue | n | Mean ± SD | t value | p value |
|---|---|---|---|---|---|---|
| GSE16025 | 2009 | LUSC | 60 | 6.718668 ± 0.7187121 | 11.157a | < 0.001 |
| Non-cancerous | 10 | 5.60987 ± 0.1125845 | ||||
| GSE25508 | 2011 | LUSC | 8 | 6.1557 ± 0.21346 | 1.060 | 0.307 |
| Non-cancerous | 8 | 6.0497 ± 0.18564 | ||||
| GSE29248 | 2012 | LUSC | 3 | 8467.2363 ± 3393.2628 | 1.659 | 0.172 |
| Non-cancerous | 3 | 5209.7237 ± 234.24406 | ||||
| GSE47525 | 2013 | LUSC | 5 | 2.1787 ± 0.34594 | − 0.356 | 0.738 |
| Non-cancerous | 14 | 2.2353 ± 0.13647 | ||||
| GSE19945 | 2013 | LUSC | 5 | − 0.309311 ± 1.1072303 | 5.341 | < 0.001 |
| Non-cancerous | 8 | − 2.79921 ± 0.5918523 | ||||
| GSE51853 | 2014 | LUSC | 29 | 1.048088 ± 0.8260201 | 6.576 | < 0.001 |
| Non-cancerous | 5 | − 1.458859 ± 0.4262417 | ||||
| GSE74190 | 2015 | LUSC | 30 | 0.7706 ± 2.0075 | 7.417 | < 0.001 |
| Non-cancerous | 44 | − 3.4043 ± 2.5973 |
Statistically significant results (p < 0.05) are indicated in bold
LUSC lung squamous cell carcinoma, SD standard deviation
aStudent’s t test was used for comparison between the experimental and control groups
Fig. 3.
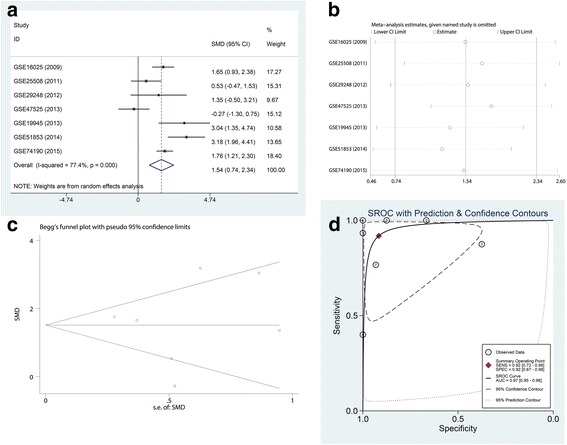
Meta-analysis of GEO microarrays. a Forest plot of miR-182-5p expression data from GEO microarrays. The pooled SMD of miR-182-5p was 1.54 (95% CI 0.74 to 2.34) by the random effects model. The I-squared value was 77.4%, and the p value was less than 0.001. b Sensitivity analysis of GEO microarrays. c A funnel plot was used to show the publication bias of GEO microarrays (Begg’s method). d Summary receiver operating characteristic (sROC) curve (AUC) of miR-182-5p in the diagnosis of LUSC data from the GEO microarrays. The AUC was 0.97 (95% CI 0.95–0.98)
RT-qPCR analysis
We detected the clinical expression level of miR-182-5p by RT-qPCR in 23 LUSC and 23 non-cancerous lung tissues. The miR-182-5p expression whose tumor size was greater than 3 cm was 8.55 ± 3.99, and the expression of whose tumor size was less than 3 cm was 2.96 ± 2.20 (Fig. 4a). In Fig. 4b, the ROC curves show the diagnostic value of miR-182-5p in tumor size.
Fig. 4.
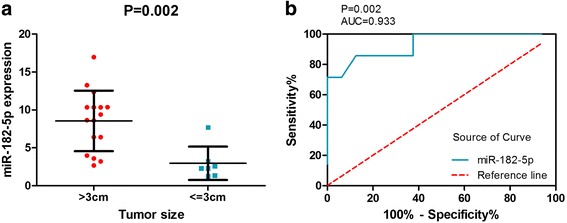
Diagnostic value and expression of miR-182-5p in LUSC. a MiR-182-5p expression in patients whose tumor size was greater than 3 cm and in patients whose tumor size was less than or equal to 3 cm. b The ROC curve was generated to assess the diagnostic ability of miR-182-5p in tumor size. The AUC was 0.933 (95% CI 0.8206 to 1.045, p = 0.002). The sensitivity was 85.71%, and the specificity was 87.50%
Literature
According to the inclusion and exclusion criteria, a total of eight articles examined both LUSC and miR-182-5p [21, 33–39]. However, these articles reported the p values of miR-182-5p expression rather than the mean and standard deviation. Therefore, no data could be extracted.
Meta-analysis of TCGA, GEO, PCR, and literature analyses
We performed a comprehensive meta-analysis using data from TCGA database, GEO microarrays, and PCR. Regarding the literature, the data could not be extracted. A total of 501 LUSC cases and 148 non-cancerous cases were extracted. The random-effect was used in the meta-analysis because the I-squared value was 81.8%. The I-squared value may be caused by the differences in patients, samples processing methods, and statistical methods. The forest plot (Fig. 5a) included the miR-182-5p expression data from PCR, TCGA database, and GEO microarrays. The pooled SMD of miR-182-5p was 1.44 (95% CI 0.83 to 2.05) using the random effects model. The I-squared value was 81.8%, and the p value was less than 0.001. The sensitivity analysis (Fig. 5b) indicated no significant difference among studies. The funnel plot (Fig. 5c) showed a publication bias among these studies. The p value obtained from Begg’s test was 0.754 and that from Egger’s test was 0.678. The sROC curve is shown in Fig. 5d. The AUC was 0.95 (95% CI 0.93–0.97). In summary, these studies showed a mild publication bias.
Fig. 5.
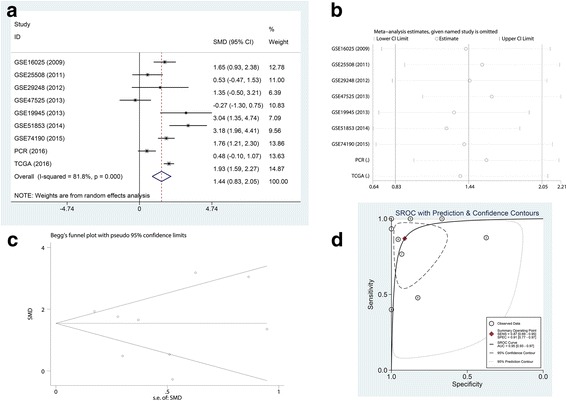
Meta-analysis of PCR, TCGA database, and GEO microarrays. a Forest plot of miR-182-5p expression data from PCR, TCGA database, and GEO microarrays. The pooled SMD of miR-182-5p was 1.44 (95% CI 0.83 to 2.05) by the random effects model. The I-squared value was 81.8%, and the p value was less than 0.001. b Sensitivity analysis of PCR, TCGA database, and GEO microarrays. c The funnel plot shows the publication bias of PCR, TCGA database, and GEO microarrays (Begg’s method). d sROC curve (AUC) of miR-182-5p in the diagnosis of LUSC data from PCR, TCGA database, and GEO microarrays. The AUC was 0.95 (95% CI 0.93–0.97)
Molecular mechanism of miR-182-5p
Prediction of miR-182-5p target genes
The prediction of miR-182-5p target genes was performed using 12 gene prediction platforms. We chose the predicted genes displayed in at least five platforms, which was 7757. The number of verified target genes was 2105. We next downloaded 4648 genes with low miR-182-5p expression in LUSC from TCGA database. Finally, we calculated the union of the three groups, and a total of 81 target genes were chosen. The screening process is displayed in Fig. 6.
Fig. 6.
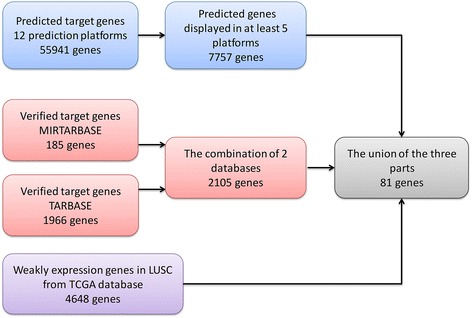
Process of screening target genes
GO and KEGG analyses
Table 4 shows part of the GO enrichment and KEGG pathway analysis results of 81 target genes by DAVID (https://david.ncifcrf.gov/). The GO enrichment analysis was composed of three parts: GO biological process (GO-BP), GO cellular component (GO-CC), and GO molecular function (GO-MF). GO-BP included 56 items, the most important of which were positive regulation of transforming growth factor beta receptor signaling pathway and ventricular septum morphogenesis. GO-CC included 17 items, the most important of which were extracellular exosome and an extrinsic component of the membrane. GO-MF included 15 items, and the target genes were largely involved in protein binding and SH3 domain binding. With respect to the KEGG pathway analysis, the results included nine items. Among these pathways, the Rap1 signaling pathway and platelet activation were important. We also show the GO network for the predicted target genes in Figs. 7, 8, and 9. One node represents one term. Yellow nodes indicate that the terms are more significant.
Table 4.
Enriched GO and KEGG items
| Category | Item | Count |
|---|---|---|
| GO-BP | Positive regulation of transforming growth factor beta receptor signaling pathway | 4 |
| Ventricular septum morphogenesis | 4 | |
| Positive regulation of early endosome to late endosome transport | 3 | |
| Positive regulation of gene expression | 7 | |
| Cellular response to prostaglandin E stimulus | 3 | |
| Signal transduction | 13 | |
| Cell migration | 5 | |
| Negative regulation of cell migration | 4 | |
| GO-CC | Extracellular exosome | 23 |
| Extrinsic component of membrane | 4 | |
| Plasma membrane | 29 | |
| Apical plasma membrane | 6 | |
| Cell periphery | 3 | |
| Cytosol | 23 | |
| Cytoplasm | 32 | |
| Focal adhesion | 6 | |
| GO-MF | Protein binding | 49 |
| SH3 domain binding | 4 | |
| Transcriptional activator activity, RNA polymerase II core promoter proximal region sequence-specific binding | 5 | |
| Heparin binding | 4 | |
| Actin binding | 5 | |
| GTPase activator activity | 5 | |
| Vinculin binding | 2 | |
| Activin binding | 2 | |
| KEGG | Rap1 signaling pathway | 5 |
| Platelet activation | 4 | |
| MicroRNAs in cancer | 5 | |
| cGMP-PKG signaling pathway | 4 | |
| TGF-beta signaling pathway | 3 | |
| Salivary secretion | 3 | |
| Pathways in cancer | 5 | |
| Vascular smooth muscle contraction | 3 |
Table shows eight items each from GO-BP, GO-CC, GO-MF and KEGG
Fig. 7.
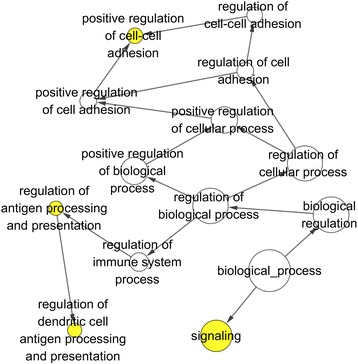
GO biological process (GO-BP) network for the predicted target genes. Nodes represent GO items. Yellow nodes imply that the items are statistically significant (p < 0.01). White nodes imply that the items only take part in connecting items but are not statistically significant
Fig. 8.
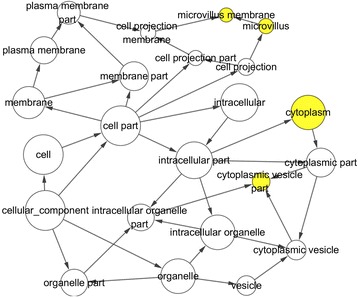
GO cellular component (GO-CC) network for the predicted target genes. Nodes represent GO items. Yellow nodes imply that the items are statistically significant (p < 0.01). White nodes imply that the items only take part in connecting items but are not statistically significant
Fig. 9.
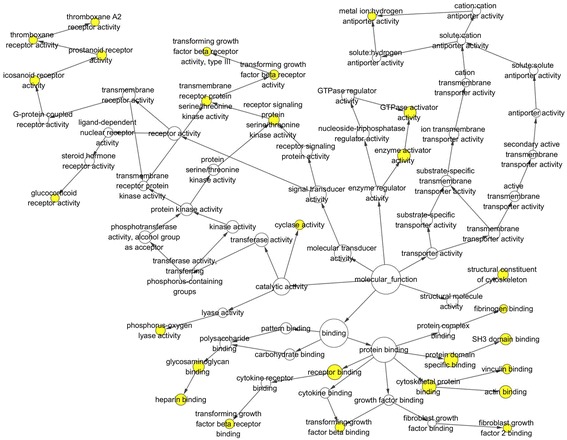
GO molecular function (GO-MF) network for the predicted target genes. Nodes represent GO items. Yellow nodes imply that the items are statistically significant (p < 0.05). White nodes imply that the items only take part in connecting items but are not statistically significant
PPI network of target genes
We identified 31 proteins in the PPI network (Fig. 10), some of which were not associated with other proteins. The more connections between proteins indicate that the protein is more important in LUSC. According to the PPI network, EPAS1, PRKCE, NR3C1, and RHOB are hub genes in LUSC.
Fig. 10.
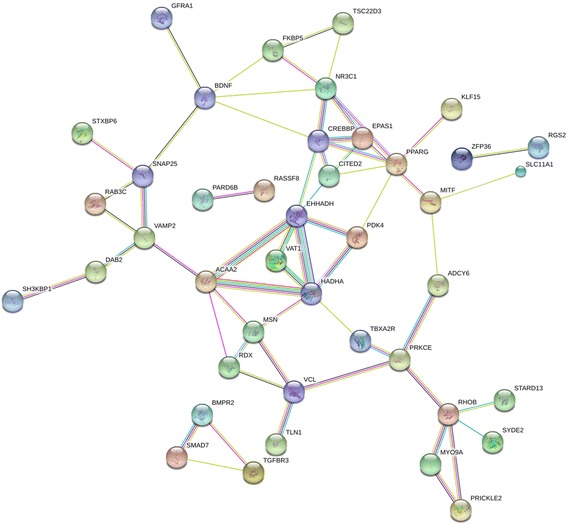
Center genes from the STRING protein-protein interaction network. Nodes represent gene-encoded proteins. Connections between nodes represent the relationship between proteins. A bold line implies a higher confidence level
Clinical expression of hub genes
Among the 81 target genes, EPAS1, PRKCE, NR3C1, and RHOB were located in the center of the PPI network. There were more connections between these four genes, which may indicate that these genes contribute to LUSC. We chose four hub genes (EPAS1, PRKCE, NR3C1, and RHOB) to analyze their clinical expression in 502 LUSC and 49 non-cancerous cases from TCGA database. The expression of EPAS1, PRKCE, NR3C1, and RHOB was decreased in LUSC (Table 5). Figure 11a, c, e, g shows the expression of the four hub genes in LUSC and non-cancerous tissues. Figure 11b, d, f, h shows the ROC curves of the diagnostic ability of the four genes. The AUCs were 0.929 (95% CI 0.9023 to 0.9558, p < 0.001), 0.996 (95% CI 0.9929 to 0.9995, p < 0.001), 0.958 (95% CI 0.9404 to 0.9749, p < 0.001), and 0.929 (95% CI 0.9238 to 0.9774, p < 0.001), respectively. Correlations between the four hub genes and miR-182-5p expression are shown in Fig. 12. The expression of the four hub genes was significantly negatively related to miR-182-5p expression in LUSC.
Table 5.
Expression of four hub genes in LUSC data from TCGA database
| Gene | Mean ± SD | t | p value | |
|---|---|---|---|---|
| LUSC | Non-cancerous | |||
| EPAS1 | 8.606392 ± 1.7655376 | 11.220022 ± 0.6834735 | − 20.831 | < 0.001 |
| PRKCE | 9.428288 ± 0.6642029 | 11.656338 ± 0.6706216 | − 22.394 | < 0.001 |
| NR3C1 | 11.654198 ± 0.5869350 | 12.798826 ± 0.3824635 | − 18.890 | < 0.001 |
| RHOB | 12.884868 ± 0.9119690 | 14.829378 ± 0.6793070 | − 18.478 | < 0.001 |
Statistically significant results (p < 0.05) are indicated in bold
LUSC lung squamous cell carcinoma, SD standard deviation
Fig. 11.
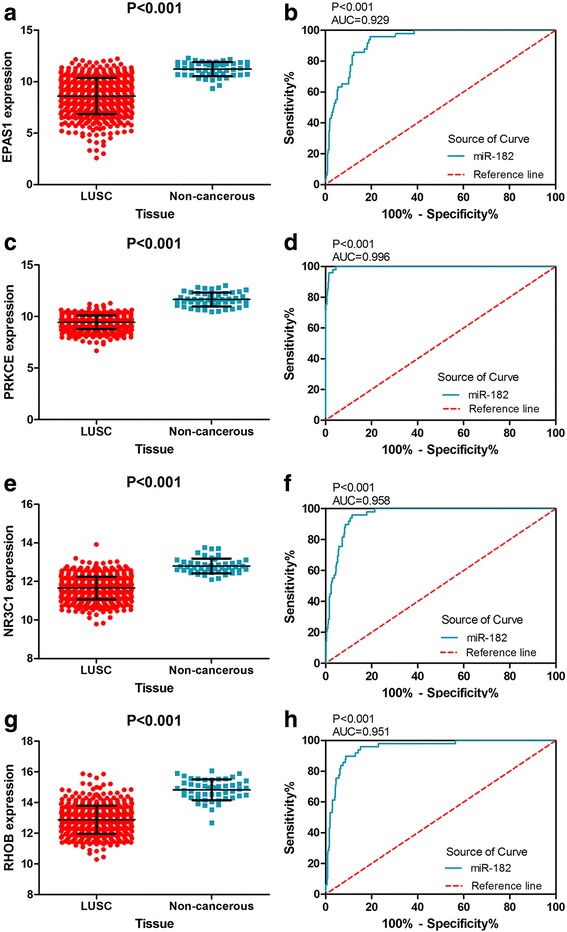
The expression of four hub genes was decreased in TCGA LUSC samples and ROC curve analysis. a The expression of EPAS1 in 502 LUSC and 49 non-cancerous lung tissues. b ROC curve was generated to assess the diagnostic ability of EPAS1 in 502 LUSC and 49 non-cancerous lung tissues. The AUC was 0.929 (95% CI 0.9023 to 0.9558, p < 0.001). c The expression of PRKCE in 502 LUSC and 49 non-cancerous lung tissues. d The ROC curve was generated to assess the diagnostic ability of PRKCE in 502 LUSC and 49 non-cancerous lung tissues. The AUC was 0.996 (95% CI 0.9929 to 0.9995, p < 0.001). e The expression of NR3C1 in 502 LUSC and 49 non-cancerous lung tissues. f The ROC curve was generated to assess the diagnostic ability of NR3C1 in 502 LUSC and 49 non-cancerous lung tissues. The AUC was 0.958 (95% CI 0.9404 to 0.9749, p < 0.001). g The expression of RHOB in 502 LUSC and 49 non-cancerous lung tissues. h The ROC curve was generated to assess the diagnostic ability of RHOB in 502 LUSC and 49 non-cancerous lung tissues. The AUC was 0.929 (95% CI 0.9238 to 0.9774, p < 0.001)
Fig. 12.
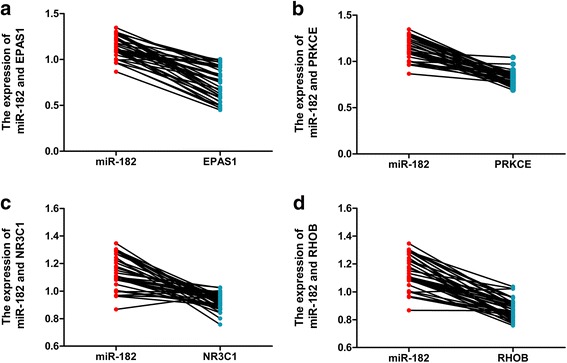
Correlation analysis of the four hub genes decreased in 38 paired LUSC samples from TCGA database. a Correlation between miR-182 and EPAS1. b Correlation between miR-182 and PRKCE. c Correlation between miR-182 and NR3C1. d Correlation between miR-182 and RHOB
Discussion
At present, LUSC is one of the most common cancers and is the chief cause of cancer deaths [1, 40]. Misdiagnosis or metastasis can increase the mortality rate. Therefore, miRs including miR-182-5p are regarded as a new tool used to diagnose LUSC [41].
In our study, we gathered a large amount of data on miR-182-5p expression in LUSC from TCGA and GEO databases and analyzed data from 23 paired clinical LUSC tissues. Herein, a meta-analysis was performed to explore the clinical value of miR-182-5p in LUSC.
There were 338 LUSC cases and 45 adjacent non-cancer cases in TCGA database. The data from TCGA database showed that the miR-182-5p expression in LUSC tissues was higher than in adjacent normal tissues, which indicated that miR-182-5p expression was associated with LUSC. We also included seven microarrays (GSE16025, GSE25508, GSE29248, GSE47525, GSE19945, GSE51853, and GSE74190) in the GEO database. In addition to GSE47525, other microarrays showed an increasing trend in miR-182-5p expression in LUSC compared to non-cancerous tissues. Among them, four microarrays (GSE16025, GSE19945, GSE51853, and GSE74190) showed statistical significance. However, in GSE47525, the result was opposite. MiR-182-5p expression was lower in LUSC tissue than in non-cancerous tissue. The result of GSE47525 may be caused by the small number of patient samples. According to RT-qPCR, miR-182-5p expression was correlated with tumor size. The expression of miR-182-5p tended to be higher when the tumor size was greater than 3 cm. As the tumor is growing, the expression of miR-182-5p was also increasing. The result revealed that the miR-182-5p was important in the progress of LUSC, and miR-182-5p could indicate the deterioration of LUSC. On the basis of the result, miR-182-5p can provide a biomarker to detect the occurrence and development of LUSC. The meta-analysis, which included data from TCGA database, the GEO database, RT-qPCR, and the literature, was the highlight of our study. The meta-analysis rendered the most comprehensive data on miR-182-5p. The pooled SMD of miR-182-5p was 1.44 (95% CI 0.83 to 2.05) by the random effects model, which showed that the high miR-182-5p expression in LUSC was consistent with the literature [8, 13, 14, 35, 39]. Therefore, we conclude that miR-182-5p is markedly over-expressed in LUSC, consistent with the existing research. And the results showed an obvious relationship between the miR-182-5p expression and LUSC.
We also predicted miR-182-5p target genes using 12 prediction platforms and performed a bioinformatics analysis by GO enrichment, KEGG pathway, and PPI network analyses. The GO enrichment and KEGG pathway analyses included 97 items. In GO-BP, the pathway of apoptotic process included the target genes PRKCE, NR3C1, and RHOB. However, the pathway of apoptotic process in LUSC is still unclear. In GO-CC, the cytosol and cytoplasm were enriched in four hub genes. But there was no study of the relationship between the pathway and LUSC. As for GO-MF, EPSA1, PRKCE, NE3C1, and RHOB were all involved in SH3 domain binding. Shim et al. found that SH3 domain-binding protein 1 could suppress the growth of LUSC [42]. Through the thinking, we can slow down the progress of LUSC by SH3 domain binding pathway. Additionally, the KEGG pathway analysis revealed that PRKCE is involved in the pathway of MicroRNAs in cancer, the cGMP-PKG signaling pathway, and pathway of vascular smooth muscle contraction. The function of these pathways in LUSC remains to be studied.
According to our bioinformatics analysis, four genes (EPAS1, PRKCE, NR3C1, and RHOB) were regarded as hub genes in LUSC. EPAS1, which is also known as hypoxia-inducible factor-2α (HIF-2α), belongs to the family of hypoxia-inducible factors (HIFs) [43]. In our study, the expression of EPAS1 was negatively correlated with the expression of miR-182-5p in LUSC. In LUSC, EPAS1 plays the role of a HIF [44]. According to recent studies, the high level of EPAS1 expression could lead to a poor prognosis by increasing the tumor size and angiogenesis [43, 45, 46]. These findings are consistent with the conclusions of our current study.
PRKCE, which consists of 32 exons, is a member of the protein kinase C (PKC) family and regulates the formation of protein kinase C epsilon type (PKCε) [47]. According to our statistical analysis, the high miR-182-5p expression in LUSC is accompanied by the low expression of PRKCE. As an enzyme, PKCε influences many cellular functions, such as growth, division, and transcription factor regulation [48–50]. Wang et al. [51] discovered that PKCε is oncogenic and associated with the occurrence of lung cancer. They also found that PRKCE increases PKCε expression in LUSC.
NR3C1 is also known as GR or GCR and encodes a glucocorticoid receptor to participate in inflammation, cell proliferation, and differentiation [52]. NR3C1 plays an anti-inflammatory role in the development and metastasis of LUSC [53, 54]. Therefore, NR3C1 is important for inhibiting tumor progression.
RHOB belongs to the Ras homolog gene family. RHOB plays a role in cell proliferation and survival [55]. RHOB also inhibits tumor growth. If RHOB is lacking, the tumor frequency increases [56]. A recent study found that the lack of RHOB often occurs in LUSC [57]. According to our study, the expression of RHOB is downregulated in LUSC, consistent with the report by Mazières et al. [56].
According to the present study, miR-182-5p is upregulated in LUSC and plays a pivotal role in the process of LUSC. Through our research, miR-182-5p is found that it is involved in several biological processes to inhibit LUSC progression and improve the cure rate, and it can offer a new idea of LUSC diagnosis and therapy in molecular mechanism to us.
Conclusion
Our study collected a lot of data from TCGA, GEO, and RT-qPCR and verified the clinical value and diagnostic significance of the high miR-182-5p expression in LUSC. According to the result of target genes, 81 genes were related to the molecular mechanism of miR-182-5p in LUSC. The result of GO and KEGG pathway can provide the idea to cure LUSC in the molecular mechanism.
Acknowledgements
We expressed sincere thanks to the patients included in this study, the research group members(Wei-luan Cen, Xiang Gao, Peng Chen, Li Gao, Zu-cheng Xie), the target gene prediction tools (miRWalk, Microt4, miRanda, mirbridge, miRDB, miRMap, miRNAMap, Pictar2, PITA, RNA22, RNAhybrid, Targetscan and mirTarbase), and the TCGA, GEO, DAVID, and STRING databases.
Funding
The current study was supported by funds from the Promoting Project of Basic Capacity for Young and Middle-aged University Teachers in Guangxi (KY2016YB077), the Scientific Research Project of the Guangxi Education Agency (KY2015LX062), and the Guangxi Zhuang Autonomous Region University Student Innovative Plan (201710598080). The funders had no role in the study design, data collection and analysis, decision to publish, or preparation of the manuscript.
Availability of data and materials
Data collected or analyzed during this study are included in this article, and all patients signed informed consent.
Abbreviations
- AUC
Area under the curve
- CI
Confidential interval
- GEO
Gene expression omnibus
- GO
Gene ontology
- GO-BP
GO biological process
- GO-CC
GO cellular component
- GO-MF
GO molecular function
- KEGG
Kyoto Encyclopedia of Genes and Genomes
- LUSC
Lung squamous cell carcinoma
- miRNAs
MicroRNAs
- NSCLC
Non-small cell lung cancer
- PPI
Protein-protein interaction
- RT-qPCR
Real-time quantitative polymerase chain reaction
- SMD
Standard mean difference
- sROC
Summary receiver operating characteristic
- TCGA
The Cancer Genome Atlas
Authors’ contributions
All authors have contributed to this study for submission. The contributions are as follows: JL contributed to the conception and modification of the study and writing of the paper draft. KS contributed to the data analysis and paper writing. SyY analyzed the target genes by GO, KEGG pathway, and PPI network and wrote the results. RxT collected and analyzed the data from TCGA database and wrote the results. WjC collected and analyzed the data from GEO database and wrote the results. LzH helped to perform the RT-qPCR and analyze the RT-qPCR data. TqG contributed to the design of the study, guided the study method, and corrected the paper. ZwC contributed to the design of the study and revised the paper. GC contributed to the design of the study, supervised all experiments, and corrected the paper. All authors read and approved the final manuscript.
Ethics approval and consent to participate
The study was approved by the Ethics Committee of the First Affiliated Hospital of Guangxi Medical University.
Competing interests
The authors declare that they have no competing interests.
Publisher’s Note
Springer Nature remains neutral with regard to jurisdictional claims in published maps and institutional affiliations.
Contributor Information
Ting-qing Gan, Phone: +86-771-327 7068, Email: gantingqing_gxmu@163.com.
Zheng-wen Cai, Phone: +86-771-327 7068, Email: 99CCZZWW@sina.com.
References
- 1.Siegel RL, Miller KD, Jemal A. Cancer statistics, 2015. CA Cancer J Clin. 2015;65:5–29. doi: 10.3322/caac.21254. [DOI] [PubMed] [Google Scholar]
- 2.Milovancev A, Stojsic V, Zaric B, Kovacevic T, Sarcev T, Perin B, Zarogoulidis K, Tsirgogianni K, Freitag L, Darwiche K, et al. EGFR-TKIs in adjuvant treatment of lung cancer: to give or not to give? Onco Targets Ther. 2015;8:2915–2921. doi: 10.2147/OTT.S91627. [DOI] [PMC free article] [PubMed] [Google Scholar]
- 3.Szakacs G, Paterson JK, Ludwig JA, Booth-Genthe C, Gottesman MM. Targeting multidrug resistance in cancer. Nat Rev Drug Discov. 2006;5:219–234. doi: 10.1038/nrd1984. [DOI] [PubMed] [Google Scholar]
- 4.Liu J, Dong M, Sun X, Li W, Xing L, Yu J. Prognostic value of 18F-FDG PET/CT in surgical non-small cell lung cancer: a meta-analysis. PLoS One. 2016;11:e0146195. doi: 10.1371/journal.pone.0146195. [DOI] [PMC free article] [PubMed] [Google Scholar]
- 5.Liu KJ, Ding LY, Wu HY. Bevacizumab in combination with anticancer drugs for previously treated advanced non-small cell lung cancer. Tumour Biol. 2015;36:1323–1327. doi: 10.1007/s13277-014-2962-1. [DOI] [PubMed] [Google Scholar]
- 6.Ning FL, Wang F, Li ML, Yu ZS, Hao YZ, Chen SS. MicroRNA-182 modulates chemosensitivity of human non-small cell lung cancer to cisplatin by targeting PDCD4. Diagn Pathol. 2014;9:143. doi: 10.1186/1746-1596-9-143. [DOI] [PMC free article] [PubMed] [Google Scholar]
- 7.Cheng D, Sun Y, He H. The diagnostic accuracy of HE4 in lung cancer: a meta-analysis. Dis Markers. 2015;2015:352670. doi: 10.1155/2015/352670. [DOI] [PMC free article] [PubMed] [Google Scholar]
- 8.Macha MA, Seshacharyulu P, Krishn SR, Pai P, Rachagani S, Jain M, Batra SK. MicroRNAs (miRNAs) as biomarker(s) for prognosis and diagnosis of gastrointestinal (GI) cancers. Curr Pharm Des. 2014;20:5287–5297. doi: 10.2174/1381612820666140128213117. [DOI] [PMC free article] [PubMed] [Google Scholar]
- 9.Tricoli JV, Jacobson JW. MicroRNA: potential for cancer detection, diagnosis, and prognosis. Cancer Res. 2007;67:4553–4555. doi: 10.1158/0008-5472.CAN-07-0563. [DOI] [PubMed] [Google Scholar]
- 10.Gartel AL, Kandel ES. miRNAs: little known mediators of oncogenesis. Semin Cancer Biol. 2008;18:103–110. doi: 10.1016/j.semcancer.2008.01.008. [DOI] [PubMed] [Google Scholar]
- 11.Artzi S, Kiezun A, Shomron N. miRNAminer: a tool for homologous microRNA gene search. BMC Bioinformatics. 2008;9:39. doi: 10.1186/1471-2105-9-39. [DOI] [PMC free article] [PubMed] [Google Scholar]
- 12.Farazi TA, Spitzer JI, Morozov P, Tuschl T. miRNAs in human cancer. J Pathol. 2011;223:102–115. doi: 10.1002/path.2806. [DOI] [PMC free article] [PubMed] [Google Scholar]
- 13.Bertoli G, Cava C, Castiglioni I. MicroRNAs: new biomarkers for diagnosis, prognosis, therapy prediction and therapeutic tools for breast cancer. Theranostics. 2015;5:1122–1143. doi: 10.7150/thno.11543. [DOI] [PMC free article] [PubMed] [Google Scholar]
- 14.Inamura K, Ishikawa Y. MicroRNA in lung cancer: novel biomarkers and potential tools for treatment. J Clin Med. 2016;5:36. doi: 10.3390/jcm5030036. [DOI] [PMC free article] [PubMed] [Google Scholar]
- 15.Yang G, Zhang X, Shi J. MiR-98 inhibits cell proliferation and invasion of non-small cell carcinoma lung cancer by targeting PAK1. Int J Clin Exp Med. 2015;8:20135–20145. [PMC free article] [PubMed] [Google Scholar]
- 16.Suzuki H, Maruyama R, Yamamoto E, Kai M. DNA methylation and microRNA dysregulation in cancer. Mol Oncol. 2012;6:567–578. doi: 10.1016/j.molonc.2012.07.007. [DOI] [PMC free article] [PubMed] [Google Scholar]
- 17.Chen PS, Su JL, Hung MC. Dysregulation of microRNAs in cancer. J Biomed Sci. 2012;19:90. doi: 10.1186/1423-0127-19-90. [DOI] [PMC free article] [PubMed] [Google Scholar]
- 18.Raponi M, Dossey L, Jatkoe T, Wu X, Chen G, Fan H, Beer DG. MicroRNA classifiers for predicting prognosis of squamous cell lung cancer. Cancer Res. 2009;69:5776–5783. doi: 10.1158/0008-5472.CAN-09-0587. [DOI] [PubMed] [Google Scholar]
- 19.Tan X, Qin W, Zhang L, Hang J, Li B, Zhang C, Wan J, Zhou F, Shao K, Sun Y, et al. A 5-microRNA signature for lung squamous cell carcinoma diagnosis and hsa-miR-31 for prognosis. Clin Cancer Res. 2011;17:6802–6811. doi: 10.1158/1078-0432.CCR-11-0419. [DOI] [PubMed] [Google Scholar]
- 20.Markou A, Sourvinou I, Vorkas PA, Yousef GM, Lianidou E. Clinical evaluation of microRNA expression profiling in non small cell lung cancer. Lung Cancer. 2013;81:388–396. doi: 10.1016/j.lungcan.2013.05.007. [DOI] [PubMed] [Google Scholar]
- 21.Guan P, Yin Z, Li X, Wu W, Zhou B. Meta-analysis of human lung cancer microRNA expression profiling studies comparing cancer tissues with normal tissues. J Exp Clin Cancer Res. 2012;31:54. doi: 10.1186/1756-9966-31-54. [DOI] [PMC free article] [PubMed] [Google Scholar]
- 22.Yang WB, Chen PH, Ts H, Fu TF, Su WC, Liaw H, Chang WC, Hung JJ. Sp1-mediated microRNA-182 expression regulates lung cancer progression. Oncotarget. 2014;5:740–753. doi: 10.18632/oncotarget.1608. [DOI] [PMC free article] [PubMed] [Google Scholar]
- 23.Wang M, Wang Y, Zang W, Wang H, Chu H, Li P, Li M, Zhang G, Zhao G. Downregulation of microRNA-182 inhibits cell growth and invasion by targeting programmed cell death 4 in human lung adenocarcinoma cells. Tumour Biol. 2014;35:39–46. doi: 10.1007/s13277-013-1004-8. [DOI] [PubMed] [Google Scholar]
- 24.Lee YS, Kim H, Kim HW, Lee JC, Paik KH, Kang J, Kim J, Yoon YS, Han HS, Sohn I, et al. High expression of microRNA-196a indicates poor prognosis in resected pancreatic neuroendocrine tumor. Medicine (Baltimore) 2015;94:e2224. doi: 10.1097/MD.0000000000002224. [DOI] [PMC free article] [PubMed] [Google Scholar]
- 25.Gan TQ, Tang RX, He RQ, Dang YW, Xie Y, Chen G. Upregulated MiR-1269 in hepatocellular carcinoma and its clinical significance. Int J Clin Exp Med. 2015;8:714–721. [PMC free article] [PubMed] [Google Scholar]
- 26.Zhang X, Tang W, Li R, He R, Gan T, Luo Y, Chen G, Rong M. Downregulation of microRNA-132 indicates progression in hepatocellular carcinoma. Exp Ther Med. 2016;12:2095–2101. doi: 10.3892/etm.2016.3613. [DOI] [PMC free article] [PubMed] [Google Scholar]
- 27.Pan L, Huang S, He R, Rong M, Dang Y, Chen G. Decreased expression and clinical significance of miR-148a in hepatocellular carcinoma tissues. Eur J Med Res. 2014;19:68. doi: 10.1186/s40001-014-0068-2. [DOI] [PMC free article] [PubMed] [Google Scholar]
- 28.Dang YW, Zeng J, He RQ, Rong MH, Luo DZ, Chen G. Effects of miR-152 on cell growth inhibition, motility suppression and apoptosis induction in hepatocellular carcinoma cells. Asian Pac J Cancer Prev. 2014;15:4969–4976. doi: 10.7314/APJCP.2014.15.12.4969. [DOI] [PubMed] [Google Scholar]
- 29.Chen G, Umelo IA, Lv S, Teugels E, Fostier K, Kronenberger P, Dewaele A, Sadones J, Geers C, De Greve J. miR-146a inhibits cell growth, cell migration and induces apoptosis in non-small cell lung cancer cells. PLoS One. 2013;8:e60317. doi: 10.1371/journal.pone.0060317. [DOI] [PMC free article] [PubMed] [Google Scholar]
- 30.Ioannidis JP, Patsopoulos NA, Evangelou E. Uncertainty in heterogeneity estimates in meta-analyses. BMJ. 2007;335:914–916. doi: 10.1136/bmj.39343.408449.80. [DOI] [PMC free article] [PubMed] [Google Scholar]
- 31.Huang da W, Sherman BT, Lempicki RA. Systematic and integrative analysis of large gene lists using DAVID bioinformatics resources. Nat Protoc. 2009;4:44–57. doi: 10.1038/nprot.2008.211. [DOI] [PubMed] [Google Scholar]
- 32.Szklarczyk D, Franceschini A, Wyder S, Forslund K, Heller D, Huerta-Cepas J, Simonovic M, Roth A, Santos A, Tsafou KP, et al. STRING v10: protein-protein interaction networks, integrated over the tree of life. Nucleic Acids Res. 2015;43:D447–D452. doi: 10.1093/nar/gku1003. [DOI] [PMC free article] [PubMed] [Google Scholar]
- 33.Song R, Liu Q, Hutvagner G, Nguyen H, Ramamohanarao K, Wong L, Li J. Rule discovery and distance separation to detect reliable miRNA biomarkers for the diagnosis of lung squamous cell carcinoma. BMC Genomics. 2014;15(Suppl 9):S16. doi: 10.1186/1471-2164-15-S9-S16. [DOI] [PMC free article] [PubMed] [Google Scholar]
- 34.Zhu W, Liu X, He J, Chen D, Hunag Y, Zhang YK. Overexpression of members of the microRNA-183 family is a risk factor for lung cancer: a case control study. BMC Cancer. 2011;11:393. doi: 10.1186/1471-2407-11-393. [DOI] [PMC free article] [PubMed] [Google Scholar]
- 35.Stenvold H, Donnem T, Andersen S, Al-Saad S, Busund LT, Bremnes RM. Stage and tissue-specific prognostic impact of miR-182 in NSCLC. BMC Cancer. 2014;14:138. doi: 10.1186/1471-2407-14-138. [DOI] [PMC free article] [PubMed] [Google Scholar]
- 36.Zhu YJ, Xu B, Xia W. Hsa-mir-182 downregulates RASA1 and suppresses lung squamous cell carcinoma cell proliferation. Clin Lab. 2014;60:155–159. doi: 10.7754/clin.lab.2013.121131. [DOI] [PubMed] [Google Scholar]
- 37.Zheng D, Haddadin S, Wang Y, Gu LQ, Perry MC, Freter CE, Wang MX. Plasma microRNAs as novel biomarkers for early detection of lung cancer. Int J Clin Exp Pathol. 2011;4:575–586. [PMC free article] [PubMed] [Google Scholar]
- 38.Zhang QH, Sun HM, Zheng RZ, Li YC, Zhang Q, Cheng P, Tang ZH, Huang F. Meta-analysis of microRNA-183 family expression in human cancer studies comparing cancer tissues with noncancerous tissues. Gene. 2013;527:26–32. doi: 10.1016/j.gene.2013.06.006. [DOI] [PubMed] [Google Scholar]
- 39.Vosa U, Vooder T, Kolde R, Vilo J, Metspalu A, Annilo T. Meta-analysis of microRNA expression in lung cancer. Int J Cancer. 2013;132:2884–2893. doi: 10.1002/ijc.27981. [DOI] [PubMed] [Google Scholar]
- 40.Jemal A, Bray F, Center MM, Ferlay J, Ward E, Forman D. Global cancer statistics. CA Cancer J Clin. 2011;61:69–90. doi: 10.3322/caac.20107. [DOI] [PubMed] [Google Scholar]
- 41.Roa W, Brunet B, Guo L, Amanie J, Fairchild A, Gabos Z, Nijjar T, Scrimger R, Yee D, Xing J. Identification of a new microRNA expression profile as a potential cancer screening tool. Clin Invest Med. 2010;33:E124. doi: 10.25011/cim.v33i2.12351. [DOI] [PubMed] [Google Scholar]
- 42.Shim JH, Su ZY, Chae JI, Kim DJ, Zhu F, Ma WY, Bode AM, Yang CS, Dong Z. Epigallocatechin gallate suppresses lung cancer cell growth through Ras-GTPase-activating protein SH3 domain-binding protein 1. Cancer Prev Res (Phila) 2010;3:670–679. doi: 10.1158/1940-6207.CAPR-09-0185. [DOI] [PubMed] [Google Scholar]
- 43.Putra AC, Eguchi H, Lee KL, Yamane Y, Gustine E, Isobe T, Nishiyama M, Hiyama K, Poellinger L, Tanimoto K. The a allele at rs13419896 of EPAS1 is associated with enhanced expression and poor prognosis for non-small cell lung cancer. PLoS One. 2015;10:e0134496. doi: 10.1371/journal.pone.0134496. [DOI] [PMC free article] [PubMed] [Google Scholar]
- 44.Tian H, McKnight SL, Russell DW. Endothelial PAS domain protein 1 (EPAS1), a transcription factor selectively expressed in endothelial cells. Genes Dev. 1997;11:72–82. doi: 10.1101/gad.11.1.72. [DOI] [PubMed] [Google Scholar]
- 45.Wu XH, Qian C, Yuan K. Correlations of hypoxia-inducible factor-1alpha/hypoxia-inducible factor-2alpha expression with angiogenesis factors expression and prognosis in non-small cell lung cancer. Chin Med J. 2011;124:11–18. [PubMed] [Google Scholar]
- 46.Giatromanolaki A, Koukourakis MI, Sivridis E, Turley H, Talks K, Pezzella F, Gatter KC, Harris AL. Relation of hypoxia inducible factor 1 alpha and 2 alpha in operable non-small cell lung cancer to angiogenic/molecular profile of tumours and survival. Br J Cancer. 2001;85:881–890. doi: 10.1054/bjoc.2001.2018. [DOI] [PMC free article] [PubMed] [Google Scholar]
- 47.Lehel C, Olah Z, Jakab G, Anderson WB. Protein kinase C epsilon is localized to the Golgi via its zinc-finger domain and modulates Golgi function. Proc Natl Acad Sci U S A. 1995;92:1406–1410. doi: 10.1073/pnas.92.5.1406. [DOI] [PMC free article] [PubMed] [Google Scholar]
- 48.Kampfer S, Windegger M, Hochholdinger F, Schwaiger W, Pestell RG, Baier G, Grunicke HH, Uberall F. Protein kinase C isoforms involved in the transcriptional activation of cyclin D1 by transforming Ha-Ras. J Biol Chem. 2001;276:42834–42842. doi: 10.1074/jbc.M102047200. [DOI] [PubMed] [Google Scholar]
- 49.Mesquita RF, Paul MA, Valmaseda A, Francois A, Jabr R, Anjum S, Marber MS, Budhram-Mahadeo V, Heads RJ. Protein kinase Cε-calcineurin cosignaling downstream of toll-like receptor 4 downregulates fibrosis and induces wound healing gene expression in cardiac myofibroblasts. Mol Cell Biol. 2014;34:574–594. doi: 10.1128/MCB.01098-13. [DOI] [PMC free article] [PubMed] [Google Scholar]
- 50.Saurin AT, Durgan J, Cameron AJ, Faisal A, Marber MS, Parker PJ. The regulated assembly of a PKCepsilon complex controls the completion of cytokinesis. Nat Cell Biol. 2008;10:891–901. doi: 10.1038/ncb1749. [DOI] [PubMed] [Google Scholar]
- 51.Wang H, Gutierrez-Uzquiza A, Garg R, Barrio-Real L, Abera MB, Lopez-Haber C, Rosemblit C, Lu H, Abba M, Kazanietz MG. Transcriptional regulation of oncogenic protein kinase C (PKC) by STAT1 and Sp1 proteins. J Biol Chem. 2014;289:19823–19838. doi: 10.1074/jbc.M114.548446. [DOI] [PMC free article] [PubMed] [Google Scholar]
- 52.Lu NZ, Cidlowski JA. Translational regulatory mechanisms generate N-terminal glucocorticoid receptor isoforms with unique transcriptional target genes. Mol Cell. 2005;18:331–342. doi: 10.1016/j.molcel.2005.03.025. [DOI] [PubMed] [Google Scholar]
- 53.De Bosscher K, Haegeman G, Elewaut D. Targeting inflammation using selective glucocorticoid receptor modulators. Curr Opin Pharmacol. 2010;10:497–504. doi: 10.1016/j.coph.2010.04.007. [DOI] [PubMed] [Google Scholar]
- 54.Lim SL, Mustapha NM, Goh YM, Bakar NA, Mohamed S. Metastasized lung cancer suppression by Morinda citrifolia (Noni) leaf compared to erlotinib via anti-inflammatory, endogenous antioxidant responses and apoptotic gene activation. Mol Cell Biochem. 2016;416:85–97. doi: 10.1007/s11010-016-2698-x. [DOI] [PubMed] [Google Scholar]
- 55.Huang GX, Pan XY, Jin YD, Wang Y, Song XL, Wang CH, Li YD, Lu J. The mechanisms and significance of up-regulation of RhoB expression by hypoxia and glucocorticoid in rat lung and A549 cells. J Cell Mol Med. 2016;20:1276–1286. doi: 10.1111/jcmm.12809. [DOI] [PMC free article] [PubMed] [Google Scholar]
- 56.Mazieres J, Tovar D, He B, Nieto-Acosta J, Marty-Detraves C, Clanet C, Pradines A, Jablons D, Favre G. Epigenetic regulation of RhoB loss of expression in lung cancer. BMC Cancer. 2007;7:220. doi: 10.1186/1471-2407-7-220. [DOI] [PMC free article] [PubMed] [Google Scholar]
- 57.Mazieres J, Antonia T, Daste G, Muro-Cacho C, Berchery D, Tillement V, Pradines A, Sebti S, Favre G. Loss of RhoB expression in human lung cancer progression. Clin Cancer Res. 2004;10:2742–2750. doi: 10.1158/1078-0432.CCR-03-0149. [DOI] [PubMed] [Google Scholar]
Associated Data
This section collects any data citations, data availability statements, or supplementary materials included in this article.
Data Availability Statement
Data collected or analyzed during this study are included in this article, and all patients signed informed consent.


