Abstract
Context:
The paradigm of evidence-based practice (EBP) is well established among the health care professions, but perspectives on the best methods for acquiring, analyzing, appraising, and using research evidence are evolving.
Background:
The EBP paradigm has shifted away from a hierarchy of research-evidence quality to recognize that multiple research methods can yield evidence to guide clinicians and patients through a decision-making process. Whereas the “frequentist” approach to data interpretation through hypothesis testing has been the dominant analytical method used by and taught to athletic training students and scholars, this approach is not optimal for integrating evidence into routine clinical practice. Moreover, the dichotomy of rejecting, or failing to reject, a null hypothesis is inconsistent with the Bayesian-like clinical decision-making process that skilled health care providers intuitively use. We propose that data derived from multiple research methods can be best interpreted by reporting a credible lower limit that represents the smallest treatment effect at a specified level of certainty, which should be judged in relation to the smallest effect considered to be clinically meaningful. Such an approach can provide a quantifiable estimate of certainty that an individual patient needs follow-up attention to prevent an adverse outcome or that a meaningful level of therapeutic benefit will be derived from a given intervention.
Conclusions:
The practice of athletic training will be influenced by the evolution of the EBP paradigm. Contemporary practice will require clinicians to expand their critical-appraisal skills to effectively integrate the results derived from clinical research into the care of individual patients. Proper interpretation of a credible lower limit value for a magnitude ratio has the potential to increase the likelihood of favorable patient outcomes, thereby advancing the practice of evidence-based athletic training.
Key Words: clinical decision making, Bayesian reasoning, evidence-based practice
Evidence-based practice (EBP) has become widely accepted as the best approach for optimizing clinical outcomes, but the prevailing interpretation of best-research evidence is now being vigorously challenged by medical researchers who have provided a compelling rationale for a broadened perspective.1–7 Athletic trainers, along with students enrolled in sport and exercise science programs, have historically received instruction in research methods that has exclusively focused on traditional null-hypothesis testing at an arbitrary level of statistical significance (eg, α = .05). This type of statistical inference is designated as a frequentist approach because it is based on the probability that repeated random sampling of a specified number of cases from a given population will produce the same hypothesis-test result.8–10 Therefore, when research is conducted to assess efficacy by comparing treatments or interventions, randomized sample selection and randomized assignment of each participant to an experimental or control condition are absolutely essential for valid interpretation of frequentist data-analysis results. However, the importance of randomization is often underappreciated or ignored.9 Furthermore, the widespread erroneous belief is that a nonsignificant P value indicates the absence of an effect and that progressively smaller P values represent greater evidence against the null hypothesis of no effect.7–15 The board of directors of the American Statistical Association recently issued a statement15 criticizing this common interpretation of statistical significance as a distortion of the scientific process, which can lead to erroneous beliefs and poor decision making.
Clearly, many leading clinicians and health care researchers are beginning to advocate for the expansion of the methods used to acquire, analyze, appraise, and apply research evidence for guiding practice decisions. The purpose of this report is to provide athletic trainers with an overview of clinical research methods that can offer a quantifiable estimate of certainty that an individual patient will derive a meaningful degree of benefit from a given preventive or therapeutic intervention.
INDIVIDUALIZED CLINICAL CARE
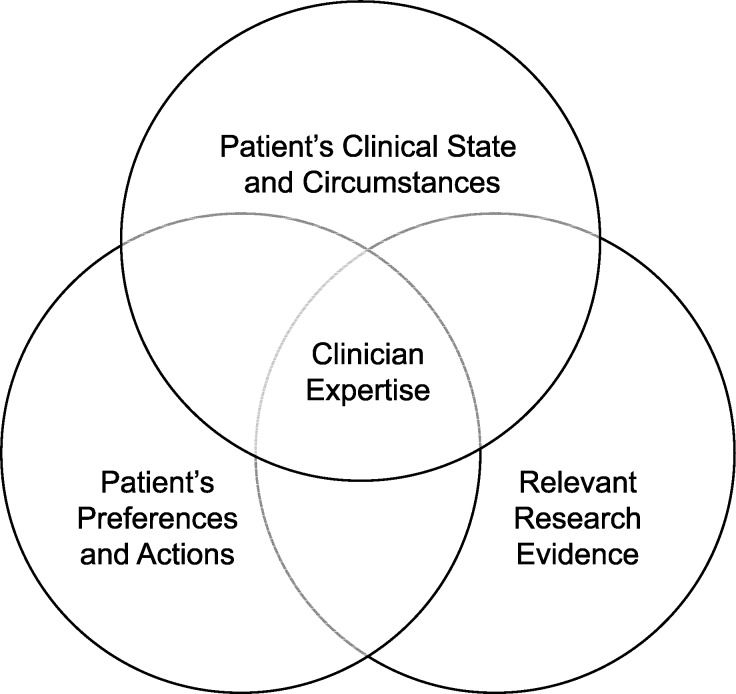
The properly conducted randomized controlled trial (RCT) is recognized as the best source of evidence for benefit when a treatment is administered under ideal and highly controlled conditions (ie, efficacy) that ensure strong internal validity. However, even when conducted optimally, an RCT does not provide a good mechanism for determining which individual patients are likely to derive benefit from a treatment delivered under normal clinical circumstances (ie, effectiveness).2,3,6 Whereas RCT results have been extensively promoted for guiding EBP, other research methods can provide evidence that is much more relevant to the process of making patient-centered clinical decisions (Figure 1).6,16 Unfortunately, many of the senior personnel who provide leadership for professional journals, grant agencies, and academic programs can have rather dogmatic expectations for using a randomized experimental design, combined with hypothesis testing and a frequentist interpretation of significant results.7–9,11–14
Figure 1. .
Circular representation of equally important and complementary sources of research evidence for guiding clinical practice, which has been proposed as an alternative to the widely recognized hierarchy of research evidence pyramid. Adapted from Walach et al16 with permission.
An alternative to estimating the objective probability of the frequency of a given hypothesis-test result is the Bayesian approach to quantifying subjective probability. The process of examination and evaluation leading to a diagnosis is an exercise in Bayesian reasoning. Gill et al17 inferred that “clinicians are natural Bayesians.” A Bayesian approach is also used consciously or subconsciously to develop and appraise the degree of belief that a clinically important treatment effect or preventive effect (ie, an association that has prognostic value) exists.7 The primary limitation of Bayesian inference is the necessity of estimating the level of probability that existed before the availability of a definitive classification of outcome status (ie, prior probability), which is related to an updated probability estimate after outcome status is known (ie, posterior probability). In the context of diagnostic testing, an estimate of prior probability is based on the history and physical examination findings known before the performance of some clinical test expected to provide new information that will better represent the probability of a specified diagnosis.18 Such integration of information is central to reducing uncertainty in clinical decision making,19 but very little information exists to guide the formulation of an accurate prior probability estimate.20–22 An often acceptable solution to this problem is an assumption of equal prior probability for all study participants, which corresponds to the proportion ultimately identified by a designated criterion-standard test as criterion-positive cases.
Some caution must be exercised in making an assumption of equal prior probability because subgroups within the population from which participants are drawn may possess characteristics that are known to modify the probability that the target condition exists (eg, sex, age, or differential exposure to a causative factor). Multivariate analysis methods provide a means of making adjustments for the effects of all variables included in a prediction model, which is essential to control for any confounding effect that would otherwise produce an invalid result. This recalibration of prior probability is consistent with Bayesian reasoning, which considers additional information an iterative step in formulating a posterior probability. The value of a positive or negative clinical test result can then be represented by the magnitude of prior-to-posterior change in the odds of having criterion-positive status (ie, confirmed criterion-standard diagnosis as positive). In the context of prognosis (ie, prediction), criterion-positive outcome status corresponds to the documented occurrence of a specified event (ie, injury) within a defined period of surveillance.23
The assessment of treatment effect can be approached through a similar process. The goal of treatment is to change, for the better, the outcome of care. One's belief that a treatment will achieve this goal is influenced by what is known about an outcome without the intervention (ie, placebo control) or from the known outcome of a current standard-of-practice procedure (ie, active comparator). These outcomes data may emerge from a variety of prospective or retrospective research methods (eg, cohort and case-control studies). Magnitude-based inference is a term used to designate a pragmatic combination of frequentist concepts and Bayesian reasoning,7,11,12 which characterizes the approach that is widely used in the field of epidemiology. Estimating the likely size of an effect is arguably the most important goal of a statistical analysis.7 Hypothesis testing can only confirm or refute the existence of an effect and does not provide any information about the likely magnitude of a true effect. Increasingly, the confidence interval (CI) is viewed as a better representation of a study's findings than a hypothesis-test result or an exact P value.11–13
ESTIMATION OF CERTAINTY FOR A SPECIFIED OUTCOME
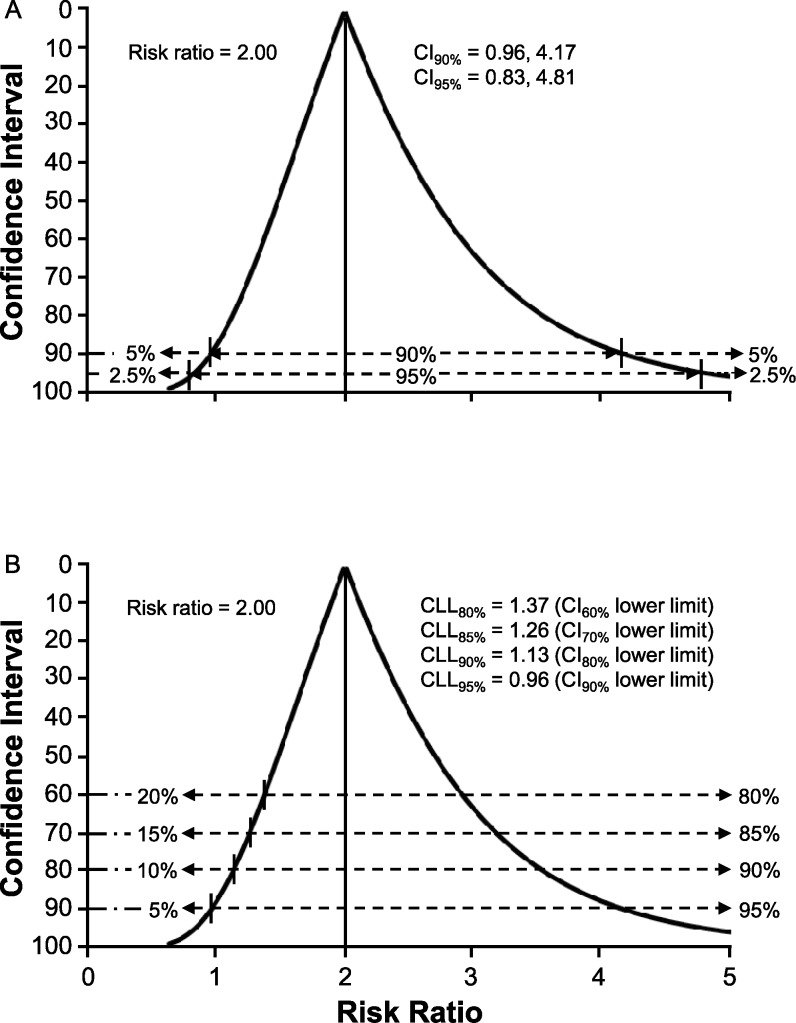
Including a 95% CI in published research reports has become increasingly common in recent years,5 but the information provided tends to be viewed as an alternate means of assessing 2-tailed statistical significance using α = .05 (ie, 2.5% of values below the CI lower limit and 2.5% of values above the CI upper limit).13 A 90% CI has been recommended to discourage a perceived connection to hypothesis testing, and the term credibility interval has been suggested as an alternative designation that emphasizes a Bayesian interpretation of the range of values as that which includes the true effect magnitude with some level of certainty.7,13 A CI function depicts all possible CIs around a point estimate of effect magnitude, which does not require specifying a single probability level for assessing the magnitude and precision of an effect that may be deemed clinically important.24 For example, the risk ratio (RR) represents a point estimate of the magnitude of difference in the proportion of injury cases predicted to occur in a high-risk subgroup versus that predicted for a low-risk subgroup within a specified period. The RR point estimate is based on actual injury events that have been observed in a cohort study, but the precision of prediction accuracy for a similar cohort is best judged by a CI function (Figure 2A).
Figure 2. .
Confidence interval (CI) function for the risk ratio in a cohort of 40 individuals equally distributed between high-risk and low-risk classifications, 37.5% criterion-positive outcome, and diagnostic/prognostic test sensitivity of 67% and specificity of 60%. A, Two-sided probabilities for values outside the lower limits and upper limits of 90% CI and 95% CI. B, Credible lower limit (CLL) values and 1-sided probabilities for risk ratio values below the lower limit for CI levels of 60%, 70%, 80%, and 90%.
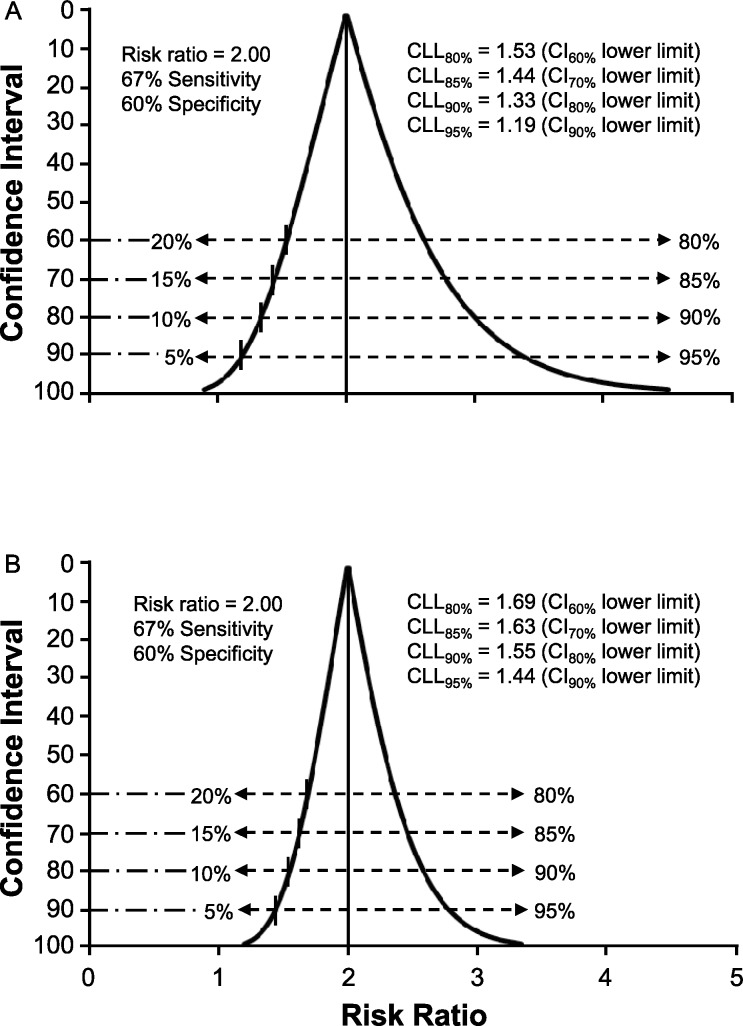
Whereas hypothesis testing is discouraged for expressing the importance of a test result, the lower limit of a 90% CI provides the equivalent of a 1-sided focus on the minimal probable size of the true effect (ie, 5% of values below the CI lower limit).11,12 A 1-sided assessment of an effect size represented by a ratio measure provides an indicator of certainty that its true value exceeds 1.0 (ie, any value >1.0 can be viewed as a clinically important effect).8,9 Given that calculating CI limits for a ratio measure involves natural log transformation, the CI function for a relatively small cohort is positively skewed (ie, the upper limit is farther from the point estimate than the lower limit). To facilitate the interpretation of uncertainty about the size of an effect, we propose using the term credible lower limit (CLL) as a designation for the smallest effect that corresponds to a selected level of probability, thus serving as a representation of the uncertainty tolerance deemed acceptable by the clinician. For example, CLL95% would be the value corresponding to the lower limit of a 90% CI (ie, 95% certainty that the true effect size equals or exceeds CLL95%). If 90% certainty about the smallest effect magnitude is deemed adequate for a given clinical decision, the value of CLL90% would correspond to the lower limit of an 80% CI (Figure 2B). The CI function becomes narrower and more symmetrical as cohort size increases, which reflects less uncertainty about the true effect magnitude (Figure 3A and B). Therefore, the combination of the RR point estimate of effect magnitude with the CLL quantification of the smallest likely effect for any similar cohort provides a clinician with the essential information needed to judge the potential risk versus potential benefit of a specific course of action or inaction.
Figure 3. .
Confidence interval function for risk ratio with a focus on the proximity of the credible lower limit (CLL) values to the null value of 1.0 (ie, no association). A, Influence of an increase in cohort size to 80 individuals on the precision of estimates. B, Influence of an increase in cohort size to 200 individuals on the precision of estimates.
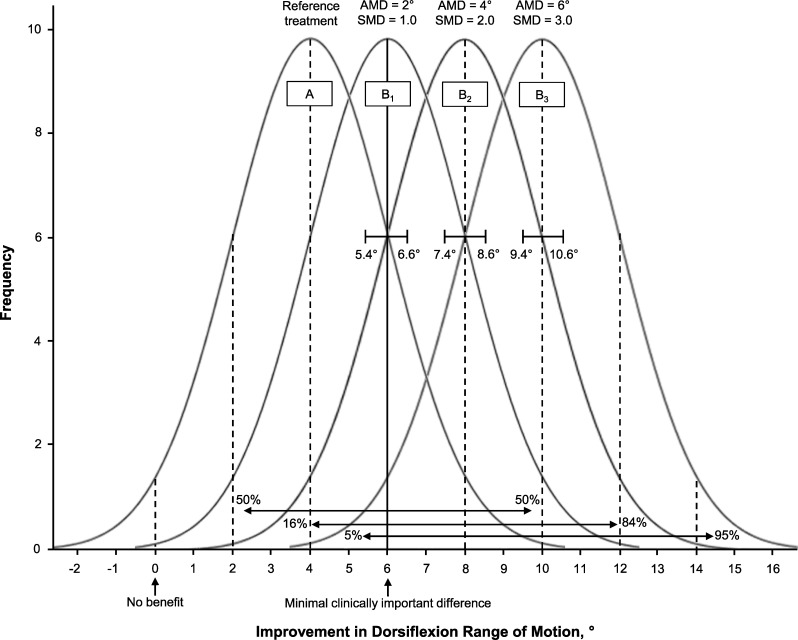
The critical factor limiting the advancement of EBP is clearly a lack of sufficient information to estimate uncertainty about the likely outcome an individual patient will experience from a clinical choice.19 The importance of an accurate diagnostic classification of a patient's status is obvious, but many clinicians do not recognize that sensitivity and specificity cannot be properly interpreted separately.18,25,26 Furthermore, prediction accuracy is best estimated by likelihood ratios, which incorporate both the sensitivity and specificity for a given diagnostic or prognostic classification.18 Patient-centered outcomes, such as return-to-sport participation, return to work, or a global rating of change (ie, the patient's perception of a much improved condition), can be defined as indicators of successful versus unsuccessful treatment. The likelihood of achieving the desired outcome can be derived in the same manner as estimates of the diagnostic utility of a physical examination procedure. The definition of success is often absent from studies of treatment effects that are quantified on continuous scales. For example, an investigator may report improved restoration of postinjury ankle-dorsiflexion range of motion through a new treatment approach. A narrow CI may suggest that the new treatment leads to greater motion restoration than an alternative approach that has been widely used in the past. What is missing is whether the new treatment, or the comparison treatment, yields a level of benefit that is detectable by the patient (Figure 4). A minimal clinically important difference (MCID) refers to the smallest change that patients perceive as beneficial, which should influence clinical decision making about injury care. Despite very narrow CIs for the absolute mean difference between treatments A and B (identified by brackets in Figure 4), as well as very large standardized mean difference values for each of the 3 scenarios, some patients will not achieve the MCID. Defining satisfactory outcomes from the perspective of patients is often lacking in clinical research. A broader and Bayesian-influenced perspective will yield new insights into treatment effectiveness and advance the practice of evidence-based care.
Figure 4. .
Example illustrating the uncertainty that a beneficial group-mean effect will provide benefit to an individual patient. Assuming ≥6° of improvement represents a minimal clinically important difference (MCID), pooled standard deviation = 2.0, and n = 50, the 95% confidence interval is defined by  . Despite very narrow confidence intervals for the absolute mean difference (AMD) between treatments A and B (identified by brackets), as well as very large standardized mean difference (SMD) values for each of 3 scenarios, some patients will not achieve the MCID. The potential for a given patient to derive meaningful benefit is possible for scenario B1 (50% ≥ MCID), probable for scenario B2 (84% ≥ MCID), and highly probable for scenario B3 (95% ≥ MCID). Adapted with permission from the National Athletic Trainers' Association from Denegar CR, Wilkerson GB. Evidence-based practice and uncertainty about patient outcomes. NATA News. 2017;April:20–22.
The term effect is widely used to refer to a quantifiable relationship between variables, which provides the basis for a judgment about the clinical utility of a procedure. When the variables are continuous, effect size may be represented as the difference between group means in standard deviation units (ie, standardized mean difference) or the proportion of explainable variance (ie, r2 for bivariate correlation and η2 for group difference). In the context of diagnosis and prognosis, effect relates to the strength of association between a binary classification (ie, positive versus negative prediction) and a binary outcome (ie, occurrence versus nonoccurrence) that is represented by a ratio.
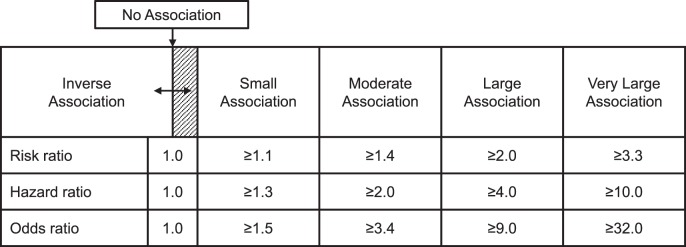
The term clinical epidemiology has been defined as the science of making predictions about individual patients by counting clinical events in groups of similar patients and using strong scientific methods to ensure that the predictions are accurate.23 Authors of prospective cohort studies designed to assess risk for injury occurrence often report the RR as a point estimate effect magnitude (ie, RR = injured proportion of index group/injured proportion of comparison group), but the most widely used numeric value for representing observed effect magnitude is the odds ratio (OR). An OR compares the odds for criterion-positive status, which may be some outcome other than injury, between 2 subgroups (ie, OR = index group odds/comparison group odds). The hazard ratio, which is derived from a time-to-event analysis, represents the magnitude of difference in instantaneous risk for event occurrence between 2 subgroups. A judgment about the clinical utility of a given hazard ratio, RR, or OR point estimate requires consideration of its uncertainty in relation to the smallest credible value deemed clinically important (eg, CLL) for an association between prediction and outcome (Figure 5).27,28
Figure 5. .
Recommended standards for interpreting point estimates and credible lower limits for ratio measures of association between prediction and outcome.27,28
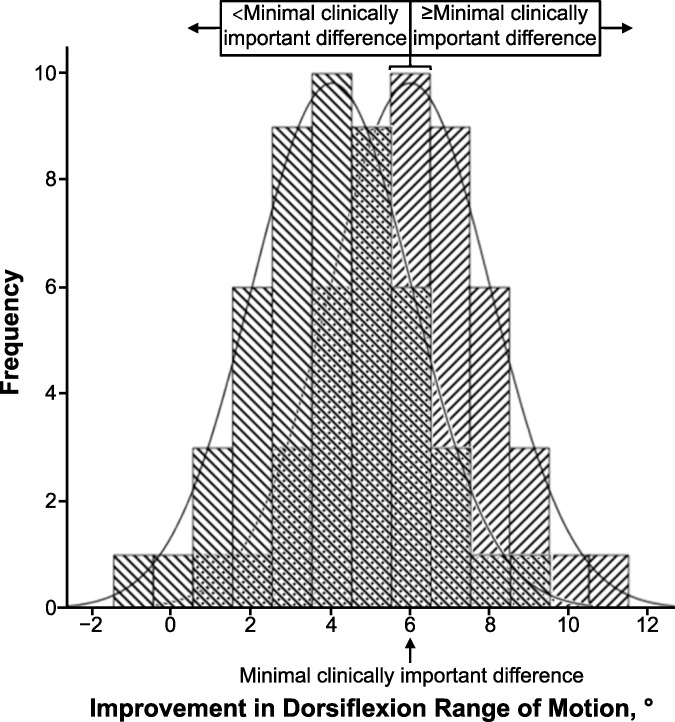
Whereas comparative-effectiveness studies typically involve measuring a continuous dependent variable (eg, the example presented in Figure 4), a binary classification of each patient case within the respective groups can be based on a cut point corresponding to the MCID. Such an approach can be used to calculate the OR for the association between group membership and the binary outcome, as well as a CLL for the therapeutic effect. The process of converting degrees of ankle-dorsiflexion improvement to a binary classification illustrates a key distinction between frequentist and Bayesian approaches (Figure 6). Frequentist statistical inference relies on a theoretical probability that is derived from the proportion of continuous dependent variable values expected to be found within a specified area beneath a normal curve (ie, parametric statistical analysis), whereas Bayesian reasoning is based on discrete counts of observations that are assigned to binary prediction and outcome categories (ie, nonparametric statistical analysis).
Figure 6. .
Overlapping distributions corresponding to those depicted for treatment A and treatment B1 in Figure 4. Each histogram bar represents the number of cases observed to achieve a given amount of ankle-dorsiflexion improvement. The probability for a patient to achieve or exceed minimal clinically important difference (ie, 6° of improvement) corresponds to the proportion of such cases within a group (ie, 11/50 = 0.22 for treatment A and 30/50 = 0.60 for treatment B1).
The overlapping distributions depicted in Figure 6 correspond to those for treatment A and treatment B1 in Figure 4. Note that each histogram bar represents the number of cases observed to achieve a given amount of ankle-dorsiflexion improvement and that the width of each bar extends 0.5° above and below a given value. The probability (P) for a patient to achieve or exceed the MCID (ie, 6° of improvement) corresponds with the proportion of such cases within a group (ie, 11/50 = 0.22 for treatment A and 30/50 = 0.60 for treatment B1). Odds are calculated as P/1 – P (ie, 0.22/0.78 = 0.28 for treatment A and 0.60/0.40 = 1.50 for treatment B1), and the OR represents the relative magnitude of difference in odds between the groups (ie, OR = 1.50/0.28 = 5.32). In the example provided, the odds of achieving or exceeding the MCID are 5.32 times greater for a patient who receives treatment B1 than for a patient who receives treatment A. A 95% level of certainty about the smallest comparative effect magnitude would correspond to the lower limit of a 90% CI for the OR point estimate (ie, CLL95% = 2.55). From a clinical perspective, these results indicate that the odds of achieving the desired clinical benefit are at least 2.55 times greater with the investigated treatment than the reference treatment. This information can be used by the patient and provider to select a plan of care based on the likelihood of benefit, known risks, personal preferences, and costs in a manner that truly reflects both an evidence-based and patient-centered approach to clinical practice.
CLINICIAN EXPERTISE
Whereas the frequentist approach to interpreting RCT results is still widely viewed as the best source of guidance for EBP, a more advanced model for evidence-based decision making emphasizes the importance of the clinician's consideration of the individual patient's clinical state and circumstances in making clinical decisions (Figure 7).29 In fact, clinical epidemiology and evidence-based medicine have been referred to as synonymous terms.29,30 Despite the necessity of making decisions on the basis of imperfect data and limited knowledge, the culture of medicine has historically led physicians to suppress and ignore uncertainty.4 In the same manner that null-hypothesis testing can obscure the existence of a clinically important effect,31 transforming a patient's complex clinical presentation into a black-and-white diagnosis can present a major obstacle to delivering patient-centered care. Conversely, critical-thinking skills allow for uncertainty, which can counteract hidden assumptions and unconscious biases that might otherwise lead to adverse patient outcomes.
Figure 7. .
Updated model of evidence-based practice that emphasizes the individual patient's unique presentation as a key consideration, with the clinician's expertise represented as the ability to effectively integrate the 3 components. Adapted from Evidence-Based Medicine, Clinical expertise in the era of evidence-based medicine and patient choice. Haynes RB, Devereaux PJ, Guyatt GH, 7(2):36-38, 2002, with permission from BMJ Publishing Group Ltd.
CONCLUSIONS
Scholars in the athletic training profession should recognize the potential that clinical epidemiology offers for dramatically enhancing the quality of health care service, as well as the need to adopt a broad view of EBP that includes a Bayesian interpretation of research findings derived from a variety of study designs.
REFERENCES
- 1. Etheredge LM. . Rapid learning: a breakthrough agenda. Health Aff (Millwood). 2014; 33 7: 1155– 1162. [DOI] [PubMed] [Google Scholar]
- 2. Luce BR, Kramer JM, Goodman SN, et al. Rethinking randomized clinical trials for comparative effectiveness research: the need for transformational change. Ann Intern Med. 2009; 151 3: 206– 209. [DOI] [PubMed] [Google Scholar]
- 3. Schattner A, Fletcher RH. . Research evidence and the individual patient. Q J Med. 2003; 96 1: 1– 5. [DOI] [PubMed] [Google Scholar]
- 4. Simpkin AL, Schwartzstein RM. . Tolerating uncertainty: the next medical revolution? N Engl J Med. 2016; 375 18: 1713– 1715. [DOI] [PubMed] [Google Scholar]
- 5. Stang A, Deckert M, Poole C, Rothman KJ. . Statistical inference in abstracts of major medical and epidemiology journals 1975−2014: a systematic review. Eur J Epidemiol. 2017; 32 1: 21– 29. [DOI] [PubMed] [Google Scholar]
- 6. Tugwell P, Knottnerus JA. . Is the “evidence-pyramid” now dead? J Clin Epidemiol. 2015; 68 11: 1247– 1250. [DOI] [PubMed] [Google Scholar]
- 7. Wilkinson M. . Distinguishing between statistical significance and practical/clinical meaningfulness using statistical inference. Sports Med. 2014; 44 3: 295– 301. [DOI] [PubMed] [Google Scholar]
- 8. Greenland S, Poole C. . Living with P values: resurrecting a Bayesian perspective on frequentist statistics. Epidemiology. 2013; 24 1: 62– 68. [DOI] [PubMed] [Google Scholar]
- 9. Greenland S, Senn SJ, Rothman KJ, et al. Statistical tests, P values, confidence intervals, and power: a guide to misinterpretations. Eur J Epidemiol. 2016; 31 4: 337– 350. [DOI] [PMC free article] [PubMed] [Google Scholar]
- 10. Freedman L. . Bayesian statistical methods. BMJ. 1996; 313 7057: 569– 570. [DOI] [PMC free article] [PubMed] [Google Scholar]
- 11. Batterham AM, Hopkins WG. . Making meaningful inferences about magnitudes. Int J Sports Physiol Perform. 2006; 1 1: 50– 57. [PubMed] [Google Scholar]
- 12. Hopkins W, Marshall S, Batterham A, Hanin J. . Progressive statistics for studies in sports medicine and exercise science. Med Sci Sports Exerc. 2009; 41 1: 3– 13. [DOI] [PubMed] [Google Scholar]
- 13. Sterne JA, Smith GD. . Sifting the evidence: what's wrong with significance tests? Phys Ther. 2001; 81 8: 1464– 1469. [DOI] [PubMed] [Google Scholar]
- 14. Stovitz SD, Verhagen E, Shrier I. . Misinterpretations of the “P value”: a brief primer for academic sports medicine. Br J Sports Med. 2017; 51 16: 1176– 1177. [DOI] [PubMed] [Google Scholar]
- 15. Wasserstein RL, Lazar NA. . The ASA's statement on P-values: context, process, and purpose. Am Stat. 2016; 70 2: 129– 133. [Google Scholar]
- 16. Walach H, Falkenberg T, Fonnebo V, Lewith G, Jonas WB. . Circular instead of hierarchical: methodological principles for the evaluation of complex interventions. BMC Med Res Methodol. 2006; 6: 29. [DOI] [PMC free article] [PubMed] [Google Scholar]
- 17. Gill CJ, Sabin L, Schmid CH. . Why clinicians are natural Bayesians. BMJ. 2005; 330 7499: 1080– 1083. [DOI] [PMC free article] [PubMed] [Google Scholar]
- 18. Bianchi MT, Alexander BM, Cash SS. . Incorporating uncertainty into medical decision making: an approach to unexpected test results. Med Decis Making. 2009; 29 1: 116– 124. [DOI] [PubMed] [Google Scholar]
- 19. Ashby D, Smith AF. . Evidence-based medicine as Bayesian decision-making. Stat Med. 2000; 19 23: 3291– 3305. [DOI] [PubMed] [Google Scholar]
- 20. Attia JR, Nair BR, Sibbritt DW, et al. Generating pre-test probabilities: a neglected area in clinical decision making. Med J Aust. 2004; 180 9: 449– 454. [DOI] [PubMed] [Google Scholar]
- 21. Phelps MA, Levitt MA. . Pretest probability estimates: a pitfall to the clinical utility of evidence-based medicine? Acad Emerg Med. 2004; 11 6: 692– 694. [PubMed] [Google Scholar]
- 22. Srinivasan P, Westover MB, Bianchi MT. . Propagation of uncertainty in Bayesian diagnostic test interpretation. South Med J. 2012; 105 9: 452– 459. [DOI] [PMC free article] [PubMed] [Google Scholar]
- 23. Fletcher RW, Fletcher SW. . Clinical Epidemiology: The Essentials. 4th ed. Philadelphia, PA: Lippincott Williams & Wilkins; 2005: 3, 45. [Google Scholar]
- 24. Sullivan KM, Foster DA. . Use of the confidence interval function. Epidemiology. 1990; 1 1: 39– 42. [DOI] [PubMed] [Google Scholar]
- 25. Bianchi MT, Alexander BM. . Evidence based diagnosis: does the language reflect the theory? BMJ. 2006; 333 7565: 442– 445. [DOI] [PMC free article] [PubMed] [Google Scholar]
- 26. Pewsner D, Battaglia M, Minder C, Marx A, Bucher HC, Egger M. . Ruling a diagnosis in or out with “SpPIn” and “SnNOut”: a note of caution. BMJ. 2004; 329 7459: 209– 213. [DOI] [PMC free article] [PubMed] [Google Scholar]
- 27. Hopkins WG. . Linear models and effect magnitudes for research, clinical and practical applications. Sportscience. 2010; 14 1: 49– 58. [Google Scholar]
- 28. Hopkins WG. . Statistics used in observational studies. : Verhagen E, van Mechelen W, . Sports Injury Research. New York, NY: Oxford University Press; 2010: 69– 81. [Google Scholar]
- 29. Haynes RB, Devereaux PJ, Guyatt GH. . Clinical expertise in the era of evidence-based medicine and patient choice. Evid Based Med. 2002; 7 2: 36– 38. [PubMed] [Google Scholar]
- 30. Haynes RB, Sackett DL, Guyatt GH, Tugwell P. . Clinical Epidemiology: How to Do Clinical Practice Research. 3rd ed. Philadelphia, PA: Lippincott Williams & Wilkins; 2006: ix– x. [Google Scholar]
- 31. Wilkerson GB, Denegar CR. . Cohort study design: an underutilized approach for advancement of evidence-based and patient-centered practice in athletic training. J Athl Train. 2014; 49 4: 561– 567. [DOI] [PMC free article] [PubMed] [Google Scholar]


