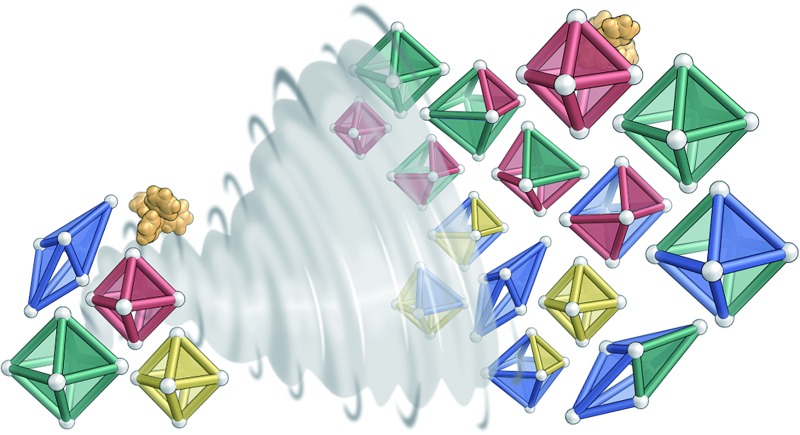
 Molecules often mix in unexpected ways – we present a new method of calculating product distributions in complex sorting systems.
Abstract
The molecular components of biological systems self-sort in different ways to function cooperatively and to avoid interfering with each other. Understanding the driving forces behind these different sorting modes enables progressively more complex self-assembling synthetic systems to be designed. Here we show that subtle ligand differences engender distinct M6L4 cage geometries – an S4-symmetric scalenohedron, or pseudo-octahedra having T point symmetry. When two different ligands were simultaneously employed during self-assembly, a mixture of homo- and heteroleptic cages was generated. Each set of product structures represents a unique sorting regime: biases toward specific geometries, preferential incorporation of one ligand over another, and the amplification of homoleptic products were all observed. The ligands' geometries, electronic properties, and flexibility were found to influence the sorting regime adopted, together with templation effects. A new method of using mass spectrometry to quantitatively analyse mixtures of self-sorted assemblies was developed to assess individual outcomes. Product distributions in complex, dynamic mixtures were thus quantified by non-chromatographic methods.
Introduction
The self-assembly of multiple components can result in the clean formation of structurally complex single products,1 as each building block is guided to a specific location during thermodynamic equilibration. In seeking to understand why certain combinations of components come together to form discrete entities,2 while others do not, rules of geometrical and electronic compatibility are often uncovered.3 Serendipitous outcomes frequently serve to elucidate new rules of self-assembly,4 in turn allowing for the design of increasingly complex materials.5 In the cases of new three-dimensional metal–organic architectures, higher structural complexity can enable new functions to be developed.6
In many cases, however, mixtures of precursors produce multiple self-assembled products.7 Deciphering the self-assembly rules within such systems involves new characterisation challenges: interconverting, low-symmetry and paramagnetic products are difficult to detect by NMR, labile species can re-equilibrate after chromatographic separation, and mass spectrometry data can be difficult to quantify.8 Overcoming these problems can allow the speciation of components within complex mixtures to be gauged, enabling system-wide functional behaviours to be designed.9
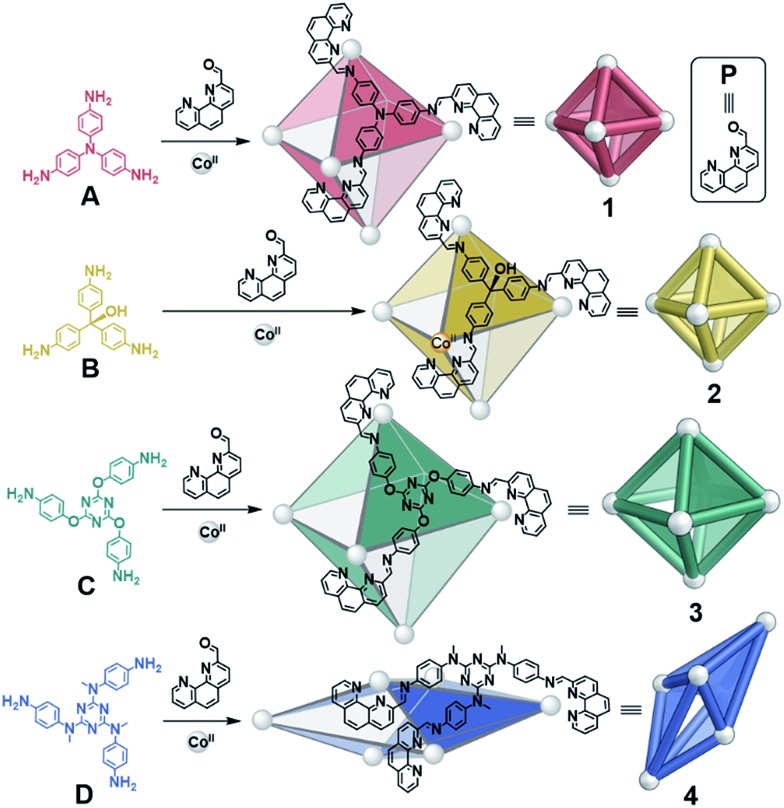
Here we explore the use of a peripherally-binding template together with the geometry, electronic properties, and flexibility of ligands to influence the assembly of CoII6L4 structures (Fig. 1) within mixtures. Unique regimes of self-sorting,10 where ligands combined to generate both homoleptic and heteroleptic structures in biased systems, were observed to result when combinations of triamines A–D were employed with 2-formyl-1,10-phenanthroline P and cobalt(ii) trifluoromethanesulfonate (triflate, OTf–) during assembly. The introduction of a peripherally-binding tetraphenylborate template was observed to impact the distribution of these sorted species. In one case, the amplification of homoleptic cages was promoted by employing this template, which binds to stabilise the apertures of cages formed from smaller ligands, while not interacting with apertures formed by larger ligands. Peripheral-template influence over the distribution of specific cage products within dynamic mixtures was thus demonstrated.
Fig. 1. Syntheses of CoII6L4 octahedra 1–3 from A–C and scalenohedron 4 from D, following reaction with 2-formyl-1,10-phenanthroline P and CoII(OTf)2 at 70 °C over 16 h in CH3CN.
A new S4-symmetric scalenohedral structure type, 4, was observed to form when triamine D was employed during assembly (Fig. 1, bottom). The formation of this unique M6IIL4 diastereomer contrasted with the T-symmetric pseudo-octahedra observed from triamines A–C. The subsequent use of triamine D in sorting experiments yielded outputs that were quantitatively biased, driven by the formation of scalenohedral 4. Narcissistic sorting, whereby homoleptic structures are formed selectively, could be promoted by employing incompatible ligands together.
Experimental section
Unless otherwise specified, reagents were purchased from commercial sources and used as received. 2-Formyl-1,10-phenanthroline,11 subcomponent D,12 Co(OTf)2,13 and Co(NTf2)2·6H2O,13 were prepared by literature procedures.
Syntheses of 1–3
Triamine A–C (4.80 μmol, 4 equiv.), 2-formylphenanthroline (14.4 μmol, 12 equiv.) and either Co(OTf)2 or Co(NTf2)2·6H2O (7.20 μmol, 6 equiv.) were combined in CD3CN (0.5 mL) in a sealed NMR tube and heated at 70 °C overnight. Spectra were collected after cooling to room temperature. Solid samples could be isolated by evaporation of the solvent, trituration with Et2O and drying under a N2 stream.
1
1H NMR (400 MHz, 298 K, CD3CN): δ 279.2, 216.5, 124.9, 114.3, 113.7, 50.9, 34.4, 15.1, –16.2 ppm. ESI-MS [charge fragment, calculated for 1(OTf)12]: m/z = 1247.3 [1(OTf)84+, 1247.5], 968.1 [1(OTf)75+, 968.2], 781.9 [1(OTf)66+, 782.0], 648.9 [1(OTf)57+, 649.0], 549.1 [1(OTf)48+, 549.2]. Crystals were grown by the slow diffusion of diisopropyl ether into a CD3CN solution of 1 containing excess nBuNBF4 (CCDC ; 1568164 †).
2
1H NMR (400 MHz, 298 K, CD3CN): δ 215.5, 146.0, 87.5, 42.2, 32.8, 30.4, 25.4, 4.2, 2.8, –6.5, –34.4 ppm. ESI-MS [charge fragment, calculated for 2(NTf2)12]: m/z = 1163.7 [2(NTf2)75+, 1163.7], 922.9 [2(NTf2)66+, 923.1], 751.0 [2(NTf2)57+, 751.2], 622.1 [2(NTf2)48+, 622.3].
3
1H NMR (400 MHz, 298 K, CD3CN): δ 264.7, 200.5, 113.4, 49.6, 35.9, 30.2, 18.7, –0.6, –13.9 ppm. ESI-MS [charge fragment, calculated for 3(OTf)12]: m/z = 1057.3 [3(OTf)75+, 1057.8], 856.4 [3(OTf)66+, 856.7], 712.8 [3(OTf)57+, 713.0], 605.1 [3(OTf)48+, 605.2].
Synthesis of 4
Triamine D (1.41 mg, 3.20 × 10⁻⁶ mol, 4 equiv.), 2-formylphenanthroline (2.00 mg, 9.61 × 10⁻⁶ mol, 12 equiv.) and Co(OTf)2 (1.71 mg, 7.20 × 10⁻⁶ mol, 6 equiv.) were combined in CD3CN in a sealed NMR tube and heated at 70 °C overnight. Upon cooling, Et2O (10 mL) was added and the solution cooled in a fridge for 24 h. The suspension was centrifuged, the supernatant decanted and the solid dried in vacuo to yield 4 as an orange powder. 1H NMR (400 MHz, 298 K, CD3CN): δ 265.1, 200.0, 186.3, 166.0, 118.6, 112.1, 91.0, 65.1, 59.6, 49.4, 39.8, 37.3, 36.1, 35.9, 33.7, 30.6, 27.8, 27.6, 25.8, 18.7, 18.1, 17.0, 12.0, 7.6, 7.3, 5.5, 4.5, –0.4, –1.5, –9.2, –11.1, –37.8, –60.5 ppm. 19F NMR (376 MHz, 298 K, CD3CN): δ –78.1 (OTf– in fast exchange with the cavity) ppm. ESI-MS [charge fragment, calculated for 4(OTf)12]: m/z = 1398.5 [4(OTf)84+, 1398.7], 1089.0 [4(OTf)75+, 1089.1], 882.7 [4(OTf)66+, 882.8], 735.4 [4(OTf)57+, 735.4]. Crystals were grown by the slow diffusion of diisopropyl ether into a CD3CN solution of 4 containing CsCB11H12 (ca. 12 equiv.) (CCDC ; 1568165 †).
Quantification by ESI-MS
Stock solutions of 1–4 (0.89 mM) were prepared as described above. To compare the ratio of heteroleptic to homoleptic species and the degree of ligand incorporation into heteroleptic species, ‘fresh’ solutions of two cages were compared against the corresponding ‘equilibrated’ solutions of the same two cages. To generate the ‘fresh mixtures’, equal volumes of two stock solutions of cage were combined and spectra collected within 1 minute. To generate the ‘equilibrated mixtures’, two different cage solutions (0.1 mL of each) were combined and heated at 70 °C overnight, generating a distribution of cages. ESI mass spectra of both the fresh and equilibrated mixture were collected on a Micromass Quattro LC mass spectrometer (30 collections scans, cone voltage 22 eV, desolvation temp. 313 K, ionisation temp. 313 K). The integrals obtained for signals corresponding to the +4, +5 and +6 charge states of the equilibrated mixtures were divided by the corresponding integrals obtained for the fresh mixture (following baseline correction and normalisation). This procedure provided the percentage of homoleptic species remaining, and thus the percentages of heteroleptic species generated, after equilibration. The amount of a specific ligand incorporated into the heteroleptic species was likewise quantified as the percentage decrease of the homoleptic species in the equilibrated mixture, as compared to that in the fresh mixture. A full discussion with equations and procedures is provided in the ESI Section 6.†
Results and discussion
A tale of two structures: octahedra vs. scalenohedra
We recently reported the syntheses of a series of supramolecular M6IIL4 pseudo-octahedra, formed from the subcomponent self-assembly of triamines with P and either CdII or ZnII.14 The use of cations with full d-electron valence shells, however, only resulted in clean product formation when small triamines were used; discrete species were not observed when larger triamine subcomponents were employed. We thus turned our attention to CoII, which displays slower exchange kinetics and a flexible coordination sphere, and has proven useful in stabilising larger and more flexible architectures.13,15 These features allowed us to successfully prepare a larger CoII6L4 pseudo-octahedron (3) and a new scalenohedron structure type (4), as well as enabling the rich self-sorting behaviour detailed below.
The reactions of P (12 equiv.), CoII salts (6 equiv.) and triamines A–D (4 equiv.) were observed to result in the formation of CoII6L4 assemblies 1–4 by ESI-MS, after heating at 70 °C for 16 h (Fig. 1). The 1H NMR spectra of 1–3 indicated the formation of high-symmetry species with maintenance of the threefold symmetry of the ligand, reflecting the overall T symmetry of the complexes (Fig. S1, S4 and S7†). The 1H NMR spectrum of 4, in contrast, was more complex (Fig. S10†). Three times the number of signals attributable to a purely T-symmetric cage were observed. ESI-MS indicated the exclusive presence of a CoII6L4 species; no other metal:ligand stoichiometry could be identified by low or high resolution ESI-MS (Fig. S12 and S13†). Travelling wave ion mobility mass spectrometry (IM-MS) indicated that 4 corresponded to a single species with a single drift time for each charge state (Fig. S14†).16
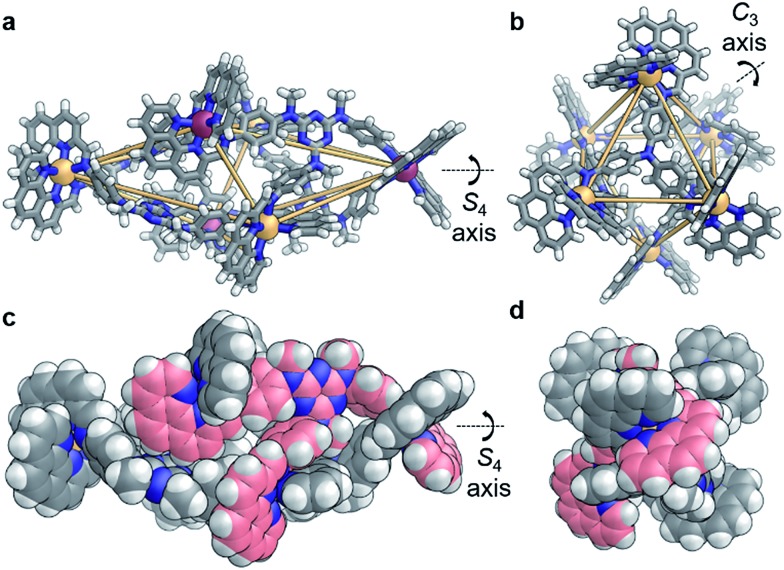
X-ray diffraction studies on a single crystal grown from the slow diffusion of iPr2O into a solution of 4 in CD3CN revealed a structure wherein each of the faces of the polyhedron corresponds to a scalene triangle (Fig. 2). This geometry forces alternating metal corners around the equatorial belt of the structure out of plane with one another, generating a scalenohedral arrangement of metal centres. The complex has S4 point symmetry, with the rotoinversion axis running through the apices of the two fused pyramids. This geometry contrasts with the T symmetry found for 1 in the crystal (Fig. 2b).
Fig. 2. X-ray crystal structures of (a) 4 and (b) 1 (ΔCoII – orange, Λ CoII – purple, N – blue, C – gray, H – white); orange lines indicate closest metal–metal separations, to illustrate geometry. (c, d) Two space-filling representations of 4, rotated 90° with respect to each other, where the carbon atoms of one ligand are colored pink.
The crystal structure of 4 also contains a central triflate anion; the corresponding 19F NMR spectrum indicated fast-exchange binding of triflate on the NMR timescale (Fig. S11†). No other CoII salt was observed to generate a discrete self-assembled species with D and P, suggesting that OTf– templated the formation of 4. Examination of the crystal structure further indicates that the configuration is reinforced by edge-to-face aromatic interactions between the triazine rings of the ligand and adjacent phenanthroline moieties. In contrast to homologous C, the core of D is more electron rich; we hypothesise that the increased electron density of D promotes edge-to-face aromatic interactions in 4, whereas the less electron-rich C forms 3 in order to alleviate strain around the coordination environments of the CoII centers. The result is a substantial contraction of the void of 4, as compared to 3. A void volume of 98 Å3 was estimated for 4, whereas the flexibility engendered by the ether linkages in 3 led to a cavity volume of approximately 1450 Å3 for 3 (Fig. S15†).
Distinct sorting regimes during self-assembly
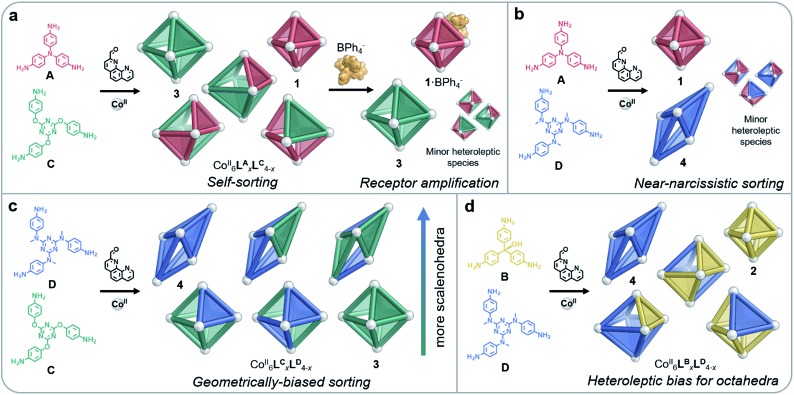
Depending on their size, shape and flexibility, mixtures containing two different subcomponents were observed to self-sort into CoII6LyxLz4–x architectures (where Ly and Lz represent ligands incorporating subcomponents y and z, respectively) in four distinct ways, as shown in Fig. 3. When more than one type of ligand is employed in a self-assembly process, systems usually organise in one of three ways: social self-sorting, where ligands combine to form heteroleptic complexes preferentially; narcissistic self-sorting, wherein components segregate in order to form homoleptic complexes exclusively; or integrative self-sorting, where all components combine to form a single species.7c,10
Fig. 3. Distinct behaviours were observed during self-assembly involving pairs of amines (A–D). (a) All homo- and heteroleptic species were observed to form from A and C; homoleptic cages were amplified following the addition of peripherally-binding BPh4–; the same behaviour was observed in the case of B and C. (b) Near-narcissistic sorting was observed for A and D. (c) A bias towards the formation of scalenohedra with a greater proportion of D was observed for mixtures of C and D. (d) Heteroleptic species formed by B and D were exclusively octahedral in shape.
Ligand geometries did not have to match closely in order for both homo- and heteroleptic species to be observed upon sorting: mixtures of either A and C, or B and C, resulted in combinations of all possible products (Fig. 3a). MM3 molecular models of the CoII6LBxLC4–x complexes indicated that these heteroleptic structures did not suffer from significant distortions of the ligands or the coordination environments of the CoII ions (Fig. S31†). The flexibility of the ether linkages in C appears to enable this geometrical diversity, allowing different conformations to be adapted in order to accommodate the differently-sized subcomponents.
Templation, wherein a guest acts to help organise a structure, is a powerful tool in redistributing mixtures of self-assembling structures and optimising single entities,17 by taking advantage of favourable intermolecular interactions.18 Modulating the binding strength of the templating guest can reorganise product mixtures to express specific products.19 A template can also generate a set of well-defined structures, instead of a single product.20
As tetraphenylborate (BPh4–) had been observed to serve as a competent peripheral template for the formation of analogs of 2,14 we explored the ability of this anion to influence the equilibria between individual cage identities, so as to amplify homoleptic cages by driving narcissistic self-sorting. When BPh4– (10 equiv.) was added to a solution of CoII6LBxLC4–x, we observed only the imine 1H NMR peaks of homoleptic species 2 and 3, as opposed to the multiple imine 1H NMR peaks observed in the mixture (Fig. S32†). Peaks that could not be attributed to 2 or 3 in the 1H NMR spectrum indicated the residual presence of heteroleptic species; however, 2 and 3 were the only cages observed by ESI-MS (Fig. S33†). We thus infer homoleptic species to be amplified through the peripheral binding of BPh4– to 2. As BPh4– acts to template the apertures of smaller octahedra, as opposed to binding internally, we hypothesise that structures with a higher proportion of B are templated (such as 2·BPh4–), leading leftover C residues to assemble into 3. Tetraphenylborate was likewise observed to amplify homoleptic products 1 and 3 when added to a solution of CoII6LAxLC4–x (Fig. 3a), as indicated by 1H NMR and ESI mass spectra (Fig. S23 and S24†), reflecting the strong binding of this anion to 1.14
Although C and D are structural congeners, their resulting cages 3 and 4, while of identical stoichiometry, are not isostructural (Fig. 1). We hypothesised that the mobility of these species, measured by IM-MS, would enable us to identify cages of different sizes within self-sorted mixtures. When species with identical stoichiometry are ionised, they can be differentiated by the time it takes them to travel through a buffer gas under an electric field.21 Larger structures have a greater number of interactions with the buffer gas in the ion-mobility chamber. This results in extended or elongated structures drifting slower than smaller structures of the same charge.22 The drift time of each species is directly related to its collisional cross section, which in turn depends on its geometry. Differences in the drift time for a specific charged fragment therefore report on conformational differences between species composed of identical parts. We thus inferred that the structural difference between 3 and 4 would allow us to assign each heteroleptic species to either an octahedral or a scalenohedral geometry, based on the differences in drift time observed for these species by IM-MS.23
Reflecting their different sizes, we observed longer drift times by IM-MS for 4 than for 3 across all charge states. The analysis of CoII6LCxLD4–x by IM-MS likewise revealed two drift time regimes for each charge state, representing the two different structure types present in the mixture (Fig. S39†). Examination of each of these regions displayed m/z signals corresponding to either an octahedral or scalenohedral configuration. We observed the octahedron to be favoured when incorporating >2 equivalents of C, while the scalenohedron was favoured when >2 equivalents of D were incorporated into the assembly (Fig. 3c). Although triflate templated 4, the use of the CoII salt of this anion was not observed to drive narcissistic self-sorting of 3 and 4 the way BPh4– did in the case of 1 and 2.
Quantification of ligand and structure distributions
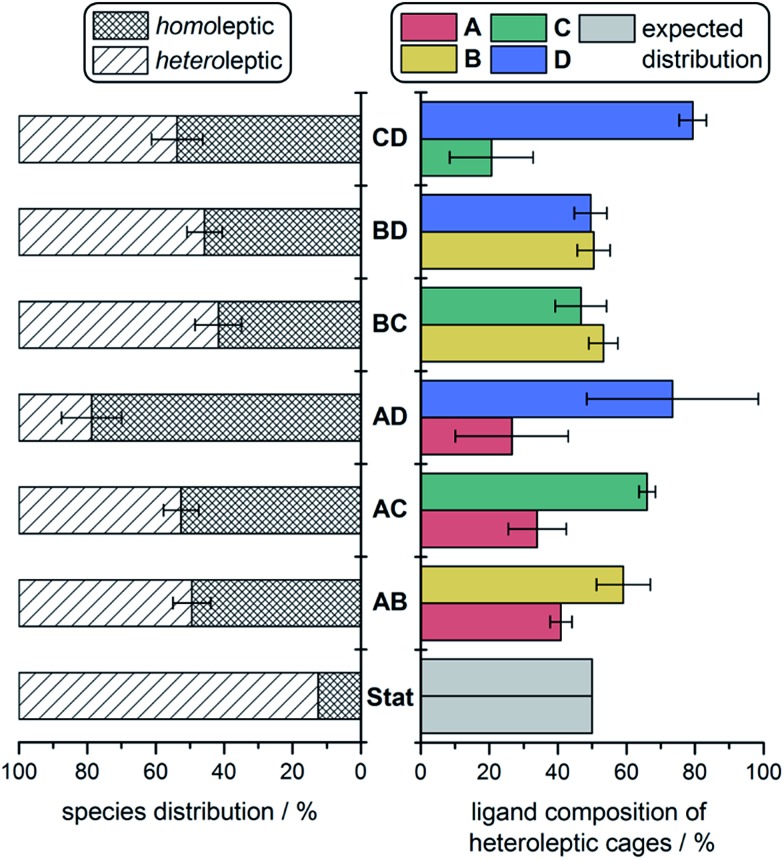
We were able to quantify fine-grained details of self-sorting within these cage systems using ESI-MS (ESI Section 6†). In each case, an ESI mass spectrum of two freshly-combined homoleptic cages, at equal concentrations and normalised to unity, was compared to the ESI mass spectrum of an equilibrated mixture of all corresponding building blocks, also normalised to unity. For instance, a fresh mixture of 1 and 2 was compared against equilibrated CoII6LAxLB4–x. The relative decrease in the intensity of peaks attributed to homoleptic cages was used to quantify the amount of each ligand integrated into all heteroleptic species. This method provided information on both the product distribution within the sorted mixtures (i.e., the percentage decrease observed for homoleptic species), as well as the proportion of each ligand integrated into heteroleptic species for each experiment (Fig. 4).
Fig. 4. Product distributions determined from ESI-MS experiments: percentage distribution of homo- vs. heteroleptic products (left) and the ligand make-up of the heteroleptic species (right), compared to the statistical (binomial) distribution (Stat).
To complement our analysis, we measured the relative quantities of homo- and heteroleptic species in these cage systems by integrating specific proton regions in the 1H NMR spectra attributed to either homo- or heteroleptic species (Fig. S46–49†). The distributions are consistent with our ESI-MS data (Table S4†). We were unable to study the sorting behaviour of diamagnetic congeners of 1–4: neither CdII nor ZnII was observed to generate the scalenohedron; no structures were observed to form cleanly with FeII.
In the case of no enthalpic bias in the formation of homoleptic vs. heteroleptic structures, the composition of a socially-sorted mixture would be 1 : 7 homoleptic : heteroleptic, following a binomial distribution. All sorting experiments deviated substantially from this outcome (Fig. 4, left). An approximately 1 : 1 mixture of homoleptic : heteroleptic products was more typical, indicating a preference throughout for the formation of homoleptic species. We attribute this preference to the strain incorporated into mixed-ligand species by mismatches in ligand size.
The higher proportions of one ligand incorporated over another that were observed in heteroleptic structures indicated that some cage frameworks preferentially incorporated specific ligands. In the cases of the mixtures CoII6LBxLC4–x and CoII6LBxLD4–x, where triamine sizes differed markedly, no biases for the incorporation of one triamine over the other into heteroleptic complexes were observed (Fig. 4, right). However, in the case of CoII6LCxLD4–x, where the triamines were the same size, a clear bias towards the integration of D over C into heteroleptic species was observed. Together with the IM-MS data, which suggest that heteroleptic structures containing more D residues generate scalenohedral cages, these ESI-MS data indicate that an achiral scalenohedral geometry is preferred over a chiral octahedral geometry, assuming that ligands are similarly-sized (Fig. 3c). We attribute this bias to favourable edge-to-face aromatic interactions within congeners of 4; OTf– may also help stabilise these structures.
A sharp distinction exists between the behaviours of Avs.B when combined with D during assembly: CoII6LAxLD4–x displayed a stronger bias towards the formation of homoleptic cages (80% of the mixture) over heteroleptic cages (20%) (Fig. 3b), as compared to the CoII6LBxLD4–x system, which displayed equal proportions of homo- vs. heteroleptic species (Fig. 3d and 4). This distribution is in line with the 1H NMR spectrum of CoII6LAxLD4–x, in which the homoleptic species dominate, compared to that of CoII6LBxLD4–x, where multiple products are apparent (Fig. S25 and S34,† respectively). NMR integrations, where possible, support the conclusions drawn based upon our ESI-MS analyses (Table S4†). When CoII6LBxLD4–x was analysed by IM-MS, however, two distinct drift time regimes, corresponding to octahedral and scalenohedral geometries, were observed (Fig. S36†). Remarkably, examination of the shorter drift time regime revealed all heteroleptic species to correspond to octahedral geometries; the only scalenohedron was homoleptic 4. Thus, while A promoted the formation of homoleptic over heteroleptic species, B promoted the formation of heteroleptic octahedra exclusively when combined with D. We infer this situation to arise because B cannot accommodate the strain necessary to form the scalenohedron, whereas D can be integrated into octahedral geometries in a similar manner to that observed for C.
Conclusions
This study thus demonstrates how templation and geometrical effects may be used in concert to influence the outcomes of self-sorting in complex mixtures of three-dimensional products. A simple, highly accessible technique employing ESI mass spectrometry was used to deduce the quantity and composition of metal–organic cages within self-sorted mixtures, while IM-MS enabled the morphology of heteroleptic species to be determined. Combined, these two techniques reported on the distribution of products within self-assembled mixtures. Given the many uses being developed for such hollow self-assembled containers,6e,24 the ability to control and gauge the compositions of heteroleptic mixtures of capsules could be of high value. We envisage applicability in the areas of asymmetric catalysis6h,25 and guest-specific receptor design.19,26
Conflicts of interest
There are no conflicts to declare.
Supplementary Material
Acknowledgments
This work was supported by the UK Engineering and Physical Sciences Research Council (EPSRC EP/M008258/1) and the European Union's Horizon 2020 research and innovation program, Marie Sklodowska-Curie Grant 642192. F. J. R. thanks Cambridge Australia Scholarships for Ph.D. funding. We thank Diamond Light Source for time on beamline I19 (MT-11397).
Footnotes
†Electronic supplementary information (ESI) available: Synthetic details for 1–4 and details on sorting experiments. CCDC 1568164 and 1568165. For ESI and crystallographic data in CIF or other electronic format see DOI: 10.1039/c7sc04927g
References
- (a) van der Zwaag D., de Greef T. F. A., Meijer E. W. Angew. Chem., Int. Ed. 2015;54:8334–8336. doi: 10.1002/anie.201503104. [DOI] [PubMed] [Google Scholar]; (b) Iamsaard S., Aßhoff S. J., Matt B., Kudernac T., Cornelissen J. J. L. M., Fletcher S. P., Katsonis N. Nat. Chem. 2014;6:229–235. doi: 10.1038/nchem.1859. [DOI] [PubMed] [Google Scholar]; (c) Samanta S. K., Moncelet D., Briken V., Isaacs L. J. Am. Chem. Soc. 2016;138:14488–14496. doi: 10.1021/jacs.6b09504. [DOI] [PMC free article] [PubMed] [Google Scholar]; (d) Kumpfer J. R., Rowan S. J. ACS Macro Lett. 2012;1:882–887. doi: 10.1021/mz300224x. [DOI] [PubMed] [Google Scholar]; (e) Avakyan N., Greschner A. A., Aldaye F., Serpell C. J., Toader V., Petitjean A., Sleiman H. F. Nat. Chem. 2016;8:368–376. doi: 10.1038/nchem.2451. [DOI] [PubMed] [Google Scholar]; (f) Liu Z., Liu G., Wu Y., Cao D., Sun J., Schneebeli S. T., Nassar M. S., Mirkin C. A., Stoddart J. F. J. Am. Chem. Soc. 2014;136:16651–16660. doi: 10.1021/ja509480u. [DOI] [PubMed] [Google Scholar]
- Sinha N., Tan T. T. Y., Peris E., Hahn F. E. Angew. Chem., Int. Ed. 2017;56:7393–7397. doi: 10.1002/anie.201702637. [DOI] [PubMed] [Google Scholar]
- (a) Lewis J. E. M., Beer P. D., Loeb S. J., Goldup S. M. Chem. Soc. Rev. 2017;46:2577–2591. doi: 10.1039/c7cs00199a. [DOI] [PubMed] [Google Scholar]; (b) Obana M., Fukino T., Hikima T., Aida T. J. Am. Chem. Soc. 2016;138:9246–9250. doi: 10.1021/jacs.6b04693. [DOI] [PubMed] [Google Scholar]
- (a) Piguet C. Chem. Commun. 2010;46:6209–6231. doi: 10.1039/c0cc00811g. [DOI] [PubMed] [Google Scholar]; (b) Saalfrank R. W., Maid H., Scheurer A. Angew. Chem., Int. Ed. 2008;47:8794–8824. doi: 10.1002/anie.200702075. [DOI] [PubMed] [Google Scholar]
- Bloch W. M., Clever G. H. Chem. Commun. 2017;53:8506–8516. doi: 10.1039/c7cc03379f. [DOI] [PMC free article] [PubMed] [Google Scholar]
- (a) Howlader P., Mukherjee P. S. Chem. Sci. 2016;7:5893–5899. doi: 10.1039/c6sc02012g. [DOI] [PMC free article] [PubMed] [Google Scholar]; (b) Cook T. R., Stang P. J. Chem. Rev. 2015;115:7001–7045. doi: 10.1021/cr5005666. [DOI] [PubMed] [Google Scholar]; (c) Bravin C., Badetti E., Scaramuzzo F. A., Licini G., Zonta C. J. Am. Chem. Soc. 2017;139:6456–6460. doi: 10.1021/jacs.7b02341. [DOI] [PubMed] [Google Scholar]; (d) Yazaki K., Akita M., Prusty S., Chand D. K., Kikuchi T., Sato H., Yoshizawa M. Nat. Commun. 2017:15914. doi: 10.1038/ncomms15914. [DOI] [PMC free article] [PubMed] [Google Scholar]; (e) Custelcean R. Chem. Soc. Rev. 2014;43:1813–1824. doi: 10.1039/c3cs60371g. [DOI] [PubMed] [Google Scholar]; (f) Rodríguez-Jiménez S., Feltham H. L. C., Brooker S. Angew. Chem., Int. Ed. 2016;55:15067–15071. doi: 10.1002/anie.201608813. [DOI] [PubMed] [Google Scholar]; (g) Otte M., Kuijpers P. F., Troeppner O., Ivanović-Burmazović I., Reek J. N. H., de Bruin B. Chem.–Eur. J. 2014;20:4880–4884. doi: 10.1002/chem.201400055. [DOI] [PubMed] [Google Scholar]; (h) Catti L., Zhang Q., Tiefenbacher K. Chem.–Eur. J. 2016;22:9060–9066. doi: 10.1002/chem.201600726. [DOI] [PubMed] [Google Scholar]; (i) Takezawa H., Murase T., Resnati G., Metrangolo P., Fujita M. J. Am. Chem. Soc. 2014;136:1786–1788. doi: 10.1021/ja412893c. [DOI] [PubMed] [Google Scholar]; (j) D'Alessandro D. M. Chem. Commun. 2016;52:8957–8971. doi: 10.1039/c6cc00805d. [DOI] [PubMed] [Google Scholar]
- (a) Sadownik J. W., Mattia E., Nowak P., Otto S. Nat. Chem. 2016;8:264–269. doi: 10.1038/nchem.2419. [DOI] [PubMed] [Google Scholar]; (b) Ingerman L. A., Waters M. L. J. Org. Chem. 2009;74:111–117. doi: 10.1021/jo801783w. [DOI] [PubMed] [Google Scholar]; (c) Lal Saha M., Schmittel M. Org. Biomol. Chem. 2012;10:4651–4684. doi: 10.1039/c2ob25098e. [DOI] [PubMed] [Google Scholar]
- Schalley C. A., Analytical methods in supramolecular chemistry, Wiley-VCH Verlag GmbH & Co. KGaA, 2007. [Google Scholar]
- (a) Safont-Sempere M. M., Fernández G., Würthner F. Chem. Rev. 2011;111:5784–5814. doi: 10.1021/cr100357h. [DOI] [PubMed] [Google Scholar]; (b) Beaudoin D., Rominger F., Mastalerz M. Angew. Chem., Int. Ed. 2017;56:1244–1248. doi: 10.1002/anie.201610782. [DOI] [PubMed] [Google Scholar]; (c) Tidhar Y., Weissman H., Tworowski D., Rybtchinski B. Chem.–Eur. J. 2014;20:10332–10342. doi: 10.1002/chem.201402096. [DOI] [PubMed] [Google Scholar]; (d) Miljanić O. Š. Chem. 2017;2:502–524. [Google Scholar]; (e) De Poli M., Zawodny W., Quinonero O., Lorch M., Webb S. J., Clayden J. Science. 2016;352:575–580. doi: 10.1126/science.aad8352. [DOI] [PubMed] [Google Scholar]; (f) Kolesnichenko I. V., Anslyn E. V. Chem. Soc. Rev. 2017;46:2385–2390. doi: 10.1039/c7cs00078b. [DOI] [PubMed] [Google Scholar]; (g) Otis F., Auger M., Voyer N. Acc. Chem. Res. 2013;46:2934–2943. doi: 10.1021/ar400044k. [DOI] [PubMed] [Google Scholar]
- He Z., Jiang W., Schalley C. A. Chem. Soc. Rev. 2015;44:779–789. doi: 10.1039/c4cs00305e. [DOI] [PubMed] [Google Scholar]
- Zhang M., Gao R., Hao X., Sun W.-H. J. Organomet. Chem. 2008;693:3867–3877. [Google Scholar]
- Bolliger J. L., Ronson T. K., Ogawa M., Nitschke J. R. J. Am. Chem. Soc. 2014;136:14545–14553. doi: 10.1021/ja5077102. [DOI] [PubMed] [Google Scholar]
- Riddell I. A., Smulders M. M. J., Clegg J. K., Hristova Y. R., Breiner B., Thoburn J. D., Nitschke J. R. Nat. Chem. 2012;4:751–756. doi: 10.1038/nchem.1407. [DOI] [PubMed] [Google Scholar]
- Rizzuto F. J., Wu W.-Y., Ronson T. K., Nitschke J. R. Angew. Chem., Int. Ed. 2016;55:7958–7962. doi: 10.1002/anie.201602135. [DOI] [PMC free article] [PubMed] [Google Scholar]
- (a) Rizzuto F. J., Nitschke J. R. Nat. Chem. 2017;9:903–908. doi: 10.1038/nchem.2758. [DOI] [PubMed] [Google Scholar]; (b) Paul R. L., Bell Z. R., Jeffery J. C., McCleverty J. A., Ward M. D. Proc. Natl. Acad. Sci. U. S. A. 2002;99:4883–4888. doi: 10.1073/pnas.052575199. [DOI] [PMC free article] [PubMed] [Google Scholar]; (c) Bell Z. R., Jeffery J. C., McCleverty J. A., Ward M. D. Angew. Chem., Int. Ed. 2002;41:2515–2518. doi: 10.1002/1521-3773(20020715)41:14<2515::AID-ANIE2515>3.0.CO;2-Q. [DOI] [PubMed] [Google Scholar]
- Lanucara F., Holman S. W., Gray C. J., Eyers C. E. Nat. Chem. 2014;6:281–294. doi: 10.1038/nchem.1889. [DOI] [PubMed] [Google Scholar]
- (a) Hong C. M., Kaphan D. M., Bergman R. G., Raymond K. N., Toste F. D. J. Am. Chem. Soc. 2017;139:8013–8021. doi: 10.1021/jacs.7b03812. [DOI] [PubMed] [Google Scholar]; (b) Albrecht M., Isaak E., Baumert M., Gossen V., Raabe G., Fröhlich R. Angew. Chem., Int. Ed. 2011;50:2850–2853. doi: 10.1002/anie.201006448. [DOI] [PubMed] [Google Scholar]; (c) White N. G., MacLachlan M. J. Chem. Sci. 2015;6:6245–6249. doi: 10.1039/c5sc02577j. [DOI] [PMC free article] [PubMed] [Google Scholar]
- Danon J. J., Krüger A., Leigh D. A., Lemonnier J.-F., Stephens A. J., Vitorica-Yrezabal I. J., Woltering S. L. Science. 2017;355:159–162. doi: 10.1126/science.aal1619. [DOI] [PubMed] [Google Scholar]
- Black S. P., Wood D. M., Schwarz F. B., Ronson T. K., Holstein J. J., Stefankiewicz A. R., Schalley C. A., Sanders J. K. M., Nitschke J. R. Chem. Sci. 2016;7:2614–2620. doi: 10.1039/c5sc04906g. [DOI] [PMC free article] [PubMed] [Google Scholar]
- Kieffer M., Pilgrim B. S., Ronson T. K., Roberts D. A., Aleksanyan M., Nitschke J. R. J. Am. Chem. Soc. 2016;138:6813–6821. doi: 10.1021/jacs.6b02445. [DOI] [PubMed] [Google Scholar]
- Dugourd P., Hudgins R. R., Clemmer D. E., Jarrold M. F. Rev. Sci. Instrum. 1996;68:1122–1129. [Google Scholar]
- (a) Chan Y.-T., Li X., Soler M., Wang J.-L., Wesdemiotis C., Newkome G. R. J. Am. Chem. Soc. 2009;131:16395–16397. doi: 10.1021/ja907262c. [DOI] [PubMed] [Google Scholar]; (b) Wang L., Zhang Z., Jiang X., Irvin J. A., Liu C., Wang M., Li X. Inorg. Chem. 2017 doi: 10.1021/acs.inorgchem.7b02361. [DOI] [PubMed] [Google Scholar]
- Qi Z., Heinrich T., Moorthy S., Schalley C. A. Chem. Soc. Rev. 2015;44:515–531. doi: 10.1039/c4cs00167b. [DOI] [PubMed] [Google Scholar]
- Jung M., Kim H., Baek K., Kim K. Angew. Chem., Int. Ed. 2008;47:5755–5757. doi: 10.1002/anie.200802240. [DOI] [PubMed] [Google Scholar]
- Brown C. J., Bergman R. G., Raymond K. N. J. Am. Chem. Soc. 2009;131:17530–17531. doi: 10.1021/ja906386w. [DOI] [PubMed] [Google Scholar]
- Mosquera J., Szyszko B., Ho S. K. Y., Nitschke J. R. Nat. Commun. 2017;8:14882. doi: 10.1038/ncomms14882. [DOI] [PMC free article] [PubMed] [Google Scholar]
Associated Data
This section collects any data citations, data availability statements, or supplementary materials included in this article.


