Abstract
Existing three-dimensional optical imaging methods excel in controlled environments but are difficult to deploy over large, irregular and dynamic fields. This has limited imaging in areas such as material inspection and medicine. To better address these applications, we developed methods in optical coherence tomography (OCT) to efficiently interrogate sparse scattering fields, i.e., those in which most locations (voxels) do not generate meaningful signal. Frequency comb sources are used to superimpose reflected signals from equispaced locations through optical subsampling. This results in circular ranging, and reduces the number of measurements required to interrogate large volumetric fields. As a result, signal acquisition barriers that have limited speed and field in OCT are avoided. With a new ultrafast, time-stretched frequency comb laser design operating with 7.6 MHz to 18.9 MHz repetition rates, we achieved imaging of multi-cm3 fields at up to 7.5 volumes per second.
INTRODUCTION
Most three-dimensional optical microscopies image across a fairly limited volumetric field and are difficult to apply to large samples [1,2]. This is particularly true when the samples have an irregular shape or when, due to sample motion, imaging must be performed rapidly. In medicine, for example, three-dimensional optical microscopies are rarely used to visualize surgical fields or to comprehensively image complex organs such as the bladder or colon. To better address these settings, wide-field and rapid three-dimensional imaging technologies are needed. Optical coherence tomography has scaled to image across large volumes in part because the method relies on coherent ranging rather than beam focusing for depth-sectioning [3,4]; recent works have demonstrated OCT imaging over expansive volumetric fields [5–7]. However, interrogating large volumes at high-resolution implies measuring a large number of voxels. With current OCT approaches, this large voxel set can only be captured with a proportionally large set of measurements [5–11]. This in turn necessitates a massive signal acquisition bandwidth for high-speed imaging. It is now well appreciated that acquisition bandwidth is the key bottleneck in the development of rapid, large volumetric field OCT [6–8].
In this work, we present an interferometric ranging architecture, circular coherent ranging, that dramatically reduces (relative to FD-OCT) the number of measurements required to interrogate a large volumetric field, yet captures nearly identical measures of sample three-dimensional structure. The key distinction lies in how each method handles sparsity. When imaging a large volumetric field, a significant portion of the field does not generate a detectable scattering signals. This includes the regions above the sample surface (typically air) and beyond the penetration depth of light into the sample. Thus, the three-dimensionally resolved scattering measurements are often highly sparse. Existing FD-OCT uses a ranging architecture that independently measures each physical location (termed physical voxel), a method we refer to in this work as linear coherent ranging. As such, sparsity is replicated into the measurement set. By contrast, circular ranging removes this sparsity from the measurement set by combining multiple physical voxels into each measured voxel. The technique avoids a distortion of the sample’s three-dimensional structure through a circular mapping of physical delay/depth to measured delay/depth. Through the compression of the large physical voxel set into a reduced measured voxel set, imaging over a large volumetric field can be performed with substantially lower acquisition bandwidths.
RESULTS
Frequency comb sources provide the physical basis for circular ranging [12,13] (Fig. 1a). This contrasts with the continuous broadband sources typically utilized in linear coherent ranging. By using a frequency comb, signals from equidistant delays are combined optically. To illustrate this we present interferometric signals generated from linear and circular ranging approaches in Fig. 1a. In this example, three mirrors generate reflected signals with delays of τo, τo+Δτ, and τo+2Δτ, all defined relative to a reference beam. An interference between the mirror reflections and the reference beam results in a sinusoidal spectral modulation. In linear ranging, the frequency of this modulation is directly proportional to delay; increasing delay results in a proportionally higher frequency [14,15]. In contrast, with a frequency comb, a finite and discrete set of equally spaced spectral lines (νi = i ∙ Δνfc where i is an integer and Δνfc is the comb free spectral range (FSR)) produces a low-frequency modulation [12] that is the same for all physical delays separated by Δτ = 1/Δνfc (Supplementary Information I). This maps multiple depth locations into a single interference fringe frequency.
Figure 1.
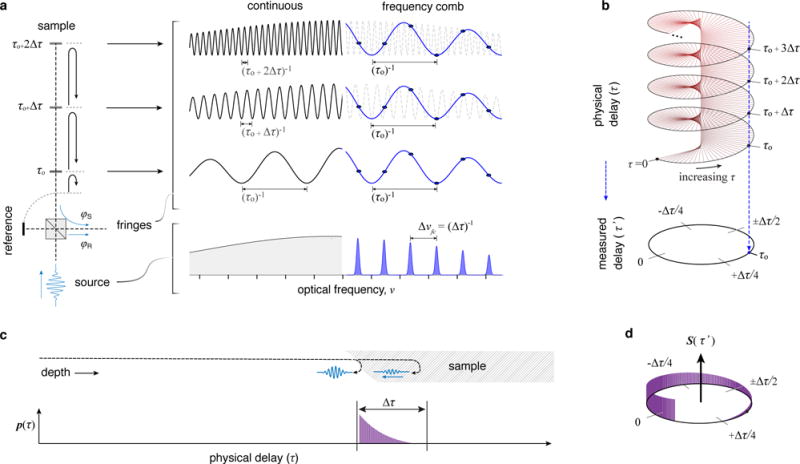
For samples that generate scattering signals throughout the depth field, the superposition of multiple voxels would result in overlapping signals and lead to image artifacts. However, as described above, most long range settings feature significant sparsity; elastic scattering signals begin at the sample surface, and are present to a finite sample depth (1-2 mm in most biological tissues). In these settings, extended depth ranges are used to accommodate the uncontrolled and/or dynamic position of the sample.
To capture these sparse, depth-confined signals without artifacts, we implement a circular mapping of the physical depth field to a reduced measurement space (Fig. 1b). To illustrate, Fig. 1c shows the scattering signal, p(τ), that results from a tissue sample located within a long depth/delay range. The signal is confined (by optical scattering and absorption) to the superficial tissue region (typically less than 2 mm). To profile this sample using linear ranging methods, the full delay range is interrogated, resulting in a measured scattering signal, s(τ), given by s(τ) = p(τ). Circular ranging results in the direct measurement of a compressed scattering profile, S(τ’) (Fig. 1d), given as
| (Eq. 1) |
where τ’ is the circular (measured) delay, S(τ’) is measured from -Δτ/2 to +Δτ/2 and any scattering signal shorter in duration than Δτ (or a circular depth range, , given by cΔτ/(2n)) is mapped one-to-one and without overlap from any other signal within the circular delay space. This is achieved regardless of its position in physical space (Fig. 1d). In this way, these scattering profiles can be efficiently captured without control or a priori knowledge of the location of the sample. Note that the circular delay range (Δτ) and circular depth range (Δd) are inversely related to the frequency comb spacing, Δνfc. Hence this parameter can be adjusted to fit the anticipated extent of the scattering signal. More generally, we note that Δd can be set to be less than the signal penetration depth. This is because reflected signals attenuate rapidly with depth in OCT, and thus superficial signals are negligibly affected by an overlap with the much smaller signals that originate from deeper locations. As such, the circular depth range can be set to capture the depth region of interest, even if that is smaller than the imaging penetration depth. The circular mapping described by Fig. 1b is achieved by performing complex fringe demodulation, i.e., by detecting both in-phase (sin[φs-φr]) and quadrature (cos[φs-φr]) fringes (Supplementary Information I).
It is instructive to explicitly compare the imaging performance of linear and circular ranging methods. For both circular and linear ranging, the relationship between the measured voxel rate, Vm, and acquisition data bandwidth, B, is the same and given as
| (Eq. 2) |
where b is the bit depth of each measurement [7]. The methods differ in how the measured voxel rate relates to physical voxel rate, Vp. For linear ranging, Vp = Vm . In circular ranging, Cf = Δz/Δd physical voxels are combined into each measured voxel where Δz is the source coherence length (and both Δz and Δd are defined in air). As a result, the effective physical voxel measurement rate is given by V’p = Cf ∙ Vm . For clarity, we use V’p and Vp to denote physical voxel rates with and without compression, respectively. Thus for a given acquisition data bandwidth, circular ranging supports the same measured voxel rate, but interrogates (although not independently) a physical voxel set that is larger by a factor of Cf . As an example, if we consider a practical continuous acquisition data bandwidth of B = 8 GB/s, measured voxels rates cannot exceed 2 gigavoxels/s (assuming b = 2 bytes). A cubic-centimeter field comprising 2 physical gigavoxels could then be imaged at 1 volume per second using FD-OCT (Vp = Vm). In circular ranging with a compression factor of Cf = 30 (e.g., assuming Δz = 3 cm and Δd = 1 mm), the same acquisition data bandwidth would allow 30 volumes per second (V’p = Cf ∙ Vm).
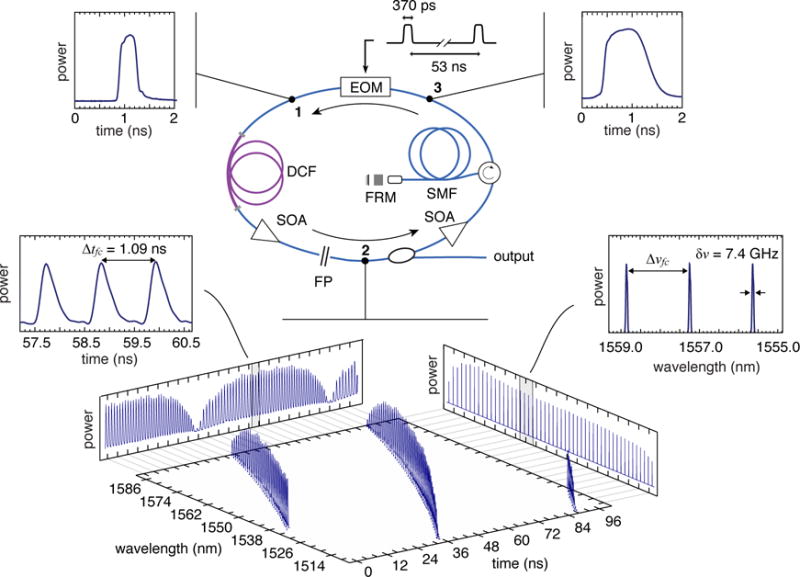
To realize these high voxel rates over centimeter-scale ranges, laser sources that have frequency comb spectra and sweep speeds exceeding 10 MHz are needed. Because suitable sources did not exist, we developed a new time-stretched frequency comb laser source based on active stretched-pulse mode-locking (SPML) principles [13,16–18]. A schematic of the laser is presented in Fig. 2, and additional details are provided in Supplementary Information II. In the laser cavity, an intensity modulator produces sub-nanosecond broadband optical pulses (position 1) that are repeated at a harmonic of the cavity round trip time. An intracavity Fabry-Perot (FP) etalon (Δνfc= 200 GHz) forces a frequency comb spectral structure in these pulses. Matched positive and negative dispersive fibers elastically stretch (position 2) and compress (position 3) the pulses from the modulator. In the stretched state, individual optical frequencies are separated to create a pulse train. This pulse train allows the spectral modulation to be measured rapidly in the time-domain, avoiding the need for speed-limiting spectrometers. In addition to allowing serial measurement across optical frequency, the temporal separation of frequency comb lines also avoids gain competition in the semiconductor optical amplifier that would otherwise narrow the lasing bandwidth. We achieved 80 nm of optical bandwidth centered at 1550 nm. Pulse separation (parameterized by Δtfc) was on the nanosecond scale and comb repetition rates of 18.9 MHz were achieved. An SPML laser configuration using a FP etalon with Δνfc = 80 GHz was also built and is described in Supplementary Figure 5. The high finesse of the intracavity FP etalons created a narrow linewidth on each comb line, providing coherence length limited ranging depths that varied from 2 cm to 3.5 cm depending on specific laser configuration.
Figure 2.
Imaging was performed with the system design and microscope shown in Fig. 3a,b. In the constructed system, we implemented an all-optical polarization-based demodulation circuit to generate separate optical in-phase (I) and quadrature (Q) fringe signals as previously described in Ref. [19]. These I/Q fringe signals were detected and digitized on separate channels. Implemented but not shown in Fig. 3 is a second set of demodulation optical circuits and digitizers to achieve polarization-diverse detection (see Supplementary Figure 6). The RF signals were low-pass filtered to remove out-of-band harmonics associated with the comb source. Signal processing to reconstruct circularly wrapped images follows described methods for FD-OCT [4] (Supplementary Information IV). A cone-beam microscope with a focusing lens located before the beam scanning mirrors was used for all imaging experiments; the specific details of the microscope for each experiment is detailed in Supplementary Table 1. As in FD-OCT, the source bandwidth determines depth resolution and the linewidth defines the source coherence length. The 80 nm bandwidth yielded a depth resolution of 14 μm (in tissue, n = 1.38). Unique to frequency comb circular ranging is the comb spacing parameter, Δνfc, which sets the circular delay range, Δd. At 80 and 200 GHz line spacing, circular depth ranges were 1.358 mm and 543 μm (in tissue) respectively.
Figure 3.
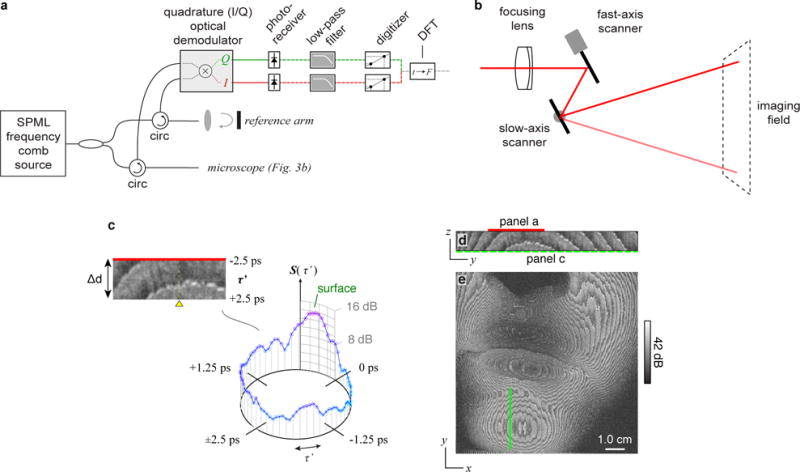
To illustrate imaging by circular ranging, we employed the system to perform large-volume imaging across a face (Fig. 3c-e). As in conventional OCT, cross-sectional (Fig. 3c,d) and en face (Fig. e) images are generated from the magnitude of the scattered signal plotted on a log-scale. Unique to this work, these images are resolved across the circular rather than physical delay. A laser with Δνfc = 200 GHz and an 18.9 MHz repetition (i.e., A-line) rate was used to capture signals across 543 μm of depth in the tissue (Δd). The circular delay wrapping nature of the scattering signal is clearly visible in en face slices extracted from the compressed measurement set (Fig. 3e). Here, banding structures result from the summation of scattering signal from multiple equally spaced physical delays into each measured delay. An examination of the full three-dimensional dataset shows the comprehensive acquisition of all signals in the face (Supplementary Movie 1). The coherence length of the source allowed capture of signals across a 3.5 cm depth range in air (Δz). This generated a compression factor of Cf = 47 (calculated using Δd = 750 μm in air). With an axial resolution of 14 μm in tissue (19.3 μm in air), an effective continuous physical voxel rate of V’p = 34 gigavoxels/s (= 18.9 MHz × 3.5 cm / 19.3 μm) was achieved. This required an acquisition data bandwidth of only B = 3.68 GB/s (see Supplementary Table 1). A more detailed discussion on the relationship between circular RF bandwidths and circular delays are presented in s.
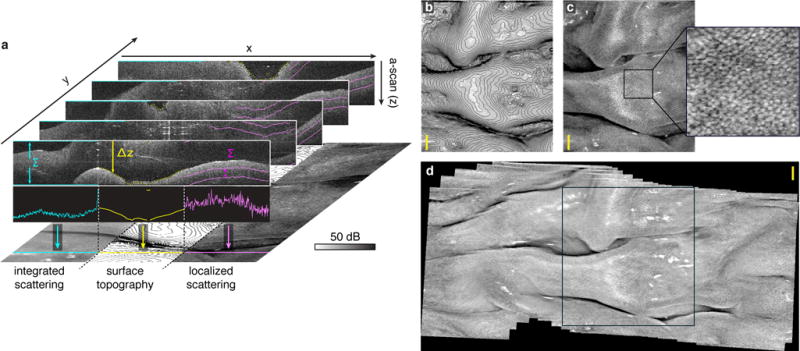
The ability to image continuously at these speeds and fields allows deployment to complex and dynamic environments. To demonstrate this capability, we present videos obtained by laterally scanning across ex vivo porcine colon with multi-cm tissue folds (Fig. 4, Supplementary Movie S2). The system was configured with Δνfc= 80 GHz (Δd = 1.358 mm in tissue), and provided a 3 cm coherence-limited depth range (Δz) at a 7.59 MHz laser repetition rate. With an axial resolution of 15.2 μm (in air), this yielded an effective = 15 gigavoxels/s (= 7.59 MHz × 3 cm /15.2 μm) acquisition. The compression factor was Cf = 16 (calculated using Δd = 1.87 mm in air). Volumetric images were acquired continuously at 7.5 volumes/sec, yielding a 4D dataset. To display this as a video, we generated several visualizations of the three-dimensional dataset. The blue (leftmost) panel in Fig. 4a illustrates a projection generated by averaging the log-scale reflectivities across the full circular depth range. The yellow (middle) panel in Fig. 4a shows topographic lines separated by 50 μm derived using a surface finding algorithm. The magenta (rightmost) panel in Fig. 4a illustrates a projection generated by averaging the log-scale reflectivities across a localized depth range (200 μm - 400 μm) relative to surface. This last projection enhances crypt contrast relative to full depth range averaging. In the grayscale projections shown in Fig. 4b-d, white denotes higher scattering. Both surface topography and crypt patterns could become key diagnostic features for early cancer screening [20]. In Fig. 4d, we employed frame-by-frame registration to create a mosaicked image, highlighting wide-field volumetric imaging by dynamic panning with rapid, continuous acquisition.
Figure 4.
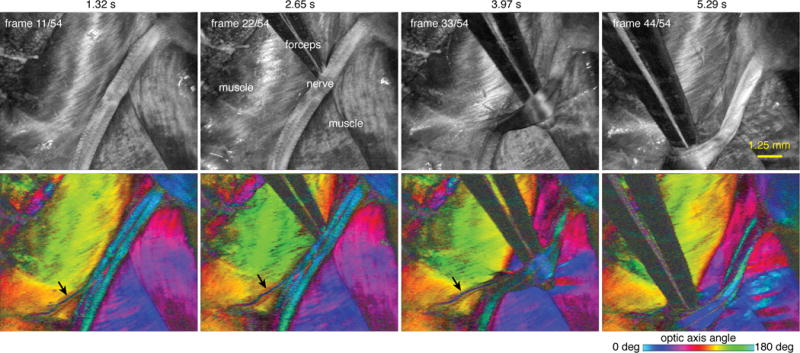
To demonstrate the flexibility of the approach, we implemented polarization-sensitive (PS) methods [21] to enable visualization of tissue birefringence. To perform PS measurements, we implemented intra-frame polarization modulation and derived birefringence using the Stokes formalism [21,22] (see Supplementary Information IV). This system used a source configuration with Δνfc = 200 GHz (Δd = 543 μm in tissue), providing a 2 cm coherence-limited depth range (Δz) and an 18.9 MHz depth-scan rate. Acquisition was performed with polarization diversity using 4 digitizer channels (I and Q on two polarization-channels, see Supplementary Fig. 7). The effective physical voxel imaging rate was = 39.2 gigavoxels/s across two polarization diverse channels (= 2 × 18.9 MHz × 2 cm / 19.3 μm), and the compression factor was Cf = 27 (calculated using Δd = 750 μm in air). We imaged a surgically exposed rat sciatic nerve with forcep manipulation at 6.5 volumes/sec to mimic intra-surgical procedures (Fig. 5, Supplementary Movie S3-5). Full circular depth range averaged log-scale intensity projections were performed as described in Fig. 4a to reveal subsurface microarchitectural features of the nerve (upper row, Fig. 5) [23,24]. The polarimetric properties were analyzed to extract the birefringence axis at each location. The angular orientation of this axis was mapped to a cyclic colormap, and median projections of the optic axis were generated across the full circular depth range to provide polarimetric tissue contrast (lower row, Fig. 5). Of specific interest is the ability of these projections to highlight nerves with high contrast. This capability can be used to improve visualization of nerves underneath fascia or other tissues within a surgical field [25]. As in all video results, each frame of the video is derived from a circularly wrapped three-dimensional dataset. Furthermore, from the PS measurements, parameters such as birefringence can be extracted to provide measures of nerve health (Supplementary Fig. 14, Supplementary Movie S6).
Figure 5.
DISCUSSION
In summary, we describe a compressive coherent ranging method that enables new capabilities in rapid, continuous, and large volumetric field OCT. The core photonic innovation–circular ranging with a frequency comb source that optically subsamples interference fringes–is an elegant solution to acquisition bandwidth barriers that limit OCT. With SPML frequency comb source architectures that support speeds up to 18.9 MHz, this technique allows near video-rate capture of cubic-centimeter fields. By implementing this subsampling in the optical (rather than electronic) domain, the entire detection and acquisition system can operate at reduced bandwidths. Moreover, by reducing the measurement set size, the technique reduces computational requirements for real-time generation of images from acquired signals.
In long-range OCT, there is a trade-off between transverse resolution and depth range (regardless of whether circular ranging or conventional FD methods are used). However, even at centimeter scale ranges, sufficient transverse resolutions can be achieved to support multiple imaging methods. For example, an OCT system operating at 1.55 μm center wavelength and employing Gaussian beams can achieve depths of focus from 0.5 cm to 3 cm with 41 μm to 101 μm transverse FWHM resolutions. By transitioning to 1.0 μm center wavelengths, the same depths of focus can be achieved with resolutions from 33 μm to 81 μm. Many critical architectural features in biological samples and non-biological materials can be identified by structural OCT at these resolutions [26–30]. There are also multiple OCT contrast methods that are not based on resolving small structures, but instead measure broader properties of the tissue/materials. These include attenuation coefficient imaging [31,32], polarization-sensitive measures of birefringence, and spectroscopic methods [33,34] to characterize absorption and ultrastructure. In the future, methods that extend the depth of focus [35–37] (e.g., by using Bessel beams) and/or autofocusing can be used to achieve higher transverse resolution imaging beyond the Gaussian diffraction limit. It is important to note that the circular ranging technique does not require a compromise in axial resolution. By preserving axial resolution, the influence of speckle noise can be reduced in spectroscopic, polarization-sensitive, and attenuation coefficient imaging methods that analyze signals across depth.
Supplementary Material
Acknowledgments
This research was sponsored by NIH grant R01CA163528, P41EB015903, DOD/AFOSR FA9550-11-1-0331, Harvard Medical School Bullock Post-Doctoral Fellowship, NSF Graduate Research Fellowships Program. The authors thank Isabel Chico-Calero for performing animal surgeries and Martin Villiger for providing the spectral binning PS-OCT base code.
Footnotes
AUTHOR CONTRIBUTIONS
MS built the system, planned and executed experiments, performed image processing, and prepared the manuscript. ASN contributed to polarization-sensitive signal processing. ST contributed to building the system. NL executed experiments and contributed to image processing. CB was involved in developing the system software. BJV obtained support, managed the project, and participated in manuscript preparation.
COMPETING FINANCIAL INTERESTS
The authors are inventors on intellectual property owned by the Massachusetts General Hospital. Research support provided by Alcon.
References
- 1.Pawley JB. Handbook of Biological Confocal Microscopy. New York: Springer Science+Business Media; 2006. Fundamental Limits in Confocal Microscopy. [Google Scholar]
- 2.Zipfel WR, Williams RM, Webb WW. Nonlinear magic: multiphoton microscopy in biosciences. Nat Biotechnol. 2003;21:1369–1377. doi: 10.1038/nbt899. [DOI] [PubMed] [Google Scholar]
- 3.Huang D, et al. Optical Coherence Tomography. Science. 1991;254:1178–1181. doi: 10.1126/science.1957169. [DOI] [PMC free article] [PubMed] [Google Scholar]
- 4.Drexler W, et al. Optical coherence tomography today: speed, contrast, and multimodality. J Biomed Opt. 2014;7:071412-1-34. doi: 10.1117/1.JBO.19.7.071412. [DOI] [PubMed] [Google Scholar]
- 5.Xu J, et al. High-performance multi-megahertz optical coherence tomography based on amplified optical time-stretch. Biomed Opt Express. 2015;6:1340–1350. doi: 10.1364/BOE.6.001340. [DOI] [PMC free article] [PubMed] [Google Scholar]
- 6.Wang Z, et al. Cubic meter volume optical coherence tomography. Optica. 2016;3:1496–1503. doi: 10.1364/OPTICA.3.001496. [DOI] [PMC free article] [PubMed] [Google Scholar]
- 7.Wieser W, et al. High definition live 3D-OCT in vivo: design and evaluation of a 4D OCT engine with 1 GVoxel/s. Biomed Opt Express. 2014;5:2963–77. doi: 10.1364/BOE.5.002963. [DOI] [PMC free article] [PubMed] [Google Scholar]
- 8.Wieser W, Biedermann BR, Klein T, Eigenwillig CM, Huber R, Multi-Megahertz OCT. High quality 3D imaging at 20 million A-scans and 4.5 G Voxels per second. Opt Express. 2010;18:14685–14704. doi: 10.1364/OE.18.014685. [DOI] [PubMed] [Google Scholar]
- 9.Song S, Xu J, Wang RK. Long-range and wide field of view optical coherence tomography for in vivo 3D imaging of large volume object based on akinetic programmable swept source. Biomed Opt Express. 2016;7:4734–4748. doi: 10.1364/BOE.7.004734. [DOI] [PMC free article] [PubMed] [Google Scholar]
- 10.Moon S, Kim DY. Ultra-high-speed optical coherence tomography with a stretched pulse supercontinuum source. Opt Express. 2006;14:11575–84. doi: 10.1364/oe.14.011575. [DOI] [PubMed] [Google Scholar]
- 11.Goda K, et al. High-throughput optical coherence tomography at 800 nm. Opt Express. 2012;20:19612–17. doi: 10.1364/OE.20.019612. [DOI] [PubMed] [Google Scholar]
- 12.Siddiqui M, Vakoc BJ. Optical-domain subsampling for data efficient depth ranging in Fourier-domain optical coherence tomography. Opt Express. 2012;20:17938–17951. doi: 10.1364/OE.20.017938. [DOI] [PMC free article] [PubMed] [Google Scholar]
- 13.Tozburun S, Siddiqui M, Vakoc BJ. A rapid, dispersion-based wavelength-stepped and wavelength-swept laser for optical coherence tomography. Opt Express. 2014;22:3414–3424. doi: 10.1364/OE.22.003414. [DOI] [PMC free article] [PubMed] [Google Scholar]
- 14.Youngquist RC, Carr S, Davies DEN. Optical coherence-domain reflectometry: a new optical evaluation technique. Opt Lett. 1987;12:158–160. doi: 10.1364/ol.12.000158. [DOI] [PubMed] [Google Scholar]
- 15.Lexer F, Hitzenberger CK, Fercher AF, Kulhavy M. Wavelength-tuning interferometry of intraocular distance. Appl Opt. 1997;36:6548–6553. doi: 10.1364/ao.36.006548. [DOI] [PubMed] [Google Scholar]
- 16.Tamura K, Ippen EP, Haus HA, Nelson LE. 77-fs pulse generation from a stretched-pulse mode-locked all-fiber ring laser. Opt Lett. 1993;18:1080–1082. doi: 10.1364/ol.18.001080. [DOI] [PubMed] [Google Scholar]
- 17.Haus HA, Tamura K, Nelson LE, Ippen EP. Stretched-pulse additive pulse mode-locking in fiber ring laser: theory and experiment. IEEE J Quantum Electron. 1995;31:591–598. [Google Scholar]
- 18.Lee S, Kim K, Delfyett PJ. eXtreme chirped pulse amplification-beyond the fundamental energy storage limit of semiconductor optical amplifiers. IEEE Photon Technol Lett. 2006;18:799–801. [Google Scholar]
- 19.Siddiqui M, Tozburun S, Zhang EZ, Vakoc BJ. Compensation of spectral and RF errors in swept-source OCT for high extinction complex demodulation. Opt Express. 2015;23:5508–5520. doi: 10.1364/OE.23.005508. [DOI] [PMC free article] [PubMed] [Google Scholar]
- 20.Kudo S, et al. Colonoscopic diagnosis and management of nonpolypoid early colorectal cancer. World J Surg. 2000;24:1081–1090. doi: 10.1007/s002680010154. [DOI] [PubMed] [Google Scholar]
- 21.de Boer JF, Milner TE. Review of polarization sensitive optical coherence tomography and Stokes vector determination. J Biomed Opt. 2002;7:359–371. doi: 10.1117/1.1483879. [DOI] [PubMed] [Google Scholar]
- 22.Villiger M, et al. Spectral binning for mitigation of polarization mode dispersion artifacts in catheter-based optical frequency domain imaging. Opt Express. 2013;21:16353–16369. doi: 10.1364/OE.21.016353. [DOI] [PMC free article] [PubMed] [Google Scholar]
- 23.Islam MS, et al. Extracting structural features of rat sciatic nerve using polarization-sensitive spectral domain optical coherence tomography. J Biomed Opt. 2012;15:056012-1-9. doi: 10.1117/1.JBO.17.5.056012. [DOI] [PMC free article] [PubMed] [Google Scholar]
- 24.Henry FP, et al. In vivo optical microscopy of peripheral nerve myelination with polarization sensitive optical coherence tomography. J Biomed Opt. 2015;20:046002. doi: 10.1117/1.JBO.20.4.046002. [DOI] [PMC free article] [PubMed] [Google Scholar]
- 25.Kitajima K, et al. Visualization of periprostatic nerve fibers before and after radical prostatectomy using diffusion tensor magnetic resonance imaging with tractography. Clin Imaging. 2014;38:302–306. doi: 10.1016/j.clinimag.2014.01.009. [DOI] [PubMed] [Google Scholar]
- 26.Yun SE, et al. Comprehensive volumetric optical microscopy in vivo. Nat Med. 2006;12:1429–1433. doi: 10.1038/nm1450. [DOI] [PMC free article] [PubMed] [Google Scholar]
- 27.Blatter C, Meijer EFJ, Padera TP, Vakoc BJ. Simultaneous measurements of lymphatic vessel contraction, flow and valve dynamics in multiple lymphangions using optical coherence tomography. J Biophotonics. 2017 doi: 10.1002/jbio.201700017. [DOI] [PMC free article] [PubMed] [Google Scholar]
- 28.Utku B, Qin W, Qi X, Kalkan G, Wang RK. OCT-based label-free in vivo lymphangiography within human skin and areola. Sci Rep. 2016;6:1–8. doi: 10.1038/srep21122. [DOI] [PMC free article] [PubMed] [Google Scholar]
- 29.Su R, et al. Perspectives of mid-infrared optical coherence tomography for inspection and micrometrology of industrial ceramics. Opt Express. 2014;22:15804–15819. doi: 10.1364/OE.22.015804. [DOI] [PMC free article] [PubMed] [Google Scholar]
- 30.Rong S, et al. Optical coherence tomography for quality assessment of embedded microchannels in alumina ceramic. Opt Express. 2012;20:4603–4618. doi: 10.1364/OE.20.004603. [DOI] [PubMed] [Google Scholar]
- 31.Yuan W, Kut C, Liang W, Li X. Robust and fast characterization of OCT-based optical attenuation using a novel frequency-domain algorithm for brain cancer detection. Sci Rep. 2017;7:1–8. doi: 10.1038/srep44909. [DOI] [PMC free article] [PubMed] [Google Scholar]
- 32.Vermeer KA, Mo J, Weda JJA, Lemij HG, de Boer JF. Depth-resolved model-based reconstruction of attenuation coefficients in optical coherence tomography. Biomed Opt Express. 2013;5:322–337. doi: 10.1364/BOE.5.000322. [DOI] [PMC free article] [PubMed] [Google Scholar]
- 33.Fleming CP, Eckert J, Halpern EF, Gardecki JA, Tearney GJ. Depth resolved detection of lipid using spectroscopic optical coherence tomography. Biomed Opt Express. 2013;4:1269–1284. doi: 10.1364/BOE.4.001269. [DOI] [PMC free article] [PubMed] [Google Scholar]
- 34.Leitgeb R, et al. Spectral measurement of absorption by spectroscopic frequency-domain optical coherence tomography. Opt Lett. 2000;25:820–822. doi: 10.1364/ol.25.000820. [DOI] [PubMed] [Google Scholar]
- 35.Lorenser D, Singe CC, Curatolo A, Sampson DD. Energy-efficient low-Fresnel-number Bessel beams and their application in optical coherence tomography. Opt Lett. 2014;39:548–551. doi: 10.1364/OL.39.000548. [DOI] [PubMed] [Google Scholar]
- 36.Lee KS, Rolland JP. Bessel beam spectral-domain high-resolution optical coherence tomography with micro-optic axicon providing extended focusing range. Opt Lett. 2008;33:1696–1698. doi: 10.1364/ol.33.001696. [DOI] [PubMed] [Google Scholar]
- 37.Liao W, et al. Endoscopic optical coherence tomography with a focus-adjustable probe. Opt Lett. 2017;42:4040–4043. doi: 10.1364/OL.42.004040. [DOI] [PubMed] [Google Scholar]
Associated Data
This section collects any data citations, data availability statements, or supplementary materials included in this article.


