

Abstract
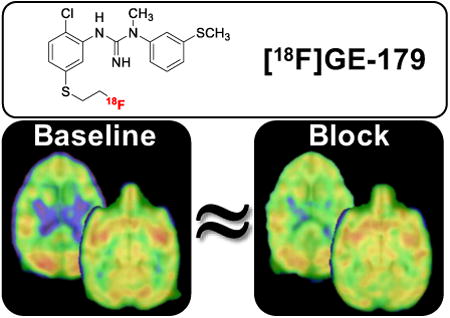
As one of the major excitatory ion channels in the brain, NMDA receptors have been a leading research target for neuroscientists, physicians, medicinal chemists and pharmaceutical companies for decades. Molecular imaging of NMDA receptors by means of positron emission tomography (PET) with [18F]GE-179 quickly progressed to clinical PET studies but a thorough understanding of its binding specificity has been missing and has thus limited signal interpretation. Here, a preclinical study with [18F]GE-179 in rodents and non-human primates is presented, in an attempt to characterize [18F]GE-179 signal specificity. Rodent PET/CT was used to study drug occupancy and functional manipulation in rats by pretreating animals with drug/dose followed by a single bolus of [18F]GE-179. Binding competition with GE-179, MK801, PCP and ketamine, allosteric inhibition by ifenprodil as well as brain activation with methamphetamine did not alter the [18F]GE-179 brain signal in rats. In addition, multimodal imaging with PET/MRI in non-human primates (NHPs) was used to evaluate changes in radiotracer binding as a function of pharmacological challenges. Drug-induced hemodynamic changes were monitored simultaneously using functional MRI. Comparisons of baseline and signal after drug challenge in NHPs demonstrated that the [18F]GE-179 signal cannot be manipulated in a predictable fashion in vivo. fMRI data acquired simultaneously with PET supported this finding and provided evidence that radiotracer delivery is not altered by blood flow changes. In conclusion, the [18F]GE-179 brain signal is not readily interpretable in the context of NMDA receptor binding based on the results shown in this study.
Keywords: NMDA receptors, [18F]GE-179, PET/MRI, neuroreceptor imaging
Graphical abstract
Introduction
NMDA receptors play a pivotal role in synaptic remodeling, learning and memory formation.1,2 They belong to the class of ionotropic glutamate receptors (iGluRs), which also includes AMPA and kainate receptors.3 In contrast to other family members, NMDA receptors display noticeable conductivity for Ca2+ ions, enabling second messenger cascades that eventually change gene expression, triggering the structural changes that underlie synaptic remodeling.4 To regulate these elements of signal transduction, NMDA receptor activation is guarded by multiple safety mechanisms that are unique amongst iGluRs: First, the NMDA channel opening requires co-agonism of both glycine and glutamate. It is worth recognizing that pentameric glycine receptors are chloride channels with an inhibitory effect and functionally counterbalance iGluRs, which are cation channels with an excitatory effect. Second, an Mg2+ ion blocks the NMDA channel pore and is only expelled when the membrane potential depolarizes, i.e. the neuron is activated. In sum, three triggers – glycine agonism, glutamate agonism and membrane depolarization – have to coincide in order for NMDA receptors to open.
Structurally, NMDA receptors follow the classical design of a ligand-gated ion channel with an extracellular ligand-binding domain and an ion conducting transmembrane domain.6 Four distinct binding sites – described in Figure 1 - are commonly addressed with small molecule drugs:7 1) The phenylcyclidine (PCP) binding site located in the channel pore in the TMD, 2) the clam-shell domain of GluNR2, which binds the native agonist glutamate in the LBD, 3) the clam-shell domain of GluNR1, which binds the native ligand glycine in the LBD and 4) the interface of the dimer-of-dimers located in the NTD. Positron emission tomography (PET) ligands have been developed as radiotracer candidates for all four binding sites (reviewed in Fuchigami 2015)8.
Figure 1.
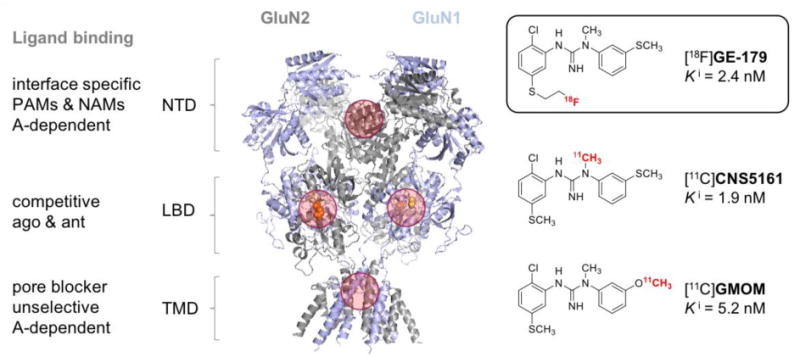
Structure of the NMDA protein crystal (pdb 4pe5).5 NTD = N-terminal domain, LBD = ligand binding domain (referring to native ligands), TMD = transmembrane domaine, PAM = positive allosteric modulator, NAM = negative allosteric modulator, A = activity, GluN2 = subunit that binds glutamate (shown as orange spheres), GluN1 = subunit that binds glycine (shown as yellow spheres). Four common drug binding sites are highlighted with red circles.
Ligands interacting with the pore region act by channel block, agonists and antagonists of the clam-shell domains act as competitive binders to the native agonists and ligands engaging the interface of the NTDs act by (negative or positive) allosteric modulation. Generally, channel blockers do not discriminate between NMDA receptor isoforms due to high sequence homology in the pore region, but competitive or allosteric ligands often display selectivity for NMDA receptor subtypes.9,10 Patch-clamp electrophysiology experiments revealed activity-dependent channel blockade by PCP-binding site ligands, demonstrating that the channel has to be activated before the small molecule can act.11 Furthermore, the term “trapped channel blocker” has been coined based on patch-clamp studies that showed persistent blockade of activated channels long after wash-out of extracellular ligand.12,13 Detailed understanding of these ligand-receptor-interactions is pivotal for interpreting imaging data with the NMDA pore blocker [18F]GE-179.
[18F]GE-179 is an 18F-labeled PET ligand from the class of bisarylguanidine NMDA receptor blockers.14,15 It is structurally related to the 11C-labeled PET ligands CNS516116 and GMOM17 (Figure 1) as well as the single photon emission computed tomography (SPECT) ligand [123/125I]CNS126118. In vivo molecular imaging of NMDA receptors by means of PET or SPECT has been attempted numerous times and many ligands have progressed to human imaging.8,19 However, to date, no in vivo imaging probe has been established in routine research or clinical in vivo imaging applications due to the lack of specific, predictable binding to NMDA receptors.
In vivo imaging studies in healthy human subjects have shown that [18F]GE-179 passes the blood brain barrier (BBB) and displays tissue uptake in the striatum, thalamus and cortex.20 While the latter is consistent with NMDA receptor distribution, human [18F]GE-179 signal also shows relatively high uptake in cerebellum, which has low concentration of the target. In addition, evaluation of compartmental models in healthy human volunteers yielded good fits to a two-tissue compartment model with reversible binding. It is important to note that a trapped, open-channel binding mechanism would lead to irreversible binding kinetics with no noticeable koff. The possibility of anesthesia interfering with NMDA receptor states and associated probes has also been raised in previous investigations.17, 40 A dependency of [18F]GE-179 on blood flow has also been suggested through a correlation between K1 (blood flow) and VT (distribution volume).20
To date, there are no published studies that directly demonstrate in vivo specificity of [18F]GE-179 to NMDA receptors through drug competition studies or otherwise. Clinical research studies with [18F]GE-179 are ongoing and [18F]GE-179 has been used to study patients with focal epilepsy.21 Even though [18F]GE-179 imaging showed global increase of VT compared to healthy controls, it remained unclear if the signal corresponds to (activated) NMDA receptors.
Intrigued by the discrepancy between the established cellular blocking mechanism and the human in vivo binding kinetics and in order to answer if [18F]GE-179 imaging allows quantifying (activated) NMDA-receptors in vivo, we performed a preclinical evaluation in rodents and non-human primates (NHPs) with PET/CT and PET/fMRI.
Results and Discussion
The preclinical experiments in rodents for evaluating the [18F]GE-179 brain signal were designed to evaluate the effect of (i) occupying the PCP binding site with GE-179, MK801, PCP and ketamine, (ii) allosteric inhibition at the NTD binding site with ifenprodil to prevent channel opening, (iii) secondary/orthogonal modulation of NMDA activity through CNS stimulants by methamphetamine. Male Sprague-Dawley rats were pretreated with the respective drug prior to receiving a bolus injection of [18F]GE-179. A subset of the pharmacological challenges (unlabeled GE-179, and a CNS stimulant) were tested in NHPs using a within-scan challenge during a bolus-plus-infusion of the radiotracer. The simultaneous acquisition of PET and fMRI in the NHP enabled the assessment of probe-specific binding changes using PET, while observing changes in neuronal activation patterns and hemodynamic changes resulting from the drug challenges.
In vivo rat imaging and drug competition experiments
As a starting point for dissecting the nature of the in vivo [18F]GE-179 signal, we pre-treated rodents using the non-radioactive reference compound GE-179 as well as the commonly used NMDA channel blockers MK801 and PCP and ketamine22 that compete for the same binding site (Figure 2D). Animals were injected with either an equivalent volume of vehicle or a dose of 1 mg/kg of the respective competition ligand 2 minutes prior to [18F]GE-179 injection. Animals underwent a 60 minute dynamic PET scan and the subsequent time-activity-curves (TACs) were evaluated to compare the slope over the entire time-course. Figure 2A displays TACs of the whole brain as well as cortex (Ctx) and cerebellum (Cb) of three vehicle treated rats, which served as a baseline for referencing drug challenges. There was no significant difference in slope between the whole-brain signal and Ctx or Cb. To compare the effect of competitive drug challenges on [18F]GE-179 binding, we normalized standard uptake values (SUV) to the initial peak uptake, hypothesizing that binding site saturation would accelerate the wash-off and reveal the extent of specific binding (Figure 2B). Interestingly, neither of the experiments led to a meaningful change of the whole-brain TAC indicating that none of the in vivo [18F]GE-179 signal at baseline represents displaceable binding. It could be hypothesized that the binding mode of a trapped channel blocker and a tightly controlled NMDA receptor homeostasis does not allow classical pre-occupation or competition experiments. However, the whole-brain binding kinetics display a clear dissociation and washout, which would invalidate the assumption that the signal represents a ligand-receptor-interaction via trapped binding mode.
Figure 2. In vivo.
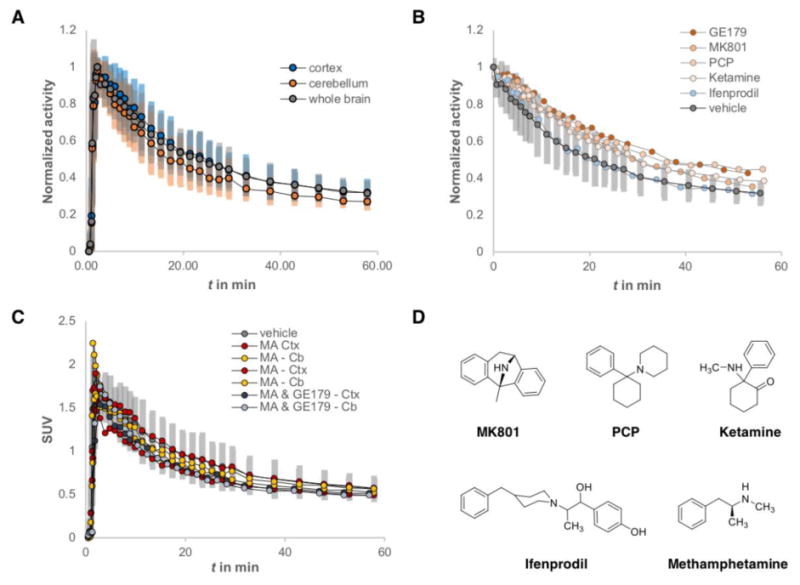
micro-PET imaging of [18F]GE-179 in rats. (A) Time-activity-curves (TACs) from vehicle treated rats comparing whole brain (grey), cerebellum (orange) and cortex (blue), n = 3. Activity is normalized to peak uptake; error bars represent one standard deviation in each deflection. (B) Normalized whole brain TACs comparing vehicle treated rats (n = 3) and animals treated with MK801 (n = 1), PCP (n = 1), ketamine (n = 1), and ifenprodil (n = 1). (C) TACs showing the dynamic standard uptake value (SUV) of vehicle treated rats (whole brain, grey, n = 3), as well as the cortex (Ctx) and cerebellum (Cb) of animals, who received methamphetamine (MA) (B = 2) or a mixture of MA and [18F]GE-179 (n = 1). (D) Chemical structures of the drugs, which were used to manipulate the in vivo [18F]GE-179 signal.
Allosteric inhibition
Further investigating the hypothesis that [18F]GE-179 only binds open NMDA receptor channels, we employed the well-investigated NAM ifenprodil, which binds at the interface of NR1 and NR2 subunits and stabilizes a closed channel conformation. Thus, no binding sites should be available for [18F]GE-179 and its signal should represent nonspecific binding. However, the whole-brain TACs of ifenprodil treated rats did not differ from vehicle treated animals, suggesting that the in vivo signal of [18F]GE-179 in anesthetized rats does not represent activated NMDA receptors, but rather non-specific binding (Figure 2B).
Orthogonal activation
A possible explanation of this finding could be that even at baseline conditions, the effect of isoflurane anesthesia lowers the amount of glutamatergic activity to a minimum, yielding a very small population of open NMDA receptors. In this case, the available target density Bmax would be too small to provide a meaningful signal to noise ratio, even with a low nanomolar binder such as [18F]GE-179. Therefore, we used methamphetamine (MA) injections to trigger CNS activity (Figure 2C). MA is one of the strongest brain stimulants that targets the dopaminergic system and triggers cortical glutamate release.23 We hypothesized that an acutely MA-activated brain would show a different population of open NMDA receptors than a vehicle treated brain. We compared the TACs of the Ctx and Cb of rats that received MA, or a mixture of MA and non-radioactive [18F]GE-179 two minutes before radiotracer injection. Neither of these treatments changed the slope of respective TACs compared to whole brain kinetics of the [18F]GE-179 baseline signal.
Taken together, our preclinical imaging experiments with [18F]GE-179 in rodents using direct competition, allosteric modulation and orthogonal activation were not able to reveal an in vivo signal that directly correlates with NMDA receptor occupancy or activity.
NHP imaging using simultaneous PET/MRI
PET/fMRI in NHPs was used to evaluate (i) [18F]GE-179 PET signal modulation, (ii) hemodynamic changes due to pharmacological doses and (iii) species differences as a potential reason for non-specific binding. The acquisition of dynamic PET and fMRI data enabled the evaluation of blood flow as a factor that has been suggested to influence the [18F]GE-179 signal during pharmacological challenges.
Figure 3A shows representative voxelwise maps of the [18F]GE-179 signal in NHP averaged over 20 - 50 minutes after a single bolus injection. The corresponding TAC in Figure 3B shows that kinetics in the NHP are largely identical with the human data, with the exception of minor differences in the uptake between brain regions.
Figure 3.
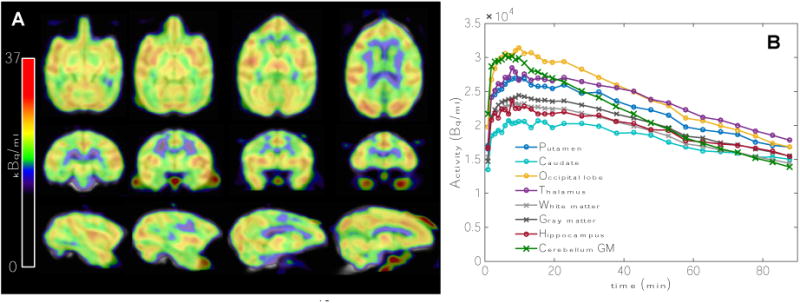
(A) Distribution of the [18F]GE-179 baseline signal in a non-human primate. Voxelwise maps display the average signal over 20-50 minutes after tracer injection. (B) TACs for a variety of anatomical regions show reversible binding and similar dynamics to human data.
To evaluate the effect of pharmacological challenges on the [18F]GE-179 signal at steady-state, a bolus-plus-infusion paradigm was employed for radiotracer administration. It was hypothesized that, given the reversible binding kinetics observed before, a pharmacological dose of cold GE-179 should reduce the brain signal by competitive displacement at the PCP binding site. Figure 4A shows TACs from anatomically defined regions from the blocking experiment with cold GE-179. The PET signal reached steady-state at about 35 minutes after tracer injection. At 46 minutes after TOI, 0.6 mg/kg of cold GE-179 was administered, as indicated by the gray dotted line. Interestingly, the cold GE-179 challenge did not reduce the PET signal, but led to an overall increase of 3.8% ± 4.0% on average over the measured anatomical regions, with prefrontal cortex showing the largest (11.1%) and putamen surprisingly showing the smallest signal increase (3.7%). A small decrease in [18F]GE-179 binding was observed in two anatomical regions, the occipital lobe (-4.3%) and the cerebellum (-4.1%). The signal changes were sustained for the duration of the experiment, as displayed in Figure 4A. The differential effects in various anatomical regions do not correlate with known NMDA receptor distributions, and show relatively small overall signal changes due to a pharmacological dose of cold GE-179.
Figure 4.
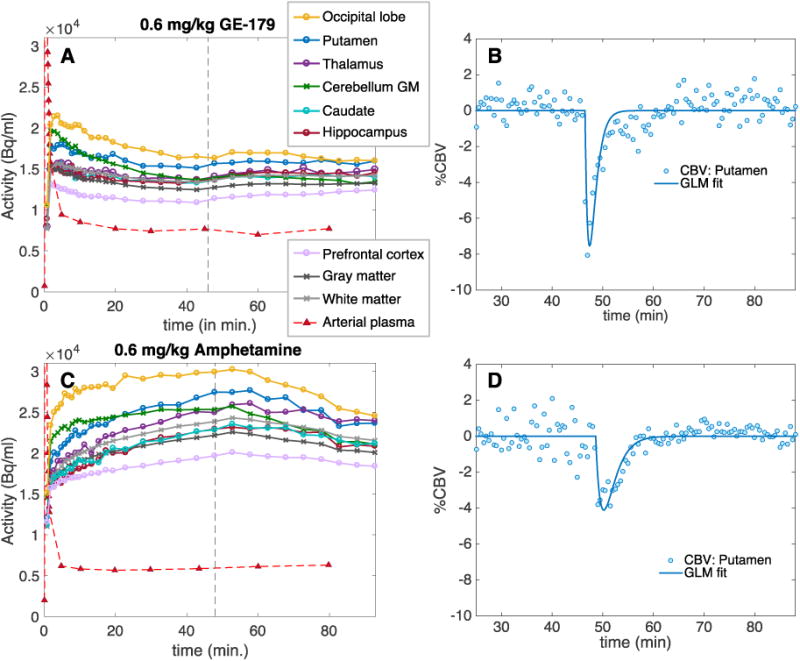
Simultaneously acquired PET and fMRI timecourses during two separate drug challenges in non-human primates. (A) Time activity curves of [18F]GE-179 (bolus plus infusion) with a cold 0.6 mg/kg GE-179 drug challenge administered at the dotted gray line. Anatomical regions of interest in the brain and the arterial plasma curve are shown. (B) Corresponding representative CBV data and GLM fit for the putamen for the GE-179 drug challenge. (C) TACs of [18F]GE-179 (bolus plus infusion) with a 0.6 mg/kg amphetamine drug challenge administered at the dotted gray line. Anatomical regions of interest in the brain and the arterial plasma curve are shown. (D) Corresponding representative CBV data and GLM fit for the putamen for the amphetamine challenge.
Arterial plasma blood levels of [18F]GE-179 were not affected by administration of the cold compound, which demonstrates that delivery of the radiotracer did not change with the pharmacological dose of GE-179. Relative cerebral blood volume (CBV) as determined by fMRI was acutely reduced by cold GE-179 (Figure 4B). Interestingly, this is in contrast to previous reports of NMDA receptor blockers.24 The measured decrease in CBV reflects a decrease in cerebral blood flow (CBF)25 and due to the opposite sign should not be the cause for the observed [18F]GE-179 signal increase.26
Combined, these data highlight that the in vivo [18F]GE-179 PET brain signal cannot be “blocked” by unlabeled competition ligand and thus would not represent saturable or displaceable binding, as standardly defined by in vivo PET imaging. The reduction in CBV by GE-179 has no measurable effect on the PET signal, indicating that the signal is independent of flow, contrary to previous suggestions.20 Based on this evaluation in rodents and non-human primates with PET, the major part of the [18F]GE-179 signal seems to be largely nonspecific. Our results thus indicate that [18F]GE-179 is an inadequate tool for quantifying NMDA receptor availability.
We finally tested the application of [18F]GE-179 as an activity-dependent brain imaging probe in NHPs. Even though open channel blockers at the PCP binding site typically display activity-dependent binding, previous evidence towards this functionality in [18F]GE-179 imaging is partly contradicting: First, the anesthetized NHP brain should show different activity patterns than the awake human brain due to increased GABA-ergic activity. Second, the in vivo binding kinetics of [18F]GE-179 in rodents, NHP and humans do not prove a trapped binding mechanism, which has been observed in cellular electrophysiology. In order to provide conclusive experimental evidence for activity dependent [18F]GE-179 binding in vivo in our study, we employed a bolus plus infusion paradigm including administration of a brain stimulant at binding equilibrium. At 48 minutes post injection of radiotracer (steady-state), a bolus of amphetamine was administered (0.6mg/kg i.v.). We hypothesized that according to the binding mechanism by open channel block, increased glutamatergic activity should lead to an increase of regional [18F]GE-179 signal. Figure 4C shows the resulting TACs from a bolus plus infusion of [18F]GE-179 for a range of anatomical regions in the NHP: The PET signal decreased acutely and sustainably following amphetamine administration. The difference in the shape of the TAC during uptake in Figure 4A vs. 4C can be attributed to small adjustments in the bolus/infusion ratios between the two experiments (see Methods for kbol values). Table 1 lists the [18F]GE-179 signal decrease due to amphetamine for different anatomical regions. Maximum [18F]GE-179 signal decrease from baseline was observed in the cerebellum (-16.6%), occipital lobe (-15.9%) and in putamen (-11.7%). The smallest decrease was observed in the thalamus (-3.1%) and the prefrontal cortex (-3.8%). In line with previous observations,27,28 the CBV signal due to amphetamine decreased acutely due to the dominant signaling from the inhibitory dopamine D2 receptor. This experiment could not provide evidence of the hypothesis of an activity-dependent [18F]GE-179 signal in vivo.
Table 1.
Percent changes in [18F]GE-179 binding from baseline due to a within-scan challenge of 0.6 mg/kg GE-179 or 0.6 mg/kg amphetamine in non-human primates.a
| Putamen | Caudate | Thalamus | Hippocampus | Prefrontal cortex | Occipital lobe | Cerebellum GM | GM | WM | |
|---|---|---|---|---|---|---|---|---|---|
| GE-179 | 3.7% | 5.8% | 5.9% | 7.3% | 11.1% | -4.3% | -4.1% | 4.6% | 4.5% |
| Amphetamine | -11.7% | -5.0% | -3.1% | -6.8% | -3.8% | -15.9% | -16.6% | -7.4% | -7.3% |
Baseline was calculated as the average signal for 15 min before the drug challenge, and the challenge was the average signal for the last 15 min of the dataset.
Administration of psychostimulants like amphetamine and methamphetamine has been demonstrated to be associated with increased dopamine and glutamate release as well as NMDA synaptic currents29,30. An activity-dependent NMDA probe would thus be expected to exhibit a signal increase in mesocorticolimbic areas with amphetamine administration. Yet, we observed a widespread decrease in signal. Even though some evidence has been shown that amphetamine could inhibit the NMDA receptor directly or decrease NMDA signaling31,32, the amphetamine dose administered in our experiment would be expected to elicit a much stronger and anatomically specific change in signal. Both amphetamine and cold GE-179 elicited only an overall small signal change even though administered doses were large and are known to affect NMDA receptors, suggesting that the probe is limited in its detection capability for NMDA activity.
Molecular imaging of NMDA receptors remains a challenge. Our extensive preclinical experiments using the NMDA pore blocker [18F]GE-179 were not able to demonstrate displaceable in vivo binding or a predictable signal manipulation that provides evidence for an in vivo activity-dependent NMDA signal in rats and NHP. We thus recommend interpreting existing and future studies using [18F]GE-179 in light of signal changes of the radiotracer probe rather than NMDA activity.
Methods
Radiotracer synthesis
[18F]GE-179 was synthesized using a thiophenol precursor purchased from GE Healthcare (Amersham, UK) for [18F]fluoroethylation as previously described.15 Briefly, the radionuclide 18F and the common alkylation building block [18F]fluoroethyl tosylate (FETs) were synthesized as described earlier in our lab.33 Freshly prepared FETs was added to 0.8 mg precursor and 0.5 mg K2CO3 as a solution in 0.5 mL acetonitrile. This mixture was heated to 100 oC until all FETs was fully reacted (analyzed by radio-HPLC, typically 10-15 min). The crude mixture was diluted in 10 mL sterile water and passed through a strataX reverse phase SPE cartridge. In order to remove unreacted precursor, the cartridge was washed with 10 mL of 9:1 (v/v) 0.1 M ammonium formate/acetonitrile, followed by 10 mL sterile water. Clean [18F]GE-179 was eluted with absolute ethanol (1mL) diluted with saline (9 mL) and passed through a sterile membrane filter (0.22 μm) into a sterile evacuated vial ready for injection for imaging experiments in rodents and non-human-primates. Purity and identity of the radiolabeled compound was confirmed using UV (list wavelength) and radio-HPLC (reference standard provided purchased by GE and confirmed by LCMS).
Preparation of pharmacological challenges
The drugs MK801, PCP, ifenprodil, MA and amphetamine, which were used for the pharmacological challenges in the rats and NHPs, were obtained from Sigma-Aldrich (St. Louis, MO, USA). Unlabelled GE-179 was purchased from GE Healthcare (Amersham, United Kingdom). MK801 and PCP were formulated in saline + 10% EtOH, ifenprodil and GE-179 were formulated in saline + 10% (1:1 v/v DMSO/tween80), MA and amphetamine were formulated in saline on the day of the experiment. Ketamine was obtained in liquid formulation and diluted in saline to the appropriate concentration. All treatmen and imaging experiments were performed according to procedures approved by the Institutional Animal Care and Use Committee at the Massachusetts General Hospital.
Rat experimental design, image acquisition and analysis
Sprague-Dawley rats (total of n = 12, 250 – 500 g) were anaesthetized using isoflurane inhalation (1-2 % with oxygen carrier) and depth of anesthesia was controlled by maintaining a breathing rate of ∼60 min-1. Animals were placed in a Triumph PET-CT-scanner and dynamic scanning was initiated 10 sec prior to injection of [18F]GE-179. At the end of the PET scan, a CT-scan was performed for attenuation correction and anatomical reference. Imaging data were reconstructed in increasing time frames using the MLEM method and analyzed using PMOD and AMIDE software.
NHP experimental design
Two animals (male rhesus macaques) underwent PET/MRI. For each study, the animal was anesthetized, initially with 10 mg/kg ketamine and 0.5 mg/kg xylazene, and maintained with isoflurane (∼1%, mixed with oxygen) after intubation. A timespan of ~2 h was ensured between the initial ketamine administration and injection of the radiotracer to allow for the washout of ketamine and to minimize any direct blocking effects due to ketamine. All studies and procedures complied with the regulations of the Institutional Animal Care and Use Committee at Massachusetts General Hospital. For the baseline study, a bolus of 4.5 mCi [18F]GE-179 was injected intravenously. Based on the single bolus injection kinetics, bolus plus infusion parameters were calculated.34 Based on this protocol, equilibrium should be reached within 30-40 minutes, and thus the time points for the drug challenges were chosen to occur beyond that time for a predictable signal manipulation. For the cold GE-179 challenge experiment, a bolus of 3.0 mCi was followed by continuous infusion of 3.6 mCi over the course of 100 minutes (kbol = 84 min). For the amphetamine challenge, a bolus of 3.0 mCi was followed by continuous infusion of 4.0 mCi (kbol = 75 min). For monitoring overall [18F]GE-179 blood concentrations, arterial blood (venous blood for the baseline study) was taken throughout the experiment. Using simultaneous fMRI, cerebral blood volume (CBV) was calculated in order to correlate CBV changes to PET signal.
NHP image acquisition
Simultaneous PET and MR data were acquired on a prototype scanner that consists of a BrainPET insert and a Tim Trio 3T MR scanner (Siemens AG, Healthcare Sector, Erlangen Germany). A custom-built PET compatible 8-channel NHP receive array together with a vendor-supplied local circularly polarized transmit coil was used for MRI.35 An anatomical, T1-weighted MRI (MEMPRAGE)36 was acquired at the beginning of the scan session. To improve fMRI detection power, ferumoxytol (Feraheme, AMAG Pharmaceuticals, Cambridge MA) was injected at 10 mg/kg prior to fMRI and radiotracer injection. Whole-brain fMRI data were then acquired throughout the remainder of the scanning session with multi-slice echo-planar imaging (EPI) at 2-fold acceleration that had an isotropic resolution of 1.3 mm and a temporal resolution of 3 seconds. Other parameters included FOVMR = 110×72.8 mm2, BW = 1350 Hz/pixel, flip angle = 60° and an echo time (TE) of 23 ms.
PET emission data were acquired in list-mode format for 100 min starting with radiotracer injection. Images were reconstructed with a standard 3D Poisson ordered-subset expectation maximization algorithm using prompt and variance-reduced random coincidence events. Normalization, scatter and attenuation sinograms (including attenuation of the radiofrequency coil) were included in the reconstruction. The reconstructed volume consisted of 1.25×1.25×1.25 mm voxels in a 256×256×153 matrix, which were downsampled by a factor of 2 post-reconstruction. Framing intervals were 10 × 1 min, 5 × 2 min, followed by 5 min frames.
NHP functional image analysis
PET and MR data were registered to the Saleem-Logothetis stereotaxic space (Saleem and Logothetis, 2006)37 with an affine transformation (12 degrees of freedom) using a multi-subject MRI template38, in which anatomical ROIs were defined. After motion-correcting (AFNI software) and spatially smoothing fMRI data with a 2.5 mm Gaussian kernel, statistical analysis was carried out using the general linear model (GLM). The temporal response to the drug injection was modeled with a gamma-variate function, in which the time-to-peak was adjusted to minimize the χ2/DOF of the GLM fit to the data. The resulting signal changes were converted to percent changes in CBV by previously described methods.39 All PET and fMRI data analysis and generation of parametric images from voxel-wise kinetic modeling were generated with open-access software (www.nitrc.org/projects/jip).
Acknowledgments
We thank Helen Deng, Grae Arabasz, Shirley Hsu for their help with NHP experiments. This research was supported through a collaborative research agreement from GE Global Research, Niskayuna, USA. Further support included grants from the National Institutes of Health (NIH): P41EB015896, S10RR026666, S10RR022976, S10RR019933 and S10RR017208. MS was supported by the MSCA fellowship INSCAPE from the REA of the European Commission, JMH received support from the Phyllis and Jerome Lyle Rappaport MGH Research Scholar Award and CYS received support from the K99DA043629 (NIH).
References
- 1.Paoletti P, Bellone C, Zhou Q. NMDA receptor subunit diversity: impact on receptor properties, synaptic plasticity and disease. Nat Rev Neurosci. 2013;14:383–400. doi: 10.1038/nrn3504. [DOI] [PubMed] [Google Scholar]
- 2.Iacobucci GJ, Popescu GK. NMDA receptors: linking physiological output to biophysical operation. Nat Rev Neurosci. 2017;18:236–249. doi: 10.1038/nrn.2017.24. [DOI] [PMC free article] [PubMed] [Google Scholar]
- 3.Traynelis SF, Wollmuth LP, McBain CJ, Menniti FS, Vance KM, Ogden KK, Hansen KB, Yuan H, Myers SJ, Dingledine R. Glutamate receptor ion channels: structure, regulation, and function. Pharmacol Rev. 2010;62:405–96. doi: 10.1124/pr.109.002451. [DOI] [PMC free article] [PubMed] [Google Scholar]
- 4.Hunt DL, Castillo PE. Synaptic plasticity of NMDA receptors: mechanisms and functional implications. Curr Opin Neurobiol. 2012;22:496–508. doi: 10.1016/j.conb.2012.01.007. [DOI] [PMC free article] [PubMed] [Google Scholar]
- 5.Karakas E, Furukawa H. Crystal structure of a heterotetrameric NMDA receptor ion channel. Science (80-) 2014;344:992–997. doi: 10.1126/science.1251915. [DOI] [PMC free article] [PubMed] [Google Scholar]
- 6.Erkan Karakas and Hiro Furukawa. Crystal structure of a heterotetrameric NMDA receptor ion channel. Science (80-) 2014;344:992–998. doi: 10.1126/science.1251915. [DOI] [PMC free article] [PubMed] [Google Scholar]
- 7.Monaghan DT, Jane DE. Biol NMDA Recept. CRC Press/Taylor & Francis; 2009. Pharmacology of NMDA Receptors. [PubMed] [Google Scholar]
- 8.Fuchigami T, Nakayama M, Yoshida S. Development of PET and SPECT probes for glutamate receptors. Sci World J. 2015;2015:716514. doi: 10.1155/2015/716514. [DOI] [PMC free article] [PubMed] [Google Scholar]
- 9.Volgraf M, Sellers BD, Jiang Y, Wu G, Ly CQ, Villemure E, Pastor RM, Yuen P, Lu A, Luo X, Liu M, Zhang S, Sun L, Fu Y, Lupardus PJ, Wallweber HJA, Liederer BM, Deshmukh G, Plise E, Tay S, Reynen P, Herrington J, Gustafson A, Liu Y, Dirksen A, Dietz MGA, Liu Y, Wang TM, Hanson JE, Hackos D, Scearce-Levie K, Schwarz JB. Discovery of GluN2A-Selective NMDA Receptor Positive Allosteric Modulators (PAMs): Tuning Deactivation Kinetics via Structure-Based Design. J Med Chem. 2016;59:2760–2779. doi: 10.1021/acs.jmedchem.5b02010. [DOI] [PubMed] [Google Scholar]
- 10.Maolanon AR, Risgaard R, Wang SY, Snoep Y, Papangelis A, Yi F, Holley D, Barslund AF, Svenstrup N, Hansen KB, Clausen RP. Subtype-Specific Agonists for NMDA Receptor Glycine Binding Sites. ACS Chem Neurosci. 2017;8:1681–1687. doi: 10.1021/acschemneuro.7b00117. [DOI] [PMC free article] [PubMed] [Google Scholar]
- 11.MacDonald JF, Bartlett MC, Mody I, Pahapill P, Reynolds JN, Salter MW, Schneiderman JH, Pennefather PS. Actions of ketamine, phencyclidine and MK-801 on NMDA receptor currents in cultured mouse hippocampal neurones. J Physiol. 1991;432:483–508. doi: 10.1113/jphysiol.1991.sp018396. [DOI] [PMC free article] [PubMed] [Google Scholar]
- 12.Bolshakov KV, Gmiro VE, Tikhonov DB, Magazanik LG. Determinants of trapping block of N-methyl-d-aspartate receptor channels. J Neurochem. 2003;87:56–65. doi: 10.1046/j.1471-4159.2003.01956.x. [DOI] [PubMed] [Google Scholar]
- 13.Blanpied TA, Boeckman FA, Aizenman E, Johnson JW. Trapping channel block of NMDA-activated responses by amantadine and memantine. J Neurophysiol. 1997;77:309–23. doi: 10.1152/jn.1997.77.1.309. [DOI] [PubMed] [Google Scholar]
- 14.Dumont F, Sultana A, Waterhouse RN. Synthesis and In Vitro Evaluation of N , N 0 -Diphenyl and N -Naphthyl- N 0 -phenylguanidines as N -Methyl- D -aspartate Receptor Ion-Channel Ligands. 2002;12:1583–1586. doi: 10.1016/s0960-894x(02)00235-4. [DOI] [PubMed] [Google Scholar]
- 15.Robins EG, Zhao Y, Khan I, Wilson A, Luthra SK, Rstad E. Synthesis and in vitro evaluation of 18F-labelled S-fluoroalkyl diarylguanidines: Novel high-affinity NMDA receptor antagonists for imaging with PET. Bioorganic Med Chem Lett. 2010;20:1749–1751. doi: 10.1016/j.bmcl.2010.01.052. [DOI] [PubMed] [Google Scholar]
- 16.Walters MR, Bradford APJ, Fischer J, Lees KR. Early clinical experience with the novel NMDA receptor antagonist CNS 5161. Br J Clin Pharmacol. 2002;53:305–311. doi: 10.1046/j.0306-5251.2001.01541.x. [DOI] [PMC free article] [PubMed] [Google Scholar]
- 17.Waterhouse RN, Slifstein M, Dumont F, Zhao J, Chang RC, Sudo Y, Sultana A, Balter A, Laruelle M. In vivo evaluation of [11C]N-(2-chloro-5-thiomethylphenyl)- N′-(3-methoxy-phenyl)-N′-methylguanidine ([11C]GMOM) as a potential PET radiotracer for the PCP/NMDA receptor. Nucl Med Biol. 2004;31:939–948. doi: 10.1016/j.nucmedbio.2004.03.012. [DOI] [PubMed] [Google Scholar]
- 18.Knol RJJ, De Bruin K, Van Eck-Smit BLF, Pimlott S, Wyper DJ, Booij J. In vivo [123I]CNS-1261 binding to D-serine-activated and MK801-blocked NMDA receptors: A storage phosphor imaging study in rats. Synapse. 2009;63:557–564. doi: 10.1002/syn.20629. [DOI] [PubMed] [Google Scholar]
- 19.Waterhouse RN. Imaging the PCP site of the NMDA ion channel. Nucl Med Biol. 2003;30:869–878. doi: 10.1016/s0969-8051(03)00127-6. [DOI] [PubMed] [Google Scholar]
- 20.McGinnity CJ, Hammers A, Barros DAR, Luthra SK, Jones PA, Trigg W, Micallef C, Symms MR, Brooks DJ, Koepp MJ, Duncan JS. Initial Evaluation of 18F-GE-179, a Putative PET Tracer for Activated N-Methyl d-Aspartate Receptors. J Nucl Med. 2014;55:423–430. doi: 10.2967/jnumed.113.130641. [DOI] [PubMed] [Google Scholar]
- 21.McGinnity CJ, Koepp MJ, Hammers A, Riaño Barros DA, Pressler RM, Luthra S, Jones PA, Trigg W, Micallef C, Symms MR, Brooks DJ, Duncan JS. NMDA receptor binding in focal epilepsies. J Neurol Neurosurg Psychiatry. 2015;86:1150–1157. doi: 10.1136/jnnp-2014-309897. [DOI] [PMC free article] [PubMed] [Google Scholar]
- 22.Tyler MW, Yourish HB, Ionescu DF, Haggarty SJ. Classics in Chemical Neuroscience: Ketamine. ACS Chem Neurosci. 2017;8:1122–1134. doi: 10.1021/acschemneuro.7b00074. [DOI] [PubMed] [Google Scholar]
- 23.Parsegian A, See RE. Dysregulation of Dopamine and Glutamate Release in the Prefrontal Cortex and Nucleus Accumbens Following Methamphetamine Self-Administration and During Reinstatement in Rats. Neuropsychopharmacology. 2014;39:811–822. doi: 10.1038/npp.2013.231. [DOI] [PMC free article] [PubMed] [Google Scholar]
- 24.Gozzi A, Large CH, Schwarz A, Bertani S, Crestan V, Bifone A. Differential Effects of Antipsychotic and Glutamatergic Agents on the phMRI Response to Phencyclidine. Neuropsychopharmacology. 2008;33:1690–1703. doi: 10.1038/sj.npp.1301547. [DOI] [PubMed] [Google Scholar]
- 25.Grubb RL, Raichle ME, Eichling JO, Ter-Pogossian MM. The Effects of Changes in PaCO2 Cerebral Blood Volume, Blood Flow, and Vascular Mean Transit Time. Stroke. 1974;5:630–639. doi: 10.1161/01.str.5.5.630. [DOI] [PubMed] [Google Scholar]
- 26.Sander CY, Mandeville JB, Wey HY, Catana C, Hooker JM, Rosen BR. Effects of flow changes on radiotracer binding: Simultaneous measurement of neuroreceptor binding and cerebral blood flow modulation. J Cereb Blood Flow Metab. 2017 doi: 10.1177/0271678X17725418. doi:0271678X1772541. [DOI] [PMC free article] [PubMed] [Google Scholar]
- 27.Choi JK, Chen YI, Hamel E, Jenkins BG. Brain hemodynamic changes mediated by dopamine receptors: Role of the cerebral microvasculature in dopamine-mediated neurovascular coupling. Neuroimage. 2006;30:700–712. doi: 10.1016/j.neuroimage.2005.10.029. [DOI] [PubMed] [Google Scholar]
- 28.Mandeville JB, Sander CYM, Jenkins BG, Hooker JM, Catana C, Vanduffel W, Alpert NM, Rosen BR, Normandin MD. A receptor-based model for dopamine-induced fMRI signal. Neuroimage. 2013;75:46–57. doi: 10.1016/j.neuroimage.2013.02.036. [DOI] [PMC free article] [PubMed] [Google Scholar]
- 29.Lominac KD, Sacramento AD, Szumlinski KK, Kippin TE. Distinct neurochemical adaptations within the nucleus accumbens produced by a history of self-administered vs non-contingently administered intravenous methamphetamine. Neuropsychopharmacology. 2012;37:707–22. doi: 10.1038/npp.2011.248. [DOI] [PMC free article] [PubMed] [Google Scholar]
- 30.Li M, Underhill SM, Reed C, Phillips TJ, Amara SG, Ingram SL. Amphetamine and Methamphetamine Increase NMDAR-GluN2B Synaptic Currents in Midbrain Dopamine Neurons. Neuropsychopharmacology. 2017;42:1539–1547. doi: 10.1038/npp.2016.278. [DOI] [PMC free article] [PubMed] [Google Scholar]
- 31.Yeh G-C, Chen J-C, Tsai H-C, Wu H-H, Lin C-Y, Hsu P-C, Peng Y-C. Amphetamine Inhibits the N-Methyl-D- Aspartate Receptor- Mediated Responses by Directly Interacting with the Receptor/Channel Complex. J Pharmacol Exp Ther. 2002;300:1008–1016. doi: 10.1124/jpet.300.3.1008. [DOI] [PubMed] [Google Scholar]
- 32.Lee KW, Kim HC, Lee SY, Jang CG. Methamphetamine-sensitized mice are accompanied by memory impairment and reduction of N-methyl-d-aspartate receptor ligand binding in the prefrontal cortex and hippocampus. Neuroscience. 2011;178:101–107. doi: 10.1016/j.neuroscience.2011.01.025. [DOI] [PubMed] [Google Scholar]
- 33.Hooker JM, Strebl MG, Schroeder FA, Wey H-Y, Ambardekar AV, McKinsey TA, Schoenberger M. Imaging cardiac SCN5A using the novel F-18 radiotracer radiocaine. Sci Rep. 2017;7:42136. doi: 10.1038/srep42136. [DOI] [PMC free article] [PubMed] [Google Scholar]
- 34.Endres CJ, Kolachana BS, Saunders RC, Su T, Weinberger D, Breier A, Eckelman WC, Carson RE. Kinetic Modeling of [11C]Raclopride: Combined PET-Microdialysis Studies. J Cereb Blood Flow Metab. 1997;17:932–942. doi: 10.1097/00004647-199709000-00002. [DOI] [PubMed] [Google Scholar]
- 35.Sander CY, Keil B, Chonde DB, Rosen BR, Catana C, Wald LL. A 31-channel MR brain array coil compatible with positron emission tomography. Magn Reson Med. 2015;73:2363–2375. doi: 10.1002/mrm.25335. [DOI] [PMC free article] [PubMed] [Google Scholar]
- 36.van der Kouwe AJW, Benner T, Salat DH, Fischl B. Brain morphometry with multiecho MPRAGE. Neuroimage. 2008;40:559–569. doi: 10.1016/j.neuroimage.2007.12.025. [DOI] [PMC free article] [PubMed] [Google Scholar]
- 37.Saleem KS, Logothetis N. A combined MRI and histology atlas of the rhesus monkey brain in stereotaxic coordinates. Elsevier/AP 2012 [Google Scholar]
- 38.McLaren DG, Kosmatka KJ, Oakes TR, Kroenke CD, Kohama SG, Matochik JA, Ingram DK, Johnson SC. A population-average MRI-based atlas collection of the rhesus macaque. Neuroimage. 2009;45:52–59. doi: 10.1016/j.neuroimage.2008.10.058. [DOI] [PMC free article] [PubMed] [Google Scholar]
- 39.Mandeville JB, Marota JJA, Kosofsky BE, Keltner JR, Weissleder R, Rosen BR, Weisskoff RM. Dynamic functional imaging of relative cerebral blood volume during rat forepaw stimulation. Magn Reson Med. 1998;39:615–624. doi: 10.1002/mrm.1910390415. [DOI] [PubMed] [Google Scholar]
- 40.Martin DC, Plagenhoef M, Abraham J, Dennison RL, Aronstam RS. Volatile anesthetics and glutamate activation of N-methyl-D-aspartate receptors. Biochem Pharmacol. 1995;49:809–817. doi: 10.1016/0006-2952(94)00519-r. [DOI] [PubMed] [Google Scholar]