

Abstract
The mechanism of insulin action is a central theme in biology and medicine. In addition to the rather rare condition of insulin deficiency caused by autoimmune destruction of pancreatic β-cells, genetic and acquired abnormalities of insulin action underlie the far more common conditions of type 2 diabetes, obesity and insulin resistance. The latter predisposes to diseases ranging from hypertension to Alzheimer disease and cancer. Hence, understanding the biochemical and cellular properties of insulin receptor signalling is arguably a priority in biomedical research. In the past decade, major progress has led to the delineation of mechanisms of glucose transport, lipid synthesis, storage and mobilization. In addition to direct effects of insulin on signalling kinases and metabolic enzymes, the discovery of mechanisms of insulin-regulated gene transcription has led to a reassessment of the general principles of insulin action. These advances will accelerate the discovery of new treatment modalities for diabetes.
After the discovery of insulin in 1921 ( REF. 1), its mechanism of action remained unclear for at least 30 years. In 1950, Rachmiel Levine2 demonstrated that insulin increases membrane permeability to glucose, as a basis for its glucose-lowering effect, thus ending speculation as to whether insulin binds directly to glycolytic enzymes to modify their activity. In 1971, Jesse Roth and colleagues3 demonstrated the existence of a membrane receptor for insulin. However, the signalling mechanism elicited by insulin binding to the receptor did not become clear until Kasuga and Kahn4, using antibodies isolated from patients with autoimmune syndromes of insulin resistance to immunoprecipitate the receptor, demonstrated that it becomes phosphorylated on tyrosine residues in response to insulin binding — an unexpected finding, as tyrosine phosphorylation had until then been thought of as exclusive to oncogenes. Not until the insulin receptor (IR) cDNA was cloned by the Ullrich and Rutter groups in 1985 ( REFS 5,6) did the notion of tyrosine phosphorylation as the basis for insulin signalling become widely adopted, effectively shifting attention from the cell surface to the intracellular pathways mediating the diverse actions of the receptor (FIG. 1).
Figure 1. Timeline of the major discoveries in insulin signalling.
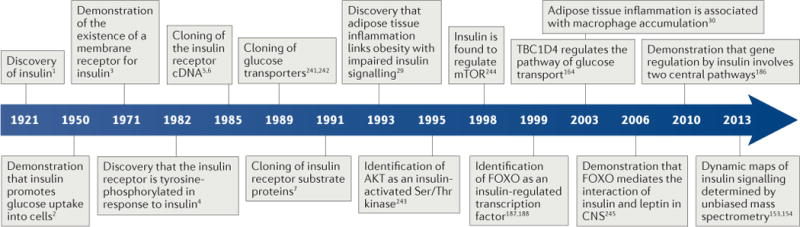
CNS, central nervous system; FOXO, forkhead family box O; TBC1D4, TBC1 domain family member 4.
In 1991, White and Kahn7 cloned the first of four IR substrate (IRS) proteins, a family of adaptor proteins whose main role is to convert the tyrosine phosphorylation signal into a lipid kinase signal by recruiting the catalytic subunit of the enzyme PI3K. The latter generates the triphosphorylated inositol required to activate the serine/threonine kinase AKT. The identification of AKT8 as an insulin-activated serine/threonine kinase solved the riddle of how the tyrosine phosphorylation signal is converted into a serine/threonine phosphorylation signal. In fact, while it had long been apparent that most actions of insulin required the phosphorylation of serine/threonine residues on various substrates, efforts to demonstrate direct effects of insulin on serine/threonine kinases had fallen short. AKT provided the missing link that enabled the clarification of the distal steps in insulin signalling, such as the modulation of glucose uptake by glucose transporter type 4 (GLUT4), glycogen synthesis by glycogen synthase kinase 3 (GSK3), protein and fat synthesis by mTOR and gene expression by forkhead family box O (FOXO) (FIG. 2).
Figure 2. Activation of insulin signalling.
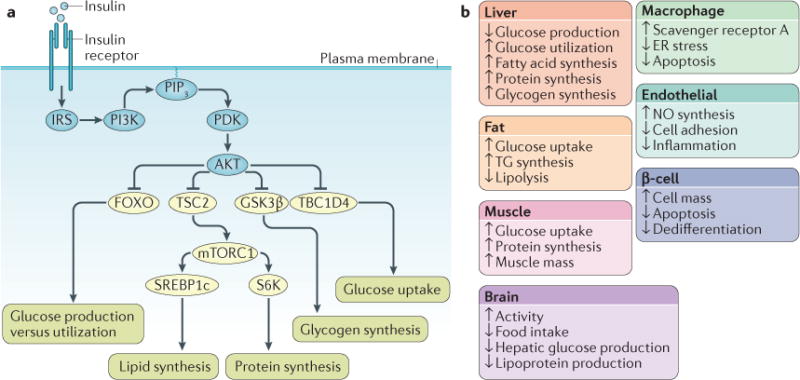
a| Following insulin binding, the insulin receptor (IR) tyrosine kinase is activated, causing tyrosine phosphorylation of IR and of the IR substrate (IRS) proteins. Phosphotyrosine sites on IRS allow binding of the lipid kinase PI3K, which synthesizes PtdIns(3,4,5)P3 (PIP3) at the plasma membrane. This recruits the phosphoinositide-dependent kinase (PDK), which directly phosphorylates the Thr308 residue of AKT. A second phosphorylation of AKT, at the Ser473 residue, is carried out by mTOR complex 2 (mTORC2) (not shown). Activated AKT goes on to phosphorylate a number of substrates at Ser/Thr residues. These include: the forkhead family box O (FOXO) transcription factors; the protein tuberous sclerosis 2 (TSC2), which permits activation of mTORC1 and its downstream targets ribosomal protein S6 kinase (S6K) and sterol regulatory element binding protein 1c (SREBP1c); glycogen synthase kinase 3β (GSK3β) and the RabGAP TBC1 domain family member 4 (TBC1D4). These effector proteins mediate the effects of insulin on glucose production, utilization and uptake, as well as the synthesis of glycogen, protein and lipid. b | Effects of insulin signalling in various tissues and cell types. ER, endoplasmic reticulum; NO, nitric oxide; TG, triglyceride.
Insulin has complex effects on metabolism, cell growth and differentiation. Virtually all mammalian cells possess IRs and hence respond to insulin. The major tissues targeted by insulin’s effects on metabolism include: muscle, where insulin promotes glucose uptake and protein synthesis; adipose tissue, where insulin promotes glucose and fatty acid uptake and inhibits lipolysis; the liver, where insulin promotes glucose utilization, suppresses glucose production, and promotes triglyceride synthesis; and neurons, where it promotes anorexigenic and locomotor signals. Additional notable insulin target cells with a metabolic function include macrophages, endothelial cells and insulin-producing pancreatic β-cells. Moreover, some of the key mediators of insulin signalling — PI3K and AKT — are activated downstream of other growth factor receptors, and conversely some mitogenic pathways — growth factor receptor-bound protein 2 (GRB2) and ERK9 — are activated by insulin, creating a network of interacting signalling pathways10. Therefore, insulin’s signalling mechanisms are complex, and this historical overview falls necessarily short of crediting additional signalling pathways that contribute to the hormone’s diverse effects. Nonetheless, human genetics, animal models and cellular biology have built a consensus around the pathways described above as the main signalling nodes.
In this Review, we focus mainly on the cellular mechanisms of insulin signalling and on new insights into pathways of primary relevance to insulin’s metabolic effects. We describe newly discovered elements of IR signal transduction and how they relate to the main metabolic actions of insulin. We focus on how the IR signal is modulated, including antagonistic proteins and combinatorial interactions among different isoforms, as well as temporal and spatial regulation of cellular insulin signalling. We also highlight key aspects of how these pathways fit into physiology and the pathophysiology of type 2 diabetes, with the general theme that increased insulin action is associated with increased insulin sensitivity, as defined by a leftward shift in the dose–response curve for insulin action on glucose levels. However, work in this field has also identified multiple examples of insulin sensitivity being uncoupled from IR activity11–15 and other suggestions that insulin resistance is an adaptive trait16,17. For recent reviews on insulin resistance, we refer the reader to REFS 18–20.
Antagonistic signalling
Every step in the insulin signalling cascade is a reversible enzymatic reaction. Thus, for each kinase activated by insulin, there are (often multiple) phosphatases that terminate its action. Moreover, in addition to the vast repertoire of serine/threonine kinases regulated by insulin, there is an even larger group of phosphatases that actively suppress the actions of the insulin-activated kinases. Furthermore, different post-translational modifications of the same target protein often result in different biological effects. These mechanisms are as important as signalling initiation but, because of their redundancy, have proved less amenable to cellular and genetic analyses. An overview of antagonistic signalling mechanisms is shown in FIG. 3a.
Figure 3. Modification of insulin signalling.
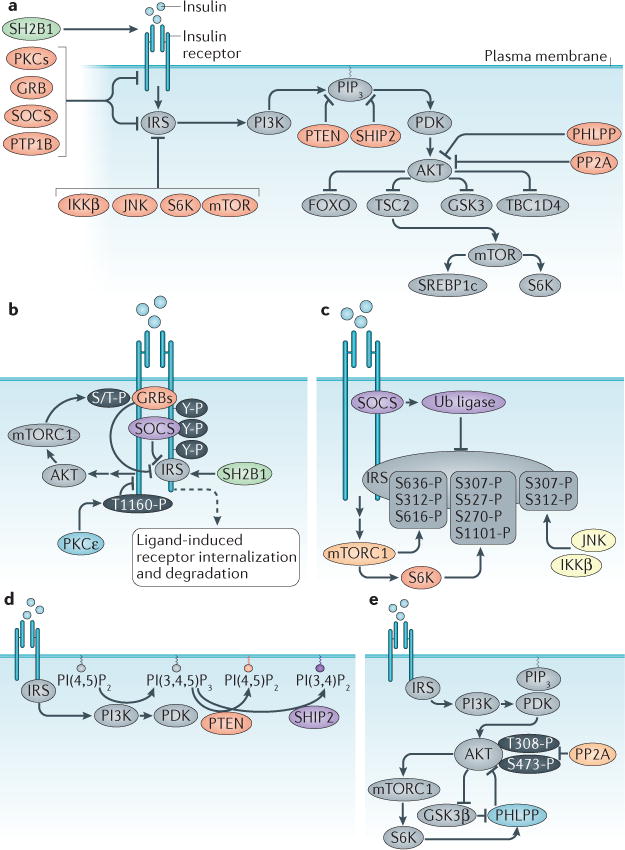
Insulin signalling is antagonized through numerous mechanisms. a | Overview of regulatory mechanisms; these include ligand-induced insulin receptor (IR) internalization and degradation (not shown in this panel), inhibitory phosphorylation of IR substrate (IRS) (by kinases such as IκB kinase β (IKKβ), c-Jun N-terminal kinase (JNK), ribosomal protein S6 kinase (S6K) and mTOR), depletion of PtdIns(3,4,5)P3 (PIP3) by lipid phosphatases (PTEN and SHIP2), removal of activating phosphorylation groups by protein phosphatases (PTP1B, PHLPPs and PP2A), and inhibition by alternative substrates of the IR kinase (such as GRB10, GRB14 and SOCS proteins). In contrast, a different alternative substrate of IR (SH2B1) potentiates insulin signalling. Detailed mechanisms focused on different proteins of the insulin signalling cascade are shown in panels b–d. b | IR. GRB10, GRB14 and SOCS proteins are pseudosubstrates of the IR kinase that block IRS binding. The inhibitory activity of GRB10 is potentiated downstream of insulin signalling, due to mTOR complex 1 (mTORC1)mediated phosphorylation and stabilization. Protein kinase Cε (PKCε) phosphorylates IR, thus blocking IR autophosphorylation. c | IRS proteins. SOCS proteins antagonize insulin signalling in a second manner by recruiting a ubiquitin ligase (Ub ligase) that targets IRS proteins for degradation. Inhibitory Ser/Thr phosphorylation of IRS is carried out by multiple kinases, including mTORC1, S6K, JNK, and IKKβ. d | PIP3. The levels of this lipid mediator are reduced by lipid phosphatases PTEN and SHIP2. e | AKT. Dephosphorylation and inactivation of AKT is carried out by PP2A and PHLPP proteins. The latter are activated by AKT signalling itself, through mechanisms involving mTORC1 and glycogen synthase kinase 3β (GSK3β). GRB, growth factor receptor-bound protein; PHLPP, pleckstrin homology domain and leucine-rich repeat protein phosphatase; PP2A, protein phosphatase 2A; PTP1B, tyrosine-protein phosphatase non-receptor type 1B; SH2B1, SH2B adapter protein 1; SHIP2, Src homology 2 (SH2)-containing inositol 5′-phosphatase 2; SOCS, suppressor of cytokine signalling.
Insulin
The hormone itself is arguably the most important negative regulator of its own signalling. Similar to other receptor tyrosine kinases, IR undergoes ligand-induced internalization and lysosomal degradation or recycling back to the cell surface21 (FIG. 3b). This event requires a 12-amino-acid motif located on the intracellular part of the IR juxtamembrane domain22. This motif targets the receptor to clathrin-coated pits, and from there to lysosomes, whose acidic pH is thought to favour insulin release. Thus, as insulin levels rise, receptor down-regulation at the cell surface paradoxically decreases insulin signalling, contributing to its termination. This is the basis of the common observation that insulin resistance is associated with hyperinsulinaemia. However, because this phenomenon is strictly dependent on plasma insulin concentrations, it is promptly reversed when insulin levels fall, most notably after fasting in humans23.
Inhibitory phosphorylation
As a general rule, tyrosine phosphorylation activates, and serine/threonine phosphorylation inactivates, IR and IRS proteins18,24. At a more granular level, the effects are site-dependent, but serine/threonine phosphorylation is a major mechanism by which IR signalling is fine-tuned, antagonized or terminated.
One example that has been well-studied in vitro is the serine/threonine phosphorylation of IRS by the mTOR-ribosomal protein S6 kinase (S6K) pathway, which may link prolonged insulin signalling with decreased IRS protein levels. Unrestrained activation of S6K causes serine/threonine phosphorylation of IRS, which results in decreased IRS signalling and proteasomal degradation25,26 (FIG. 3c). Additional work has shown that mTOR and S6K phosphorylate IRS at multiple residues24. Consistent with this concept, knocking out S6K1 from mice reduces weight gain and enhances insulin sensitivity27. However, the importance of IRS serine/threonine phosphorylation in these phenotypes and in insulin action in general has been called into question. Mice with a knock-in allele of IRS1 in which the reported S6K-directed phosphorylation site (Ser302) was mutated to alanine showed no alterations in insulin action28. Thus, the mechanisms linking mTOR–S6K signalling to impaired insulin action may be independent of IRS.
A second pathway leading to inhibitory phosphorylation is initiated by inflammatory cytokines29. This pathway can be triggered by macrophage infiltration in adipose tissue during obesity30,31. These macrophages secrete pro-inflammatory cytokines, including TNFα, IL-1β, and IL-6, which act in a paracrine manner to activate serine kinases in adipocytes, including IκB kinase β (IKKβ), c-Jun N-terminal kinase (JNK), S6K and mTOR32 (FIG. 3). These kinases carry out inhibitory phosphorylation of IRS1, thus causing insulin resistance in adipocytes. Consistent with this, activation of inflammatory pathways can impair glucose metabolism and cause systemic insulin resistance32,33. Recent evidence demonstrates that immune cell activation in liver, muscle, pancreas and brain can also impair local insulin signalling and lead to metabolic dysfunction32. However, the physiological relevance of IRS serine/threonine phosphorylation in these tissues has been questioned. Mice carrying an IRS1 allele in which the expected TNFα-dependent phosphorylation site (Ser307) is mutated to alanine showed impaired insulin action34, the opposite of what would have been expected based on the paradigm established in vitro. This underscores our incomplete understanding of these pathways and the involvement of IRS serine/threonine phosphorylation in insulin action in vivo.
A third mechanism of IR antagonism is caused by lipotoxicity (FIG. 3). Diacylglycerol-dependent activation of protein kinase Cε (PKCε) impairs IR autophosphorylation by phosphorylating Thr1160 in the activation loop of IR35. Indeed, mutant mice in which this phosphorylation site has been mutated are protected against diet-induced impairment of insulin action in liver35 but not in muscle, where the effects of diacylglycerol may instead be mediated by PKCθ36. In addition to diacylglycerol36,37, ceramide accumulation can also impair AKT function by stimulating the activity of PKCζ, which alters membrane localization of AKT, and protein phosphatase 2A (PP2A)38,39, which is described in more detail below.
Lipid phosphatases
The plasma membrane concentrations of the lipid second messenger PtdIns(3,4,5)P3 are controlled not only at the level of synthesis by PI3K but also at the level of localization (see below) and degradation. Two lipid phosphatases are known to dephosphorylate PtdIns(3,4,5)P3 and thereby attenuate downstream insulin signalling: PTEN and SHIP2 (Src homology 2 (SH2)-containing inositol 5′-phosphatase 2)40 (FIG. 3).
PTEN is a 3′-phosphatase that converts PtdIns(3,4,5)P3 into its precursor, PtdIns(4,5)P2, and terminates insulin signalling (FIG. 3d). This molecular function was uncovered in studies of DAF-18, the Caenorhabditis elegans homologue of PTEN40,41. Moreover, PTEN has been long been recognized as a tumour suppressor that is frequently disrupted in human cancers42,43. PTEN inhibition increases AKT activity, thus amplifying not only the effects of insulin on glucose metabolism44–50 but also cell growth and survival pathways42. PTEN haploinsufficiency in humans increases insulin sensitivity and results in weight gain51.
SHIP2 is a 5′-phosphatase that converts PtdIns(3,4,5)P3 into PtdIns(3,4)P2. In vitro studies established that SHIP2 negatively regulates insulin-stimulated rat Akt phosphorylation52. Subsequent in vivo studies demonstrated that knockout of SHIP2 in mice protects against obesity and insulin resistance53–55. Likewise, glycaemia in rodent models of insulin resistance and diabetes has been shown to be improved by liver-specific expression of a dominant-negative form of SHIP2, SHIP knockdown (using antisense oligonucleotides against SHIP2), or a small-molecule SHIP2 inhibitor56–59.
Protein phosphatases
The discovery of the tyrosine kinase activity of IR and IRS triggered a search for tyrosine phosphatases that terminate their activation. However, the nearly 100 members of this gene family do not have selective substrates but appear to be able to dephosphorylate tyrosine residues rather promiscuously; moreover, their activity appears to be constitutive, suggesting that IR and IRS tyrosine phosphorylation is transient. Specificity is probably achieved via subcellular localization and physical proximity. Protein tyrosine phosphatase 1B (PTP1B) negatively regulates insulin signalling by dephosphorylating tyrosine residues on IR and IRS proteins, and PTP1B ablation in mice is associated with increased insulin sensitivity60–62. This phosphatase appears to have a primary effect in the central nervous system63–66, although increased IR and IRS phosphorylation in response to PTP1B depletion was shown in peripheral tissues as well67–69. PTP1B also negatively regulates leptin signalling, by acting on Janus kinase 2 (JAK2). Because the functions of leptin partly overlap with those of insulin, PTP1B (like FOXO1, see below) has the potential to be an integrative node in signal transduction underlying shared biological effects between the two hormones.
Pleckstrin homology domain and leucine-rich repeat protein phosphatase 1α (PHLPP1α), PHLPP1β, and PHLPP2 constitute a distinct family of serine/threonine protein phosphatases70,71 (FIG. 3e). They were first discovered as AKT Ser473 phosphatases72,73, but other substrates include PKC and S6K74,75. PHLPP is involved in two separate negative feedback loops with insulin signalling. First, insulin signalling promotes PHLPP protein translation via mTOR-dependent activation of S6K and eukaryotic translation initiation factor 4E-binding protein 1 (4EBP1)76. Second, insulin signalling stabilizes PHLPP protein. This occurs due to AKT phosphorylation and inhibition of GSK3β, which normally phosphorylates PHLPP, causing it to be degraded77 (FIG. 3e).
Protein phosphatase 2A (PP2A) is another serine/threonine phosphatase that dephosphorylates Akt78. The holoenzyme comprises three subunits: structural, regulatory and catalytic. Because each has multiple isoforms, it has been estimated that 75 different holoenzymes are possible79. Certain components have been specifically linked with negative regulation of insulin signalling80,81. However, in addition to AKT, there are numerous potential targets for PP2A-mediated dephosphorylation. This may underlie the paradoxical worsening of insulin resistance by PP2A inhibitors in mice82.
Pseudosubstrates of the IR kinase
One set of IR signalling inhibitors are the adaptor proteins GRB10 and GRB14 (FIG. 3b). These proteins contain two different domains that each bind to the IR (and the insulin-like growth factor 1 (IGF1) receptor)83. One is a unique peptide region referred to as BPS (between PH and SH2), which binds to the substrate-binding cleft of IR84. The second domain is an SH2 domain, which binds the phosphorylated tyrosine residues on IR85. Thus these GRBs act as pseudosubstrates and obstruct IRS binding and activation. Because the GRB SH2 domain protects IR phosphotyrosines from phosphatases, it potentiates IR phosphorylation, despite the overall function of these proteins as inhibitors86–88. It was recently revealed that GRB10 is part of a negative feedback loop, as it is an IR inhibitor that is stabilized downstream of IR. Using phosphoproteomics, it was found that insulin signalling via Akt and mTOR complex 1 (mTORC1) causes direct phosphorylation of GRB10 ( REFS 89,90). This stabilizes GRB10, thus perpetuating its inhibitory effect on IR (FIG. 3b).
The physiological importance of these proteins is demonstrated by the improved insulin sensitivity seen in mice lacking GRB10, GRB14 or both87,88,91,92. Human genetic studies also link these proteins with insulin signalling. Single nucleotide polymorphisms (SNPs) located within or near GRB10 correlate with glucose levels in the fasted state, glucose tolerance, glucose-stimulated insulin secretion and type 2 diabetes93–97. SNPs near GRB14 are associated with insulin levels, insulin sensitivity and type 2 diabetes93,97–99 as well as adiposity, body fat distribution and body mass index93,100–105.
A second set of IR inhibitory proteins are the SOCS proteins. Four members of this family (SOCS1, SOCS3, SOCS6 and SOCS7) have been shown to attenuate insulin signalling106. There are two mechanisms for this inhibition: one is that a SOCS protein — through its SH2 domain — binds and occupies the phosphotyrosine site of the IR (FIG. 3b), and the second is that a SOCS protein — through its SOCS box domain — recruits a ubiquitin ligase to target IRS proteins for proteasomal degradation106 (FIG. 3c). Consistent with these molecular mechanisms, a body of evidence has suggested that reducing or inhibiting SOCS proteins would benefit insulin sensitivity in vivo106. Deleting SOCS3 specifically in muscle improves insulin signalling and insulin-stimulated glucose disposal during feeding with a high-fat diet107. On the other hand, whole-body deletion of SOCS1 showed a trend towards improved glucose tolerance and was not protective against insulin resistance induced by a high-fat diet108. The latter studies carry the caveat that Socs1−/− mice die within three weeks of birth, and these studies were therefore carried out in mice with a double knockout of Socs1 and a second gene, Rag2, which survive to adulthood109. On balance, most studies indicate a role for SOCS proteins in the termination of insulin signalling, and further investigation will clarify the pathophysiological effects of this pathway.
An interesting counterpoint to these inhibitory pseudosubstrates is provided by SH2B1, which instead enhances insulin signalling83,110. This protein binds IR phosphotyrosine residues through its SH2 domain, thus protecting these IR residues from dephosphorylation. However, SH2B1 does not block the active site of the IR kinase, thus potentiating insulin signalling83,110 (FIG. 3). The role of this protein in insulin signalling in vivo has been confirmed by studies in flies and mice deficient in SH2B1, which demonstrate impaired glucose metabolism and blunted insulin signalling in muscle, liver and fat111,112. Notably, the mouse studies were carried out in mice that lack SH2B1 in peripheral tissues but retain its expression in neurons, as this protein also impacts body weight by modulating leptin signalling83,110. These pathways are validated by human genetic studies showing associations of SH2B1 polymorphisms with obesity and insulin resistance113–120, although some findings indicate the gene is not directly linked with abnormal glucose homeostasis121.
Isoform specificity
Studies in humans, mice, and cell culture indicate that individual isoforms of the proteins involved in insulin signalling — and termination of insulin signalling — function distinctly. These findings support a combinatorial model of insulin signalling, whereby a single hormone can lead to a remarkable spectrum of consequences. This model has been previously reviewed10, and here, we highlight new findings.
IR
The IR itself has two isoforms, A and B. The latter is generated by alternative splicing and contains an additional exon encoding 11 amino acids122. IR-A is notable because it has comparable affinities for insulin and IGF-II. There appear to be small differences in the signalling properties of the two isoforms, such that IR-A is stronger than IR-B in its metabolic effects123 and in promoting glycogen synthesis124. In our view, IR-A functions primarily as a growth-promoting isoform during foetal life, whereas the apparent lower potency of IR-B, the predominant isoform in adult liver125, is intended to reduce hepatocyte sensitivity to insulin, in view of the fact that liver cells are exposed to the high insulin concentrations of the portal vein.
IRS
There are four isoforms of IRS in mammals, although humans lack IRS3 ( REF. 126). The isoforms differ with respect to tissue distribution and ability to engage a diverse subset of cellular substrates. Thus, the pleiotropy of insulin action can be explained by the ability of these adaptors to engage different cellular pathways. IRS1 and IRS2 are the main isoforms involved in metabolic homeostasis18. In the liver, ablation of IRS1 and IRS2 ( REFS 127,128) phenocopies IR knockout, providing evidence that they are the main transducers of the insulin signal129. Likewise, IRS1 and IRS2 double knockout in muscle impairs cellular metabolism as well as muscle growth130, similar to double knockouts of IR and IFG1R in muscle131. In contrast to the overlapping cellular functions of IRS1 and IRS2, there are differences in their in vivo functions. Generalized ablation of IRS1 results in growth retardation and skeletal muscle insulin resistance, whereas IRS2 knockouts have strain-specific β-cell failure10.
Intensive investigation of the differences in the functions of these two IRS isoforms in the liver has been carried out over the past decade. Hepatocyte-specific knockout of either IRS1 or IRS2 caused moderate defects in glucose metabolism, with some evidence suggesting IRS1 is slightly more valuable for maintaining hepatic metabolism127,128,132,133. There may also be temporal (fasting versus postprandial)128 or spatial (pericentral versus periportal)134 elements that lend specificity to IRS pathways, and those will be discussed in depth below.
AKT
There are three isoforms of AKT (1–3), and each may have some distinct effects135–138. Although the two major forms of AKT (1 and 2) are not redundant in vivo — as shown by the relevant knockouts — in cells that express both, there appear to be two factors determining the specificity of insulin signalling: their relative abundance as well as their intracellular localization. A body of evidence has suggested that AKT2 is the most important isoform for glucose homeostasis, whereas AKT1 is important for growth and AKT3 for brain development137. Indeed, mice lacking Akt2 display impaired glucose homeostasis, while those lacking Akt1 or Akt3 do not137. This was supported by in vitro evidence demonstrating a specific mechanism whereby AKT2 is specifically capable of promoting GLUT4 translocation, because it is enriched at the plasma membrane in response to insulin, an effect that is not seen for AKT1 ( REFS 139,140). These findings emphasized the importance of the subcellular localization of insulin signalling components, and in-depth discussion about the spatial organization is provided below. However, advancements in research tools have allowed a reappraisal of the selectivity of AKT2 in glucose metabolism141. New data demonstrate that GLUT4 translocation is maintained after selective, acute inhibition of the kinase activity of either AKT1 or AKT2 ( REF. 142). This suggests that either isoform is sufficient and that prior results were due to effects of long-term AKT2 depletion, independent of catalytic activity. On the other hand, there was a specific requirement for AKT1 in adipogenesis142, thus confirming that isoform specificity is important for some AKT functions.
Temporal regulation
Individual cellular effects of insulin occur with distinct temporal dynamics. These different dynamics depend on the kinetics of insulin secretion, the dynamic expression of insulin signalling proteins, the kinetics of kinase activities downstream of IR and the sensitivity of transcriptional mediators to insulin signalling. Therefore, different biological effects of IR signalling occur at different times after initiation of insulin signalling.
Dynamics of insulin secretion
Although the pattern of insulin secretion falls outside the scope of this review, IR signalling cannot be properly understood without considering that different biological responses by different insulin target cells are also the result of how insulin is released into the bloodstream143. In the post-absorptive state, insulin is released — like most hormones — in pulses144. In this state, insulin is important for maintaining active protein synthesis, preventing protein degradation and suppressing free fatty acid secretion, which might adversely affect hepatic glucose production145. In anticipation of (cephalic phase) and in response to a meal, insulin is secreted in characteristic multi-phasic patterns. Glucose uptake in muscle and fat is likely the earliest response to a rise in plasma insulin, followed by suppression of hepatic glucose production and stimulation of lipogenesis. These dynamics become profoundly altered in insulin resistance and diabetes.
Abundance of insulin signalling proteins
Insulin exerts homeostatic control over its own signalling pathway, turning it down when it is less needed (fasting), and amplifying it in response to nutrient influx. The IRS proteins provide an example. While IRS1 is expressed at a relatively consistent level, IRS2 is most abundant during fasting — because of transcriptional activation by FOXOs — and its levels are decreased by insulin146–148. The importance of this in vivo was highlighted by studies showing that IRS2 carries out insulin signalling mainly during fasting and immediately after feeding, whereas IRS1 does so mainly in the fed state128. Similarly, fasting induces FOXO expression in the liver, contributing to the termination of insulin action, while it decreases expression of the sterol regulatory element binding protein 1c (SREBP1c), resulting in inhibition of lipid synthesis.
Phosphorylation in response to insulin
The sequential phosphorylation of downstream targets is a cornerstone of insulin signalling (FIG. 4). The temporal dynamics of these sequences lends precision to phosphorylation-dependent protein interactions149. Thus, the signalling to entire networks downstream of insulin is conceivably determined by the timing of such phosphorylation events150.
Figure 4. Temporal regulation of insulin signalling.
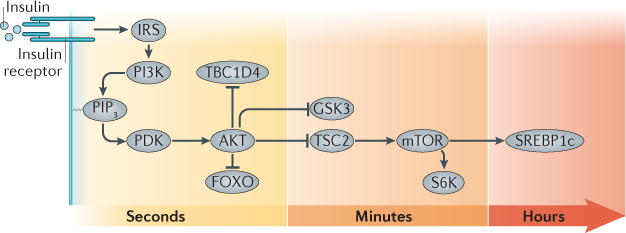
The transmission of the insulin receptor (IR) signal to its various mediators occurs over varying lengths of time, from seconds (AKT, TBC1D4 and FOXO), to minutes (GSK3, TSC2, mTOR and S6K), to hours (SREBP1c). FOXO, forkhead family box O; GSK3, glycogen synthase kinase 3; IRS, IR substrate; PDK, phosphoinositide-dependent kinase; PIP3, PtdIns(3,4,5)P3; S6K, ribosomal protein S6 kinase; SREBP1c, sterol regulatory element binding protein 1c; TBC1D4, TBC1 domain family member 4; TSC2, tuberous sclerosis 2.
Phosphoproteomic analyses have demonstrated tyrosine phosphorylation of dozens of proteins in response to insulin151–154. As expected, tyrosine phosphorylation of IR and IRS proteins occurs within 1 minute of insulin treatment. Other downstream targets cluster into subcategories in which tyrosine phosphorylation is delayed, even by up to 45 minutes. Likewise, many sites remain phosphorylated over long periods, whereas others are transient. IRS1 provides an interesting example, as it has multiple phosphotyrosine sites, which display a range of different temporal patterns153,154. Furthermore, there appear to be cell type-specific differences in the timing of IRS1 tyrosine phosphorylation151–154.
In contrast to phosphotyrosine sites, the vast majority of insulin-regulated phosphorylation events are on serine residues. In 3T3-L1 adipocytes, the percentages have been quantified as 87.8% phosphoserine, 11.4% phosphothreonine and 0.8% phosphotyrosine153. The serine and threonine sites regulated by insulin number in the thousands, and they can be subdivided into multiple clusters based on shared kinetics. For example, phosphorylation of Akt Thr308 occurs within 15 seconds and stabilizes, whereas that of Ser473 follows, peaking after one or more minutes153,154. These specific temporal patterns of phosphorylation may underlie the differential responsiveness of each insulin signalling pathway.
Glucose uptake
The stimulation of cellular glucose uptake was one of the first recognized biological activities of insulin (FIG. 5a). Although insulin stimulates glucose uptake into many cell types, it has most pronounced effects on adipocytes and muscle cells, enhancing glucose uptake by approximately tenfold and fivefold, respectively155. The phenomenon was first described in detail in studies of primary rat adipocytes. Insulin stimulated glucose uptake, reaching a plateau approximately ten times higher than that of unstimulated levels, within 15 minutes156,157. The increased rate of glucose uptake was maintained with the continued presence of insulin, and it rapidly returned to pre-stimulated levels once insulin was removed. Cells responded similarly to a second challenge of insulin. Once the glucose transporters had been identified, it could be shown that insulin controls glucose uptake by controlling the density of glucose transporters in the plasma membrane rather than by gating the transporters’ activity158,159. Adipocytes and myotubes express GLUT4, a member of the GLUT family of facilitative glucose transporters, and regulation of GLUT4 trafficking to and from the plasma membrane underlies insulin regulation of glucose uptake into these cells.
Figure 5. Spatial regulation of insulin signalling.
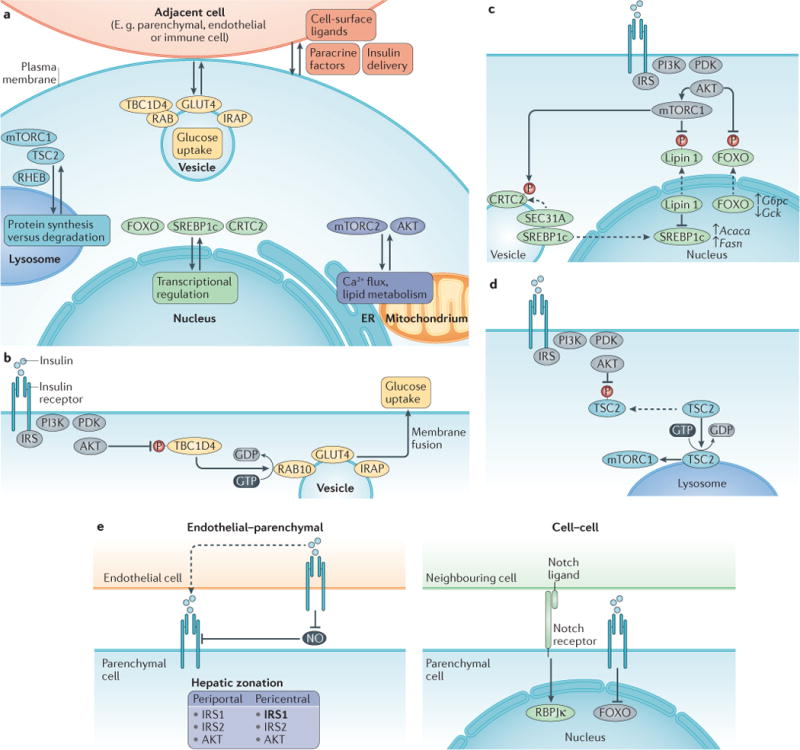
a| Overview of the compartmentalization of the downstream targets of insulin signalling is a mode of regulation. Recent findings have uncovered the importance of lysosomal localization for mTOR complex 1 (mTORC1) activation, the endoplasmic reticulum (ER) and/or mitochondria-associated ER membrane (MAM) for calcium flux and lipid metabolism, the nucleus for transcriptional control of metabolic processes and vesicle trafficking for the regulation of glucose uptake. Cell–cell interactions also contribute to insulin signalling regulation by modulating insulin delivery, paracrine factors and cell surface ligands. Detailed mechanisms focused on key targets of insulin signalling are shown in panels b–d. b | Glucose uptake. TBC1 domain family member 4 (TBC1D4) is a RABGAP that typically stimulates the conversion of active RAB-GTP into inactive RAB-GDP. AKT phosphorylates and inactivates TBC1D4, which allows active RAB to promote the movement of GLUT4-containing vesicles to the cell surface. c | Transcriptional effects. Forkhead family box O (FOXO) transcription factors are phosphorylated by AKT, causing their nuclear exclusion and inactivation. Sterol regulatory element binding protein 1c (SREBP1c) is activated downstream of mTORC1 through two mechanisms. Nuclear lipin 1 causes nuclear remodelling that reduces nuclear SREBP1c; AKT phosphorylates and inhibits lipin 1. SEC31A is a vesicle transport protein that interacts with the transcription factor CREB-regulated co-activator 2 (CRTC2). After mTOR phosphorylates CRTC2, SEC31A becomes available to instead bind and transport SREBP1c to the nucleus. d | Lysosomal regulation of protein synthesis and degradation. TSC2 promotes the inactive, GDP-bound form of the lysosomally localized protein RHEB. AKT phosphorylates tuberous sclerosis 2 (TSC2), causing its dissociation from the lysosome, thus allowing RHEB to activate its target, mTORC1. e | Tissue microenvironment and cell–cell interactions. Endothelial cells influence parenchymal cell insulin signalling by physically delivering insulin through transcytosis and by suppressing the production of detrimental nitric oxide (NO). Insulin receptor substrate 1 (IRS1) is preferentially expressed in pericentral hepatic cells, as indicated in bold. Notch receptor is activated by a ligand expressed in an adjacent cell. It affects insulin signalling, as its target transcription factor recombining binding protein suppressor of hairless κ (RBPJκ) interacts with FOXO proteins at gene promoters. IRAP, insulin-regulated aminopeptidase.
Insulin signal transduction intersects GLUT4 trafficking at a number of steps, including the biogenesis of vesicles that ferry GLUT4 to the plasma membrane, docking and fusion with the plasma membrane160,161. These steps occur downstream of AKT activation. However, different effectors control different aspects of GLUT4 trafficking. The best described AKT substrate required for GLUT4 translocation is TBC1 domain family member 4 (TBC1D4; also known as AS160), a RABGAP162,163. AKT phosphorylation of TBC1D4 functionally inactivates its GTPase-activating protein (GAP) activity, resulting in the activation of RAB proteins targeted by TBC1D4 ( REFS 161,164,165) (FIG. 5b). In muscle cells, the primary isoform is RAB8a166. In fat cells, it is RAB10, which is responsible for about half of the effect of insulin on GLUT4 ( REFS 167,168). RAB10 functions at a step before vesicle docking, and recent evidence suggests it is involved in the biogenesis of GLUT4-containing transport vesicles169. Thus, insulin signalling to GLUT4 that is independent of TBC1D4–RAB10 likely targets vesicle docking and fusion. Those effectors are yet to be discovered. Recently, a role for TBK1 kinase regulation of the exocyst in the docking and/or fusion of GLUT4-containing vesicle with the plasma membrane has been reported170.
Transcriptional effects of insulin
The effects of insulin are mediated by several transcription factors, including FOXO, SREBP1c, CREB-regulated transcription co-activator 2 (CRTC2) and CREB binding protein (CBP)/p300-interacting transactivator 2 (CITED2). In vivo, evidence for a role of FOXO and SREBP1c is compelling. During fasting, hepatic FOXOs promote the expression of glucose-6-phosphatase and suppress that of glucokinase, thereby promoting net glucose output171–174. Inactivation of FOXOs by insulin reverses these effects (FIG. 5c). In addition, FOXOs mediate the effects of insulin on adipocyte differentiation, neuropeptide transcription and processing, and β-cell health175–179. SREBP1c promotes expression of the enzymes involved in fatty acid synthesis180,181. Unlike FOXO, SREBP1c is activated by insulin both transcriptionally and post-translationally, wherein SREBP1c is processed to its mature form and translocates to the nucleus182–185 (FIG. 5c). The pathways of insulin signalling that regulate FOXOs and SREBP1c diverge, such that SREBP1c regulation is downstream of mTOR186, whereas FOXOs are direct targets of AKT187–189.
There are also substantial temporal differences in the effects of insulin on FOXO compared with those on SREBP1c. FOXOs are exquisitely and immediately sensitive to insulin, reaching maximal phosphorylation in the liver within 30 seconds of insulin administration in vivo and within 1 minute of insulin treatment in 3T3-L1 adipocytes in vitro153,154. In fact, the peak of FOXO phosphorylation precedes peak activation of AKT154. Consequently, the effects of inactivating FOXO to reduce glucose-6-phosphatase and increase glucokinase occur rapidly174. Conversely, SREBP1c activation occurs later and requires higher insulin doses. The increases in SREBP1c mRNA and in the mature form of SREBP1c protein peak approximately 12 hours after feeding190,191. Accordingly, the transcriptional targets of SREBP1c also increase several hours after feeding174,192,193. The slow increase in SREBP1c levels is consistent with SREBP1c maturation being downstream of mTOR182, one of the slower targets of insulin to be activated (minutes)153. Though considering that SREBP1c is slower yet (hours), the molecular links between mTOR and SREBP1c may lend additional temporal control. One such link is the phosphatidic acid phosphatase lipin 1, which reduces nuclear SREBP1c194. mTORC1 phosphorylates lipin 1, leading to the nuclear exclusion of lipin 1 and the accumulation of nuclear SREBP1c (FIG. 5c). A second link is CRTC2, which competes with SREBP1c for binding to SEC31A, a component of the COPII complex195. Phosphorylation of CRTC2 by mTOR causes it to dissociate from Sec31A, thus enabling the trafficking and activation of SREBP1c (FIG. 5c). Thus, in addition to the bifurcation of insulin signalling to these two transcription factors, the temporal regulation of these two pathways plays a crucial role in insulin action.
Subcellular spatial regulation
Components of the IR pathway must colocalize in order to transmit downstream signalling. Archetypical examples of this are the recruitment of IRS, PI3K, PDK1, AKT and their cognate phosphatases to the plasma membrane for activation and inactivation, respectively. However, downstream of AKT, there are multiple subcellular sites at which IR signalling targets localize (FIG. 5).
Trafficking vesicles
After ligand binding, IR is internalized via clathrin-coated vesicles. From their location in endosomes, the IR kinase remains active for signalling, and downstream targets have been found to colocalize to these early endosomes196,197. Evidence suggests that endosomal IR signalling is important for mitogenic but not for metabolic effects of IR196. However, because insulin is a weak mitogen, the extent to which the mitogenic effects are the result of IR signalling as opposed to IGF1 receptor signalling remains conjectural198. However, a second aspect of IR trafficking in vesicles that can affect metabolic signalling is the fate of the IR for recycling versus degradation. Recently, it was shown that the protein SORLA (sorting-related receptor with type A repeats, encoded by SORL1) directs the recycling of internalized IR back to the cell surface, thereby enhancing IR signalling199. This may provide a molecular mechanism for the association of SNPs near SORL1 with obesity traits200,201.
A canonical target of insulin signalling that requires spatial regulation in trafficking vesicles is GLUT4. In unstimulated cells, GLUT4 is sequestered intracellularly. Insulin signalling induces its redistribution to the plasma membrane, increasing glucose uptake158,159. Upon cessation of signalling, GLUT4 is retrieved from the plasma membrane, returning to the intracellular storage sites, poised to be re-recruited to the plasma membrane by another round of insulin signalling157,158 (FIG. 5b). Thus, the control of glucose flux, in both unstimulated and insulin-stimulated fat and muscle cells, requires the activities of a large number of proteins that make the GLUT4 transport vesicles and regulate the fusion of the vesicles with the plasma membrane. This is one of the best characterized examples of regulation of biological activity by controlled compartmentalization.
Insulin stimulation of glucose uptake is most pronounced in fat and muscle cells, although insulin promotes a small (less than twofold) uptake into many cell types. This specialization is fat and muscle cell dependent. Ectopic expression of GLUT4 in other cell types does not by itself recapitulate its insulin-dependent translocation to the plasma membrane characteristic of fat and muscle cells202. Insulin does not modify GLUT4 directly; instead, it acts on the trafficking pathway that transports GLUT4 to the plasma membrane. The insulin-regulated aminopeptidase (IRAP) is also translocated to the plasma membrane, with GLUT4 ( REF. 203). IRAP is a component of vesicles that ferry GLUT4 to the plasma membrane, but it does not have a major role in glucose homeostasis204. Moreover, GLUT4-containing vesicles have not been reported to contain soluble proteins that are secreted concurrent with GLUT4 insertion into the membrane, suggesting that insulin-regulated trafficking of membrane proteins is restricted to a remodelling of the plasma membrane rather than being coupled to adipokine secretion. Overall, insulin control of GLUT4 translocation is a prime example of the regulation of insulin effects through compartmentalization, as well as of tyrosine kinase-dependent regulation of membrane trafficking.
Nuclear actions of insulin
The discovery that insulin causes the AKT-dependent nuclear exclusion of FOXOs shifted the focus on insulin signalling from the membrane to the nucleus. This mechanism is neither unique to FOXO nor unidirectional. The insulin-stimulated translocation of mature SREBP1c to the nucleus is one example. Another is the CREB co-activator CRTC2, which is phosphorylated by SIK2, an AKT substrate, and excluded from the nucleus205,206 (FIG. 5c).
FOXO subcellular localization is regulated by other signalling pathways that either function in conjunction with insulin to promote the nuclear exclusion of FOXOs, or counteract it. Fasting and glucagon207, cytokine- and other stress-activated pathways208,209 promote the import of FOXOS into the nucleus from the cytoplasm. Moreover, other nutritional cues can complement — or compete with — insulin and glucagon to influence FOXO localization through mechanisms other than phosphorylation. Oxidative stress causes FOXO deacetylation, which promotes nuclear retention and activation of FOXOs but also promotes rapid ubiquitylation and degradation179,210. On the other hand, acetylation sensitizes FOXOs to insulin-induced phosphorylation while increasing stability179,211. These modifications influence FOXO activity in multiple cell types including β-cells, hepatocytes, macrophages and endothelial cells179,212–214.
Lysosome
The lysosome, where mTORC1 is activated215, has emerged as an important site of cellular insulin signalling (FIG. 5d). mTORC1 translocates to the lysosome in response to amino acids, a process that is mediated by a protein complex termed the Ragulator216. At the lysosomal membrane, mTORC1 interacts with its activator, RHEB. However, mTORC1 activation by RHEB only proceeds if insulin signalling is also activated. This is because in the absence of insulin signalling, RHEB is kept in its GDP-bound, inactive state by the GTPase-activating TSC protein complex217. Following insulin stimulation, AKT phosphorylates and inactivates TSC2 ( REFS 218,219). Recent work demonstrates that AKT-mediated phosphorylation causes TSC2 to dissociate from the lysosome220. This stabilizes the GTP-bound, active form of RHEB, thus activating mTORC1. These findings demonstrate spatial coordination of multiple signalling proteins at the lysosome as a mechanism to tightly control mTORC1 activation in response to both hormonal (insulin) and nutritional (amino acid) cues.
Regulation at endoplasmic reticulum–mitochondria contact sites
Mitochondria-associated endoplasmic reticulum membranes (MAMs) are endoplasmic reticulum membrane subdomains that interact physically with mitochondria. This juxtaposition facilitates the transfer of calcium and lipids between the two organelles and is thus considered a site where signalling pathways — particularly those relying on calcium flux — intersect with energy and lipid metabolism pathways221.
Recent evidence suggests that MAMs are an important target site for insulin signalling222. AKT and mTORC2 — the kinase complex that is responsible for carrying out the Ser473 phosphorylation of AKT — are localized to MAMs, and this localization is increased with insulin signalling223–226. Evidence suggests that the localization of mTORC2 and of AKT-pS473 to MAMs contributes to the regulation of MAM function and calcium flux224. Conversely, the integrity of the MAMs contributes to insulin signalling, as disruption of MAMs dampens insulin signalling and impairs glucose homeostasis225,227. Moreover, overabundance of MAMs worsens insulin signalling and glucose metabolism228. These findings indicate that the formation and number of MAMs both affect and are affected by insulin signalling in multiple ways.
Tissue microenvironment
In addition to the subcellular organization of IR targets, the spatial distribution of cells within a tissue can also impact insulin signalling (FIG. 5e). There are many neuronal, hormonal and metabolic signals that link distant tissues and affect insulin signalling, which are outside the scope of this review. Instead, this section will focus on the local effects of neighbouring cells within the same tissue. A seminal demonstration that neighbouring cells can affect insulin signalling is provided by the infiltration of macrophages into the adipose tissue during obesity, which can initiate inflammatory pathways that impair insulin signalling30–32. Other cell–cell interactions that affect insulin signalling occur between the same or different cell types. This section highlights that insulin action in a given cell can be influenced by its spatial positioning in a tissue, via paracrine effects or differences in nutrient and/or hormone access.
Hepatic zonation
Hepatocytes are arranged in zones, described by their proximity to the portal vein (rich with nutrients and oxygen) or the central vein (relatively deprived of nutrients and oxygen). It has long been known that certain metabolic pathways are preferentially localized to different zones, and interconnected pathways are localized together. Fatty acid oxidation and gluconeogenesis are localized to periportal hepatocytes, whereas glycolysis and fatty acid synthesis are localized to pericentral hepatocytes229. Recently, it was reported that while IR, IRS2 and AKT are equally distributed, IRS1 is twice as abundant in pericentral hepatocytes as in periportal hepatocytes134. This may cause IRS1 to be preferentially involved in glycolytic and lipogenic pathways, potentially providing another layer of specificity for coordinated regulation of metabolic pathways.
Endothelial–parenchymal cell interactions
A neighbouring non-parenchymal cell type that can impact parenchymal cell insulin signalling is endothelial cells. One potential mechanism for this lies in their role in delivering insulin from plasma into the interstitium. This can occur through regulation of blood flow and through the transcytosis of insulin across the endothelium230,231. The latter is thought to be rate-limiting for insulin delivery into tissues such as muscle and adipose tissue, where capillaries are lined with continuous endothelial cells230. However, the mechanisms of insulin delivery remain unclear. In vitro evidence suggests that the transcytosis is mediated by IR in endothelial cells232,233. However, mice lacking IR specifically in endothelial cells maintain normal insulin sensitivity unless placed on a low-salt diet234. This finding is unexpected, but may be explained by the preservation of IGF1R in these mice. On the other hand, mice lacking IRS2 — or both IRS1 and IRS2 — in endothelial cells are insulin resistant, with impaired muscle glucose uptake235. This is due to poor insulin-stimulated capillary recruitment and insulin delivery to the interstitium, resulting in reduced AKT activation.
A second potential mechanism involves paracrine factors secreted from the endothelial cells that affect insulin signalling in parenchymal cells. Mice lacking FOXOs in endothelial cells display insulin resistance and impaired insulin signalling in hepatocytes236. This is associated with excessive release of nitric oxide from liver sinusoidal endothelial cells and concomitant tyrosine nitration of IR in hepatocytes. This highlights how insulin signalling in one cell type can influence insulin signalling in an adjacent cell type.
Other cell–cell interactions
Additional cell–cell interactions in the tissue microenvironment may also impact insulin signalling. One example is the unexpected finding that NOTCH receptors — best known for their role in development — are negative regulators of insulin signalling in mature cells237,238. Notch receptors on the surface of a cell are activated by the binding of transmembrane protein ligands that are expressed on the surface of an adjacent cell239. This causes the intracellular domain of NOTCH to become cleaved and transported to the nucleus where it binds to the transcription factor recombining binding protein suppressor of hairless κ (RBPJκ) and regulates gene expression. Mice that are heterozygous for NOTCH, or that lack RBPJκ specifically in hepatocytes, have enhanced insulin signalling in liver including elevated AKT phosphorylation and improved suppression of hepatic glucose production237. This pathway is confirmed to be downstream of signalling from an adjacent cell, as expressing only the extracellular domain of NOTCH — which sequesters endogenous ligands on adjacent cells — is sufficient to invoke the pathway and enhance AKT phosphorylation at Thr308 ( REF. 238).
Conclusions and perspectives
As we approach the 100th anniversary of the discovery of insulin, the signalling pathways of this important hormone have largely been defined. Although there will always be gaps in our understanding, progress has been substantial. However, we should acknowledge the limits of a reductionist cellular and biochemical approach to insulin signalling. In the living organism, the integrated signals arising from insulin’s pleiotropic actions in multiple tissues cannot be easily reconciled with intrinsic cellular pathways — to wit, the complexity of distinguishing between direct effects of insulin in the liver from indirect effects caused by substrate redistribution in other organs171,240. A second conclusion relates to the clinical implications of these discoveries. The heterogeneity of insulin signalling has thus far defeated approaches to discover clinically useful insulin sensitizers: turning on the main path through IR, IRS, PI3K, AKT is fraught with risks, while turning off antagonistic signals, such as FOXO or the many serine/threonine kinase or phosphatases, appears unlikely to succeed in view of the built-in redundancy of these systems. Nonetheless, the body of knowledge developed in this field will probably contribute to the solution of the clinical problem of insulin resistance in its various clinical manifestations.
Acknowledgments
The authors thank U. Pajvani and R. Leibel for stimulating discussions and helpful comments. Supported by NIH grants DK57539, DK64819, DK58282, HL81723, DK52852 and HL125649.
Glossary
- Anorexigenic
Appetite-suppressant
- Paracrine
A mechanism by which neighbouring cells influence each other by way of a secreted factor
- Diacylglycerol
A glycerol molecule with two fatty acid chains present in food or produced primarily in the liver, adipose tissue and intestine, diacylglycerol is best known for its signalling properties to activate protein kinase C but also functions as a precursor molecule in the synthesis of triglycerides and prostaglandins
- Haploinsufficiency
A phenotype caused by a heterozygous loss-of-function mutation, or by a mutation partly affecting levels and/or activity of a gene product
- Post-absorptive state
The state following food absorption by the gut, hence the fasting state
- RABGAP
A protein activating the GTPase activity of RAB, a component of secretory vesicles involved in intracellular transport
- Exocyst
An octamer assembled to promote intracellular vesicle transport
- COPII complex
A complex of proteins assembled around coat protein II (COPII), required for anterograde transport from the endoplasmic reticulum to the Golgi
- Transcytocis
The transport of proteins across the interior of a cell
Footnotes
Author contributions
R.A.H., T.E.M. and D.A. researched data for the article, contributed to discussion of the content, wrote the article and reviewed and/or edited the manuscript before submission.
Competing interests statement
The authors declare no competing interests.
Publisher’s note
Springer Nature remains neutral with regard to jurisdictional claims in published maps and institutional affiliations.
References
- 1.Banting FG, Best CH, Collip JB, Campbell WR, Fletcher AA. Pancreatic extracts in the treatment of diabetes mellitus. Can Med Assoc J. 1922;12:141–146. [PMC free article] [PubMed] [Google Scholar]
- 2.Levine R, Goldstein MS, Huddlestun B, Klein SP. Action of insulin on the ‘permeability’ of cells to free hexoses, as studied by its effect on the distribution of galactose. Am J Physiol. 1950;163:70–76. doi: 10.1152/ajplegacy.1950.163.1.70. [DOI] [PubMed] [Google Scholar]
- 3.Freychet P, Roth J, Neville DM., Jr Insulin receptors in the liver: specific binding of (125 I)insulin to the plasma membrane and its relation to insulin bioactivity. Proc Natl Acad Sci USA. 1971;68:1833–1837. doi: 10.1073/pnas.68.8.1833. [DOI] [PMC free article] [PubMed] [Google Scholar]
- 4.Kasuga M, Zick Y, Blithe DL, Crettaz M, Kahn CR. Insulin stimulates tyrosine phosphorylation of the insulin receptor in a cell-free system. Nature. 1982;298:667–669. doi: 10.1038/298667a0. [DOI] [PubMed] [Google Scholar]
- 5.Ebina Y, et al. The human insulin receptor cDNA: the structural basis for hormone-activated transmembrane signalling. Cell. 1985;40:747–758. doi: 10.1016/0092-8674(85)90334-4. [DOI] [PubMed] [Google Scholar]
- 6.Ullrich A, et al. Human insulin receptor and its relationship to the tyrosine kinase family of oncogenes. Nature. 1985;313:756–761. doi: 10.1038/313756a0. [DOI] [PubMed] [Google Scholar]
- 7.Sun XJ, et al. Structure of the insulin receptor substrate IRS-1 defines a unique signal transduction protein. Nature. 1991;352:73–77. doi: 10.1038/352073a0. [DOI] [PubMed] [Google Scholar]
- 8.Kohn AD, Kovacina KS, Roth RA. Insulin stimulates the kinase activity of RAC-PK, a pleckstrin homology domain containing ser/thr kinase. EMBO J. 1995;14:4288–4295. doi: 10.1002/j.1460-2075.1995.tb00103.x. [DOI] [PMC free article] [PubMed] [Google Scholar]
- 9.Gehart H, Kumpf S, Ittner A, Ricci R. MAPK signalling in cellular metabolism: stress or wellness? EMBO Rep. 2010;11:834–840. doi: 10.1038/embor.2010.160. [DOI] [PMC free article] [PubMed] [Google Scholar]
- 10.Taniguchi CM, Emanuelli B, Kahn CR. Critical nodes in signalling pathways: insights into insulin action. Nat Rev Mol Cell Biol. 2006;7:85–96. doi: 10.1038/nrm1837. [DOI] [PubMed] [Google Scholar]
- 11.Kim YB, Nikoulina SE, Ciaraldi TP, Henry RR, Kahn BB. Normal insulin-dependent activation of Akt/protein kinase B, with diminished activation of phosphoinositide 3-kinase, in muscle in type 2 diabetes. J Clin Invest. 1999;104:733–741. doi: 10.1172/JCI6928. [DOI] [PMC free article] [PubMed] [Google Scholar]
- 12.Nadler ST, et al. Normal Akt/PKB with reduced PI3K activation in insulin-resistant mice. Am J Physiol Endocrinol Metab. 2001;281:E1249–E1254. doi: 10.1152/ajpendo.2001.281.6.E1249. [DOI] [PubMed] [Google Scholar]
- 13.Cleasby ME, Reinten TA, Cooney GJ, James DE, Kraegen EW. Functional studies of Akt isoform specificity in skeletal muscle in vivo; maintained insulin sensitivity despite reduced insulin receptor substrate-1 expression. Mol Endocrinol. 2007;21:215–228. doi: 10.1210/me.2006-0154. [DOI] [PubMed] [Google Scholar]
- 14.Hoehn KL, et al. IRS1-independent defects define major nodes of insulin resistance. Cell Metab. 2008;7:421–433. doi: 10.1016/j.cmet.2008.04.005. [DOI] [PMC free article] [PubMed] [Google Scholar]
- 15.Kang S, et al. Identification of nuclear hormone receptor pathways causing insulin resistance by transcriptional and epigenomic analysis. Nat Cell Biol. 2015;17:44–56. doi: 10.1038/ncb3080. [DOI] [PMC free article] [PubMed] [Google Scholar]
- 16.Odegaard JI, Chawla A. Pleiotropic actions of insulin resistance and inflammation in metabolic homeostasis. Science. 2013;339:172–177. doi: 10.1126/science.1230721. [DOI] [PMC free article] [PubMed] [Google Scholar]
- 17.Ortega-Molina A, et al. Pharmacological inhibition of PI3K reduces adiposity and metabolic syndrome in obese mice and rhesus monkeys. Cell Metab. 2015;21:558–570. doi: 10.1016/j.cmet.2015.02.017. [DOI] [PMC free article] [PubMed] [Google Scholar]
- 18.Boucher J, Kleinridders A, Kahn CR. Insulin receptor signaling in normal and insulin-resistant states. Cold Spring Harb Perspect Biol. 2014;6:a009191. doi: 10.1101/cshperspect.a009191. [DOI] [PMC free article] [PubMed] [Google Scholar]
- 19.Könner AC, Brüning Jens C. Selective insulin and leptin resistance in metabolic disorders. Cell Metab. 16:144–152. doi: 10.1016/j.cmet.2012.07.004. [DOI] [PubMed] [Google Scholar]
- 20.Czech MP. Insulin action and resistance in obesity and type 2 diabetes. Nat Med. 2017;23:804–814. doi: 10.1038/nm.4350. This perspective highlights recent controversies and challenges in understanding the effects of obesity on insulin signalling. [DOI] [PMC free article] [PubMed] [Google Scholar]
- 21.Gavin JR, et al. Insulin-dependent regulation of insulin receptor concentrations: a direct demonstration in cell culture. Proc Natl Acad Sci USA. 1974;71:84–88. doi: 10.1073/pnas.71.1.84. [DOI] [PMC free article] [PubMed] [Google Scholar]
- 22.Backer JM, Kahn CR, Cahill DA, Ullrich A, White MF. Receptor-mediated internalization of insulin requires a 12-amino acid sequence in the juxtamembrane region of the insulin receptor β-subunit. J Biol Chem. 1990;265:16450–16454. [PubMed] [Google Scholar]
- 23.Kolterman OG, Saekow M, Olefsky JM. The effects of acute and chronic starvation on insulin binding to isolated human adipocytes. J Clin Endocrinol Metabolism. 1979;48:836–842. doi: 10.1210/jcem-48-5-836. [DOI] [PubMed] [Google Scholar]
- 24.Copps KD, White MF. Regulation of insulin sensitivity by serine/threonine phosphorylation of insulin receptor substrate proteins IRS1 and IRS2. Diabetologia. 2012;55:2565–2582. doi: 10.1007/s00125-012-2644-8. [DOI] [PMC free article] [PubMed] [Google Scholar]
- 25.Shah OJ, Wang Z, Hunter T. Inappropriate activation of the TSC/Rheb/mTOR/S6K cassette induces IRS1/2 depletion, insulin resistance, and cell survival deficiencies. Curr Biol. 2004;14:1650–1656. doi: 10.1016/j.cub.2004.08.026. [DOI] [PubMed] [Google Scholar]
- 26.Harrington LS, et al. The TSC1-2 tumor suppressor controls insulin-PI3K signaling via regulation of IRS proteins. J Cell Biol. 2004;166:213–223. doi: 10.1083/jcb.200403069. [DOI] [PMC free article] [PubMed] [Google Scholar]
- 27.Um SH, et al. Absence of S6K1 protects against age- and diet-induced obesity while enhancing insulin sensitivity. Nature. 2004;431:200–205. doi: 10.1038/nature02866. [DOI] [PubMed] [Google Scholar]
- 28.Copps KD, Hançer NJ, Qiu W, White MF. Serine 302 phosphorylation of mouse insulin receptor substrate 1 (IRS1) is dispensable for normal insulin signaling and feedback regulation by hepatic S6 kinase. J Biol Chem. 2016;291:8602–8617. doi: 10.1074/jbc.M116.714915. [DOI] [PMC free article] [PubMed] [Google Scholar]
- 29.Hotamisligil GS, Shargill NS, Spiegelman BM. Adipose expression of tumor necrosis factor-alpha: direct role in obesity-linked insulin resistance. Science. 1993;259:87–91. doi: 10.1126/science.7678183. [DOI] [PubMed] [Google Scholar]
- 30.Weisberg SP, et al. Obesity is associated with macrophage accumulation in adipose tissue. J Clin Invest. 2003;112:1796–1808. doi: 10.1172/JCI19246. [DOI] [PMC free article] [PubMed] [Google Scholar]
- 31.Xu H, et al. Chronic inflammation in fat plays a crucial role in the development of obesity-related insulin resistance. J Clin Invest. 2003;112:1821–1830. doi: 10.1172/JCI19451. [DOI] [PMC free article] [PubMed] [Google Scholar]
- 32.Osborn O, Olefsky JM. The cellular and signaling networks linking the immune system and metabolism in disease. Nat Med. 2012;18:363–374. doi: 10.1038/nm.2627. [DOI] [PubMed] [Google Scholar]
- 33.Olefsky JM, Glass CK. Macrophages, inflammation, and insulin resistance. Annu Rev Physiol. 2010;72:219–246. doi: 10.1146/annurev-physiol-021909-135846. [DOI] [PubMed] [Google Scholar]
- 34.Copps KD, et al. Irs1 Serine 307 promotes insulin sensitivity in mice. Cell Metab. 2010;11:84–92. doi: 10.1016/j.cmet.2009.11.003. [DOI] [PMC free article] [PubMed] [Google Scholar]
- 35.Petersen MC, et al. Insulin receptor Thr1160 phosphorylation mediates lipid-induced hepatic insulin resistance. J Clin Invest. 2016;126:4361–4371. doi: 10.1172/JCI86013. [DOI] [PMC free article] [PubMed] [Google Scholar]
- 36.Samuel Varman T, Shulman Gerald I. Mechanisms for insulin resistance: common threads and missing links. Cell. 2012;148:852–871. doi: 10.1016/j.cell.2012.02.017. [DOI] [PMC free article] [PubMed] [Google Scholar]
- 37.Samuel VT, et al. Inhibition of protein kinase Cε prevents hepatic insulin resistance in nonalcoholic fatty liver disease. J Clin Invest. 2007;117:739–745. doi: 10.1172/JCI30400. [DOI] [PMC free article] [PubMed] [Google Scholar]
- 38.Chaurasia B, Summers SA. Ceramides — lipotoxic inducers of metabolic disorders. Trends Endocrinol Metab. 2015;26:538–550. doi: 10.1016/j.tem.2017.09.005. [DOI] [PubMed] [Google Scholar]
- 39.Xia JY, Morley TS, Scherer PE. The adipokine/ceramide axis: key aspects of insulin sensitization. Biochimie. 2014;96:130–139. doi: 10.1016/j.biochi.2013.08.013. [DOI] [PMC free article] [PubMed] [Google Scholar]
- 40.Lazar DF, Saltiel AR. Lipid phosphatases as drug discovery targets for type 2 diabetes. Nat Rev Drug Discov. 2006;5:333–342. doi: 10.1038/nrd2007. [DOI] [PubMed] [Google Scholar]
- 41.Ogg S, Ruvkun G. The C. elegans PTEN homolog, DAF-18, acts in the insulin receptor-like metabolic signaling pathway. Mol Cell. 1998;2:887–893. doi: 10.1016/s1097-2765(00)80303-2. [DOI] [PubMed] [Google Scholar]
- 42.Song MS, Salmena L, Pandolfi PP. The functions and regulation of the PTEN tumour suppressor. Nat Rev Mol Cell Biol. 2012;13:283–296. doi: 10.1038/nrm3330. [DOI] [PubMed] [Google Scholar]
- 43.Leslie NR, Downes CP. PTEN function: how normal cells control it and tumour cells lose it. Biochem J. 2004;382:1–11. doi: 10.1042/BJ20040825. [DOI] [PMC free article] [PubMed] [Google Scholar]
- 44.Butler M, et al. Specific inhibition of PTEN expression reverses hyperglycemia in diabetic mice. Diabetes. 2002;51:1028–1034. doi: 10.2337/diabetes.51.4.1028. [DOI] [PubMed] [Google Scholar]
- 45.Horie Y, et al. Hepatocyte-specific Pten deficiency results in steatohepatitis and hepatocellular carcinomas. J Clin Invest. 2004;113:1774–1783. doi: 10.1172/JCI20513. [DOI] [PMC free article] [PubMed] [Google Scholar]
- 46.Stiles B, et al. Liver-specific deletion of negative regulator Pten results in fatty liver and insulin hypersensitivity [corrected] Proc Natl Acad Sci USA. 2004;101:2082–2087. doi: 10.1073/pnas.0308617100. [DOI] [PMC free article] [PubMed] [Google Scholar]
- 47.Kurlawalla-Martinez C, et al. Insulin hypersensitivity and resistance to streptozotocin-induced diabetes in mice lacking PTEN in adipose tissue. Mol Cell Biol. 2005;25:2498–2510. doi: 10.1128/MCB.25.6.2498-2510.2005. [DOI] [PMC free article] [PubMed] [Google Scholar]
- 48.Morley TS, Xia JY, Scherer PE. Selective enhancement of insulin sensitivity in the mature adipocyte is sufficient for systemic metabolic improvements. Nat Commun. 2015;6:7906. doi: 10.1038/ncomms8906. [DOI] [PMC free article] [PubMed] [Google Scholar]
- 49.Wijesekara N, et al. Muscle-specific Pten deletion protects against insulin resistance and diabetes. Mol Cell Biol. 2005;25:1135–1145. doi: 10.1128/MCB.25.3.1135-1145.2005. [DOI] [PMC free article] [PubMed] [Google Scholar]
- 50.Wong JT, et al. Pten (phosphatase and tensin homologue gene) haploinsufficiency promotes insulin hypersensitivity. Diabetologia. 2007;50:395–403. doi: 10.1007/s00125-006-0531-x. [DOI] [PMC free article] [PubMed] [Google Scholar]
- 51.Pal A, et al. PTEN mutations as a cause of constitutive insulin sensitivity and obesity. N Engl J Med. 2012;367:1002–1011. doi: 10.1056/NEJMoa1113966. [DOI] [PMC free article] [PubMed] [Google Scholar]
- 52.Ishihara H, et al. Molecular cloning of rat SH2-containing inositol phosphatase 2 (SHIP2) and its role in the regulation of insulin signaling. Biochem Biophys Res Commun. 1999;260:265–272. doi: 10.1006/bbrc.1999.0888. [DOI] [PubMed] [Google Scholar]
- 53.Sleeman MW, et al. Absence of the lipid phosphatase SHIP2 confers resistance to dietary obesity. Nat Med. 2005;11:199–205. doi: 10.1038/nm1178. [DOI] [PubMed] [Google Scholar]
- 54.Clement S, et al. The lipid phosphatase SHIP2 controls insulin sensitivity. Nature. 2001;409:92–97. doi: 10.1038/35051094. [DOI] [PubMed] [Google Scholar]
- 55.Clement S, et al. Corrigendum: the lipid phosphatase SHIP2 controls insulin sensitivity. Nature. 2004;431:878–878. doi: 10.1038/35051094. [DOI] [PubMed] [Google Scholar]
- 56.Fukui K, et al. Impact of the liver-specific expression of SHIP2 (SH2-containing inositol 5′-phosphatase 2) on insulin signaling and glucose metabolism in mice. Diabetes. 2005;54:1958–1967. doi: 10.2337/diabetes.54.7.1958. [DOI] [PubMed] [Google Scholar]
- 57.Grempler R, et al. Normalization of prandial blood glucose and improvement of glucose tolerance by liver-specific inhibition of SH2 domain containing inositol phosphatase 2 (SHIP2) in diabetic KKAy mice: SHIP2 inhibition causes insulin-mimetic effects on glycogen metabolism, gluconeogenesis, and glycolysis. Diabetes. 2007;56:2235–2241. doi: 10.2337/db06-1660. [DOI] [PubMed] [Google Scholar]
- 58.Buettner R, et al. Antisense oligonucleotides against the lipid phosphatase SHIP2 improve muscle insulin sensitivity in a dietary rat model of the metabolic syndrome. Am J Physiol Endocrinol Metab. 2007;292:E1871–E1878. doi: 10.1152/ajpendo.00263.2006. [DOI] [PubMed] [Google Scholar]
- 59.Suwa A, et al. Discovery and functional characterization of a novel small molecule inhibitor of the intracellular phosphatase, SHIP2. Br J Pharmacol. 2009;158:879–887. doi: 10.1111/j.1476-5381.2009.00358.x. [DOI] [PMC free article] [PubMed] [Google Scholar]
- 60.Johnson TO, Ermolieff J, Jirousek MR. Protein tyrosine phosphatase 1B inhibitors for diabetes. Nat Rev Drug Discov. 2002;1:696–709. doi: 10.1038/nrd895. [DOI] [PubMed] [Google Scholar]
- 61.Ukkola O, Santaniemi M. Protein tyrosine phosphatase 1B: a new target for the treatment of obesity and associated co-morbidities. J Internal Med. 2002;251:467–475. doi: 10.1046/j.1365-2796.2002.00992.x. [DOI] [PubMed] [Google Scholar]
- 62.Feldhammer M, Uetani N, Miranda-Saavedra D, Tremblay ML. PTP1B: a simple enzyme for a complex world. Crit Rev Biochem Mol Biol. 2013;48:430–445. doi: 10.3109/10409238.2013.819830. [DOI] [PubMed] [Google Scholar]
- 63.Elchebly M, et al. Increased insulin sensitivity and obesity resistance in mice lacking the protein tyrosine phosphatase-1B gene. Science. 1999;283:1544–1548. doi: 10.1126/science.283.5407.1544. [DOI] [PubMed] [Google Scholar]
- 64.Klaman LD, et al. Increased energy expenditure, decreased adiposity, and tissue-specific insulin sensitivity in protein-tyrosine phosphatase 1B-deficient mice. Mol Cell Biol. 2000;20:5479–5489. doi: 10.1128/mcb.20.15.5479-5489.2000. [DOI] [PMC free article] [PubMed] [Google Scholar]
- 65.Bence KK, et al. Neuronal PTP1B regulates body weight, adiposity and leptin action. Nat Med. 2006;12:917–924. doi: 10.1038/nm1435. [DOI] [PubMed] [Google Scholar]
- 66.Banno R, et al. PTP1B and SHP2 in POMC neurons reciprocally regulate energy balance in mice. J Clin Invest. 2010;120:720–734. doi: 10.1172/JCI39620. [DOI] [PMC free article] [PubMed] [Google Scholar]
- 67.Delibegovic M, et al. Liver-specific deletion of proteintyrosine phosphatase 1B (PTP1B) improves metabolic syndrome and attenuates diet-induced endoplasmic reticulum stress. Diabetes. 2009;58:590–599. doi: 10.2337/db08-0913. [DOI] [PMC free article] [PubMed] [Google Scholar]
- 68.Delibegovic M, et al. Improved glucose homeostasis in mice with muscle-specific deletion of proteintyrosine phosphatase 1B. Mol Cell Biol. 2007;27:7727–7734. doi: 10.1128/MCB.00959-07. [DOI] [PMC free article] [PubMed] [Google Scholar]
- 69.Zinker BA, et al. PTP1B antisense oligonucleotide lowers PTP1B protein, normalizes blood glucose, and improves insulin sensitivity in diabetic mice. Proc Natl Acad Sci USA. 2002;99:11357–11362. doi: 10.1073/pnas.142298199. [DOI] [PMC free article] [PubMed] [Google Scholar]
- 70.Brognard J, Newton AC. PHLiPPing the switch on Akt and protein kinase C signaling. Trends Endocrinol Metab. 2008;19:223–230. doi: 10.1016/j.tem.2008.04.001. [DOI] [PMC free article] [PubMed] [Google Scholar]
- 71.Newton AC, Trotman LC. Turning off AKT: PHLPP as a drug target. Annu Rev Pharmacol Toxicol. 2014;54:537–558. doi: 10.1146/annurev-pharmtox-011112-140338. [DOI] [PMC free article] [PubMed] [Google Scholar]
- 72.Gao T, Furnari F, Newton AC. PHLPP: a phosphatase that directly dephosphorylates Akt, promotes apoptosis, and suppresses tumor growth. Mol Cell. 2005;18:13–24. doi: 10.1016/j.molcel.2005.03.008. [DOI] [PubMed] [Google Scholar]
- 73.Brognard J, Sierecki E, Gao T, Newton AC. PHLPP and a second isoform, PHLPP2, differentially attenuate the amplitude of Akt signaling by regulating distinct Akt isoforms. Mol Cell. 2007;25:917–931. doi: 10.1016/j.molcel.2007.02.017. [DOI] [PubMed] [Google Scholar]
- 74.Gao T, Brognard J, Newton AC. The phosphatase PHLPP controls the cellular levels of protein kinase C. J Biol Chem. 2008;283:6300–6311. doi: 10.1074/jbc.M707319200. [DOI] [PubMed] [Google Scholar]
- 75.Liu J, Stevens PD, Li X, Schmidt MD, Gao T. PHLPP-mediated dephosphorylation of S6K1 inhibits protein translation and cell growth. Mol Cell Biol. 2011;31:4917–4927. doi: 10.1128/MCB.05799-11. [DOI] [PMC free article] [PubMed] [Google Scholar]
- 76.Liu J, Stevens PD, Gao T. mTOR-dependent regulation of PHLPP expression controls the rapamycin sensitivity in cancer cells. J Biol Chem. 2011;286:6510–6520. doi: 10.1074/jbc.M110.183087. [DOI] [PMC free article] [PubMed] [Google Scholar]
- 77.Li X, Liu J, Gao T. β-TrCP-mediated ubiquitination and degradation of PHLPP1 are negatively regulated by Akt. Mol Cell Biol. 2009;29:6192–6205. doi: 10.1128/MCB.00681-09. [DOI] [PMC free article] [PubMed] [Google Scholar]
- 78.Ugi S, et al. Protein phosphatase 2A negatively regulates insulin’s metabolic signaling pathway by inhibiting Akt (protein kinase B) activity in 3T3-L1 adipocytes. Mol Cell Biol. 2004;24:8778–8789. doi: 10.1128/MCB.24.19.8778-8789.2004. [DOI] [PMC free article] [PubMed] [Google Scholar]
- 79.Gotz J, Schild A. Transgenic and knockout models of PP2A. Methods Enzymol. 2003;366:390–403. doi: 10.1016/s0076-6879(03)66029-5. [DOI] [PubMed] [Google Scholar]
- 80.Rodgers JT, Vogel RO, Puigserver P. Clk2 and B56β mediate insulin-regulated assembly of the PP2A phosphatase holoenzyme complex on Akt. Mol Cell. 2011;41:471–479. doi: 10.1016/j.molcel.2011.02.007. [DOI] [PMC free article] [PubMed] [Google Scholar]
- 81.Xian L, et al. Liver-specific deletion of Ppp2cα enhances glucose metabolism and insulin sensitivity. Aging. 2015;7:223–232. doi: 10.18632/aging.100725. [DOI] [PMC free article] [PubMed] [Google Scholar]
- 82.Galbo T, et al. PP2A inhibition results in hepatic insulin resistance despite Akt2 activation. Aging. 2013;5:770–781. doi: 10.18632/aging.100611. [DOI] [PMC free article] [PubMed] [Google Scholar]
- 83.Desbuquois B, Carre N, Burnol AF. Regulation of insulin and type 1 insulin-like growth factor signaling and action by the Grb10/14 and SH2B1/B2 adaptor proteins. FEBS J. 2013;280:794–816. doi: 10.1111/febs.12080. [DOI] [PubMed] [Google Scholar]
- 84.Depetris RS, et al. Structural basis for inhibition of the insulin receptor by the adaptor protein Grb14. Mol Cell. 2005;20:325–333. doi: 10.1016/j.molcel.2005.09.001. [DOI] [PMC free article] [PubMed] [Google Scholar]
- 85.Stein EG, Ghirlando R, Hubbard SR. Structural basis for dimerization of the Grb10 Src homology 2 domain. Implications for ligand specificity. J Biol Chem. 2003;278:13257–13264. doi: 10.1074/jbc.M212026200. [DOI] [PubMed] [Google Scholar]
- 86.Bereziat V, et al. Inhibition of insulin receptor catalytic activity by the molecular adapter Grb14. J Biol Chem. 2002;277:4845–4852. doi: 10.1074/jbc.M106574200. [DOI] [PubMed] [Google Scholar]
- 87.Cooney GJ, et al. Improved glucose homeostasis and enhanced insulin signalling in Grb14-deficient mice. EMBO J. 2004;23:582–593. doi: 10.1038/sj.emboj.7600082. [DOI] [PMC free article] [PubMed] [Google Scholar]
- 88.Smith FM, et al. Mice with a disruption of the imprinted Grb10 gene exhibit altered body composition, glucose homeostasis, and insulin signaling during postnatal life. Mol Cell Biol. 2007;27:5871–5886. doi: 10.1128/MCB.02087-06. [DOI] [PMC free article] [PubMed] [Google Scholar]
- 89.Yu Y, et al. Phosphoproteomic analysis identifies Grb10 as an mTORC1 substrate that negatively regulates insulin signaling. Science. 2011;332:1322–1326. doi: 10.1126/science.1199484. [DOI] [PMC free article] [PubMed] [Google Scholar]
- 90.Hsu PP, et al. The mTOR-regulated phosphoproteome reveals a mechanism of mTORC1-mediated inhibition of growth factor signaling. Science. 2011;332:1317–1322. doi: 10.1126/science.1199498. [DOI] [PMC free article] [PubMed] [Google Scholar]
- 91.Wang L, et al. Peripheral disruption of the Grb10 gene enhances insulin signaling and sensitivity in vivo. Mol Cell Biol. 2007;27:6497–6505. doi: 10.1128/MCB.00679-07. [DOI] [PMC free article] [PubMed] [Google Scholar]
- 92.Holt LJ, et al. Dual ablation of Grb10 and Grb14 in mice reveals their combined role in regulation of insulin signaling and glucose homeostasis. Mol Endocrinol. 2009;23:1406–1414. doi: 10.1210/me.2008-0386. [DOI] [PMC free article] [PubMed] [Google Scholar]
- 93.Manning AK, et al. A genome-wide approach accounting for body mass index identifies genetic variants influencing fasting glycemic traits and insulin resistance. Nat Genet. 2012;44:659–669. doi: 10.1038/ng.2274. [DOI] [PMC free article] [PubMed] [Google Scholar]
- 94.Sohani ZN, et al. Risk alleles in/near ADCY5, ADRA2A, CDKAL1, CDKN2A/B, GRB10, and TCF7L2 elevate plasma glucose levels at birth and in early childhood: results from the FAMILY study. PLoS ONE. 2016;11:e0152107. doi: 10.1371/journal.pone.0152107. [DOI] [PMC free article] [PubMed] [Google Scholar]
- 95.Rampersaud E, et al. Identification of novel candidate genes for type 2 diabetes from a genome-wide association scan in the Old Order Amish: evidence for replication from diabetes-related quantitative traits and from independent populations. Diabetes. 2007;56:3053–3062. doi: 10.2337/db07-0457. [DOI] [PubMed] [Google Scholar]
- 96.Prokopenko I, et al. A central role for GRB10 in regulation of islet function in man. PLoS Genet. 2014;10:e1004235. doi: 10.1371/journal.pgen.1004235. [DOI] [PMC free article] [PubMed] [Google Scholar]
- 97.Scott RA, et al. Large-scale association analyses identify new loci influencing glycemic traits and provide insight into the underlying biological pathways. Nat Genet. 2012;44:991–1005. doi: 10.1038/ng.2385. [DOI] [PMC free article] [PubMed] [Google Scholar]
- 98.Kooner JS, et al. Genome-wide association study in individuals of South Asian ancestry identifies six new type 2 diabetes susceptibility loci. Nat Genet. 2011;43:984–989. doi: 10.1038/ng.921. [DOI] [PMC free article] [PubMed] [Google Scholar]
- 99.Harder MN, et al. Type 2 diabetes risk alleles near BCAR1 and in ANK1 associate with decreased β-cell function whereas risk alleles near ANKRD55 and GRB14 associate with decreased insulin sensitivity in the Danish Inter99 cohort. J Clin Endocrinol Metabolism. 2013;98:E801–E806. doi: 10.1210/jc.2012-4169. [DOI] [PubMed] [Google Scholar]
- 100.Lu Y, et al. New loci for body fat percentage reveal link between adiposity and cardiometabolic disease risk. Nat Commun. 2016;7:10495. doi: 10.1038/ncomms10495. [DOI] [PMC free article] [PubMed] [Google Scholar]
- 101.Heid IM, et al. Meta-analysis identifies 13 new loci associated with waist-hip ratio and reveals sexual dimorphism in the genetic basis of fat distribution. Nat Genet. 2010;42:949–960. doi: 10.1038/ng.685. [DOI] [PMC free article] [PubMed] [Google Scholar]
- 102.Liu CT, et al. Genome-wide association of body fat distribution in African ancestry populations suggests new loci. PLoS Genet. 2013;9:e1003681. doi: 10.1371/journal.pgen.1003681. [DOI] [PMC free article] [PubMed] [Google Scholar]
- 103.Randall JC, et al. Sex-stratified genome-wide association studies including 270,000 individuals show sexual dimorphism in genetic loci for anthropometric traits. PLoS Genet. 2013;9:e1003500. doi: 10.1371/journal.pgen.1003500. [DOI] [PMC free article] [PubMed] [Google Scholar]
- 104.Shungin D, et al. New genetic loci link adipose and insulin biology to body fat distribution. Nature. 2015;518:187–196. doi: 10.1038/nature14132. [DOI] [PMC free article] [PubMed] [Google Scholar]
- 105.Morris AP, et al. Large-scale association analysis provides insights into the genetic architecture and pathophysiology of type 2 diabetes. Nat Genet. 2012;44:981–990. doi: 10.1038/ng.2383. [DOI] [PMC free article] [PubMed] [Google Scholar]
- 106.Howard JK, Flier JS. Attenuation of leptin and insulin signaling by SOCS proteins. Trends Endocrinol Metab. 2006;17:365–371. doi: 10.1016/j.tem.2006.09.007. [DOI] [PubMed] [Google Scholar]
- 107.Jorgensen SB, et al. Deletion of skeletal muscle SOCS3 prevents insulin resistance in obesity. Diabetes. 2013;62:56–64. doi: 10.2337/db12-0443. [DOI] [PMC free article] [PubMed] [Google Scholar]
- 108.Emanuelli B, Macotela Y, Boucher J, Ronald Kahn C. SOCS-1 deficiency does not prevent diet-induced insulin resistance. Biochem Biophys Res Commun. 2008;377:447–452. doi: 10.1016/j.bbrc.2008.09.158. [DOI] [PMC free article] [PubMed] [Google Scholar]
- 109.Marine JC, et al. SOCS1 deficiency causes a lymphocyte-dependent perinatal lethality. Cell. 1999;98:609–616. doi: 10.1016/s0092-8674(00)80048-3. [DOI] [PubMed] [Google Scholar]
- 110.Rui L. SH2B1 regulation of energy balance, body weight, and glucose metabolism. World J Diabetes. 2014;5:511–526. doi: 10.4239/wjd.v5.i4.511. [DOI] [PMC free article] [PubMed] [Google Scholar]
- 111.Song W, et al. SH2B regulation of growth, metabolism, and longevity in both insects and mammals. Cell Metab. 2010;11:427–437. doi: 10.1016/j.cmet.2010.04.002. [DOI] [PMC free article] [PubMed] [Google Scholar]
- 112.Morris DL, Cho KW, Zhou Y, Rui L. SH2B1 enhances insulin sensitivity by both stimulating the insulin receptor and inhibiting tyrosine dephosphorylation of insulin receptor substrate proteins. Diabetes. 2009;58:2039–2047. doi: 10.2337/db08-1388. [DOI] [PMC free article] [PubMed] [Google Scholar]
- 113.Bauer F, et al. Obesity genes identified in genomewide association studies are associated with adiposity measures and potentially with nutrient-specific food preference. Am J Clin Nutr. 2009;90:951–959. doi: 10.3945/ajcn.2009.27781. [DOI] [PubMed] [Google Scholar]
- 114.Jamshidi Y, Snieder H, Ge D, Spector TD, O’Dell SD. The SH2B gene is associated with serum leptin and body fat in normal female twins. Obesity (Silver Spring) 2007;15:5–9. doi: 10.1038/oby.2007.637. [DOI] [PMC free article] [PubMed] [Google Scholar]
- 115.Renstrom F, et al. Replication and extension of genome-wide association study results for obesity in 4923 adults from northern Sweden. Hum Mol Genet. 2009;18:1489–1496. doi: 10.1093/hmg/ddp041. [DOI] [PMC free article] [PubMed] [Google Scholar]
- 116.Thorleifsson G, et al. Genome-wide association yields new sequence variants at seven loci that associate with measures of obesity. Nat Genet. 2009;41:18–24. doi: 10.1038/ng.274. [DOI] [PubMed] [Google Scholar]
- 117.Willer CJ, et al. Six new loci associated with body mass index highlight a neuronal influence on body weight regulation. Nat Genet. 2009;41:25–34. doi: 10.1038/ng.287. [DOI] [PMC free article] [PubMed] [Google Scholar]
- 118.Hotta K, et al. Association between type 2 diabetes genetic susceptibility loci and visceral and subcutaneous fat area as determined by computed tomography. J Hum Genet. 2012;57:305–310. doi: 10.1038/jhg.2012.21. [DOI] [PubMed] [Google Scholar]
- 119.Bochukova EG, et al. Large, rare chromosomal deletions associated with severe early-onset obesity. Nature. 2010;463:666–670. doi: 10.1038/nature08689. [DOI] [PMC free article] [PubMed] [Google Scholar]
- 120.Walters RG, et al. A new highly penetrant form of obesity due to deletions on chromosome 16p11.2. Nature. 2010;463:671–675. doi: 10.1038/nature08727. [DOI] [PMC free article] [PubMed] [Google Scholar]
- 121.Prudente S, et al. The SH2B1 obesity locus and abnormal glucose homeostasis: lack of evidence for association from a meta-analysis in individuals of European ancestry. Nutr Metab Cardiovasc Dis. 2013;23:1043–1049. doi: 10.1016/j.numecd.2013.05.001. [DOI] [PubMed] [Google Scholar]
- 122.Belfiore A, Malaguarnera R. The insulin receptor: a new target for cancer therapy. Front Endocrinol. 2011 doi: 10.3389/fendo.2011.00093. http://dx.doi.org/10.3389/fendo.2011.00093. [DOI] [PMC free article] [PubMed]
- 123.Diaz-Castroverde S, et al. Insulin receptor isoform A ameliorates long-term glucose intolerance in diabetic mice. Dis Model Mech. 2016;9:1271–1281. doi: 10.1242/dmm.025288. [DOI] [PMC free article] [PubMed] [Google Scholar]
- 124.Diaz-Castroverde S, et al. Prevalent role of the insulin receptor isoform A in the regulation of hepatic glycogen metabolism in hepatocytes and in mice. Diabetologia. 2016;59:2702–2710. doi: 10.1007/s00125-016-4088-z. [DOI] [PubMed] [Google Scholar]
- 125.Moller DE, Yokota A, Caro JF, Flier JS. Tissue-specific expression of two alternatively spliced insulin receptor mRNAs in man. Mol Endocrinol. 1989;3:1263–1269. doi: 10.1210/mend-3-8-1263. [DOI] [PubMed] [Google Scholar]
- 126.Bjornholm M, et al. Absence of functional insulin receptor substrate-3 (IRS-3) gene in humans. Diabetologia. 2002;45:1697–1702. doi: 10.1007/s00125-002-0945-z. [DOI] [PubMed] [Google Scholar]
- 127.Dong XC, et al. Inactivation of hepatic Foxo1 by insulin signaling is required for adaptive nutrient homeostasis and endocrine growth regulation. Cell Metab. 2008;8:65–76. doi: 10.1016/j.cmet.2008.06.006. [DOI] [PMC free article] [PubMed] [Google Scholar]
- 128.Kubota N, et al. Dynamic functional relay between insulin receptor substrate 1 and 2 in hepatic insulin signaling during fasting and feeding. Cell Metab. 2008;8:49–64. doi: 10.1016/j.cmet.2008.05.007. [DOI] [PubMed] [Google Scholar]
- 129.Michael MD, et al. Loss of insulin signaling in hepatocytes leads to severe insulin resistance and progressive hepatic dysfunction. Mol Cell. 2000;6:87–97. [PubMed] [Google Scholar]
- 130.Long YC, Cheng Z, Copps KD, White MF. Insulin receptor substrates Irs1 and Irs2 coordinate skeletal muscle growth and metabolism via the Akt and AMPK pathways. Mol Cell Biol. 2011;31:430–441. doi: 10.1128/MCB.00983-10. [DOI] [PMC free article] [PubMed] [Google Scholar]
- 131.Laustsen PG, et al. Essential role of insulin and insulin-like growth factor 1 receptor signaling in cardiac development and function. Mol Cell Biol. 2007;27:1649–1664. doi: 10.1128/MCB.01110-06. [DOI] [PMC free article] [PubMed] [Google Scholar]
- 132.Dong X, et al. Irs1 and Irs2 signaling is essential for hepatic glucose homeostasis and systemic growth. J Clin Invest. 2006;116:101–114. doi: 10.1172/JCI25735. [DOI] [PMC free article] [PubMed] [Google Scholar]
- 133.Guo S, et al. The Irs1 branch of the insulin signaling cascade plays a dominant role in hepatic nutrient homeostasis. Mol Cell Biol. 2009;29:5070–5083. doi: 10.1128/MCB.00138-09. [DOI] [PMC free article] [PubMed] [Google Scholar]
- 134.Kubota N, et al. Differential hepatic distribution of insulin receptor substrates causes selective insulin resistance in diabetes and obesity. Nat Commun. 2016;7:12977. doi: 10.1038/ncomms12977. [DOI] [PMC free article] [PubMed] [Google Scholar]
- 135.Manning BD, Cantley LC. AKT/PKB signaling: navigating downstream. Cell. 2007;129:1261–1274. doi: 10.1016/j.cell.2007.06.009. [DOI] [PMC free article] [PubMed] [Google Scholar]
- 136.Dummler B, Hemmings BA. Physiological roles of PKB/Akt isoforms in development and disease. Biochem Soc Trans. 2007;35:231. doi: 10.1042/BST0350231. [DOI] [PubMed] [Google Scholar]
- 137.Gonzalez E, McGraw TE. The Akt kinases: isoform specificity in metabolism and cancer. Cell Cycle. 2009;8:2502–2508. doi: 10.4161/cc.8.16.9335. [DOI] [PMC free article] [PubMed] [Google Scholar]
- 138.Manning BD, Toker A. AKT/PKB Signaling: navigating the network. Cell. 2017;169:381–405. doi: 10.1016/j.cell.2017.04.001. [DOI] [PMC free article] [PubMed] [Google Scholar]
- 139.Zheng X, Cartee GD. Insulin-induced effects on the subcellular localization of AKT1, AKT2 and AS160 in rat skeletal muscle. Sci Rep. 2016;6:39230. doi: 10.1038/srep39230. [DOI] [PMC free article] [PubMed] [Google Scholar]
- 140.Gonzalez E, McGraw TE. Insulin-modulated Akt subcellular localization determines Akt isoformspecific signaling. Proc Natl Acad Sci USA. 2009;106:7004–7009. doi: 10.1073/pnas.0901933106. [DOI] [PMC free article] [PubMed] [Google Scholar]
- 141.Osorio-Fuentealba C, Klip A. Dissecting signalling by individual Akt/PKB isoforms, three steps at once. Biochem J. 2015;470:e13–e16. doi: 10.1042/BJ20150750. [DOI] [PubMed] [Google Scholar]
- 142.Kajno E, McGraw TE, Gonzalez E. Development of a new model system to dissect isoform specific Akt signalling in adipocytes. Biochem J. 2015;468:425–434. doi: 10.1042/BJ20150191. [DOI] [PMC free article] [PubMed] [Google Scholar]
- 143.Kubota H, et al. Temporal coding of insulin action through multiplexing of the AKT pathway. Mol Cell. 2012;46:820–832. doi: 10.1016/j.molcel.2012.04.018. [DOI] [PubMed] [Google Scholar]
- 144.Lefebvre PJ, Paolisso G, Scheen AJ, Henquin JC. Pulsatility of insulin and glucagon release: physiological significance and pharmacological implications. Diabetologia. 1987;30:443–452. doi: 10.1007/BF00279610. [DOI] [PubMed] [Google Scholar]
- 145.Kim SP, et al. Nocturnal free fatty acids are uniquely elevated in the longitudinal development of diet-induced insulin resistance and hyperinsulinemia. Am J Physiol Endocrinol Metab. 2007;292:E1590–E1598. doi: 10.1152/ajpendo.00669.2006. [DOI] [PubMed] [Google Scholar]
- 146.Zhang J, et al. Insulin inhibits transcription of IRS-2 gene in rat liver through an insulin response element (IRE) that resembles IREs of other insulin-repressed genes. Proc Natl Acad Sci. 2001;98:3756–3761. doi: 10.1073/pnas.071054598. [DOI] [PMC free article] [PubMed] [Google Scholar]
- 147.Hirashima Y, et al. Insulin down-regulates insulin receptor substrate-2 expression through the phosphatidylinositol 3-kinase/Akt pathway. J Endocrinol. 2003;179:253–266. doi: 10.1677/joe.0.1790253. [DOI] [PubMed] [Google Scholar]
- 148.Ide T, et al. SREBPs suppress IRS-2-mediated insulin signalling in the liver. Nat Cell Biol. 2004;6:351–357. doi: 10.1038/ncb1111. [DOI] [PubMed] [Google Scholar]
- 149.Hanke S, Mann M. The phosphotyrosine interactome of the insulin receptor family and its substrates IRS-1 and IRS-2. Mol Cell Proteomics. 2009;8:519–534. doi: 10.1074/mcp.M800407-MCP200. [DOI] [PMC free article] [PubMed] [Google Scholar]
- 150.Vinayagam A, et al. An integrative analysis of the InR/PI3K/Akt network identifies the dynamic response to insulin signaling. Cell Rep. 2016;16:3062–3074. doi: 10.1016/j.celrep.2016.08.029. [DOI] [PMC free article] [PubMed] [Google Scholar]
- 151.Schmelzle K, Kane S, Gridley S, Lienhard GE, White FM. Temporal dynamics of tyrosine phosphorylation in insulin signaling. Diabetes. 2006;55:2171–2179. doi: 10.2337/db06-0148. [DOI] [PubMed] [Google Scholar]
- 152.Kruger M, et al. Dissection of the insulin signaling pathway via quantitative phosphoproteomics. Proc Natl Acad Sci USA. 2008;105:2451–2456. doi: 10.1073/pnas.0711713105. [DOI] [PMC free article] [PubMed] [Google Scholar]
- 153.Humphrey SJ, et al. Dynamic adipocyte phosphoproteome reveals that Akt directly regulates mTORC2. Cell Metab. 2013;17:1009–1020. doi: 10.1016/j.cmet.2013.04.010. [DOI] [PMC free article] [PubMed] [Google Scholar]
- 154.Humphrey SJ, Azimifar SB, Mann M. High-throughput phosphoproteomics reveals in vivo insulin signaling dynamics. Nat Biotechnol. 2015;33:990–995. doi: 10.1038/nbt.3327. References 153 and 154 used mass spectrometry to identify the protein residues that are phosphorylated in response to insulin, as well as the timing of these phosphorylation events. [DOI] [PubMed] [Google Scholar]
- 155.Lauro D, et al. Impaired glucose tolerance in mice with a targeted impairment of insulin action in muscle and adipose tissue. Nat Genet. 1998;20:294–298. doi: 10.1038/3112. [DOI] [PubMed] [Google Scholar]
- 156.Cushman SW, Wardzala LJ. Potential mechanism of insulin action on glucose transport in the isolated rat adipose cell. Apparent translocation of intracellular transport systems to the plasma membrane. J Biol Chem. 1980;255:4758–4762. [PubMed] [Google Scholar]
- 157.Suzuki K, Kono T. Evidence that insulin causes translocation of glucose transport activity to the plasma membrane from an intracellular storage site. Proc Natl Acad Sci USA. 1980;77:2542–2545. doi: 10.1073/pnas.77.5.2542. [DOI] [PMC free article] [PubMed] [Google Scholar]
- 158.Foley K, Boguslavsky S, Klip A. Endocytosis, recycling, and regulated exocytosis of glucose transporter 4. Biochemistry. 2011;50:3048–3061. doi: 10.1021/bi2000356. [DOI] [PubMed] [Google Scholar]
- 159.Huang S, Czech MP. The GLUT4 glucose transporter. Cell Metab. 2007;5:237–252. doi: 10.1016/j.cmet.2007.03.006. [DOI] [PubMed] [Google Scholar]
- 160.Klip A, Sun Y, Chiu TT, Foley KP. Signal transduction meets vesicle traffic: the software and hardware of GLUT4 translocation. Am J Cell Physiol. 2014;306:C879–C886. doi: 10.1152/ajpcell.00069.2014. [DOI] [PubMed] [Google Scholar]
- 161.Leto D, Saltiel AR. Regulation of glucose transport by insulin: traffic control of GLUT4. Nat Rev Mol Cell Biol. 2012;13:383–396. doi: 10.1038/nrm3351. [DOI] [PubMed] [Google Scholar]
- 162.Eguez L, et al. Full intracellular retention of GLUT4 requires AS160 Rab GTPase activating protein. Cell Metab. 2005;2:263–272. doi: 10.1016/j.cmet.2005.09.005. [DOI] [PubMed] [Google Scholar]
- 163.Miinea CP, et al. AS160, the Akt substrate regulating GLUT4 translocation, has a functional Rab GTPase-activating protein domain. Biochem J. 2005;391:87–93. doi: 10.1042/BJ20050887. [DOI] [PMC free article] [PubMed] [Google Scholar]
- 164.Sano H, et al. Insulin-stimulated phosphorylation of a Rab GTPase-activating protein regulates GLUT4 translocation. J Biol Chem. 2003;278:14599–14602. doi: 10.1074/jbc.C300063200. [DOI] [PubMed] [Google Scholar]
- 165.Ramm G, Larance M, Guilhaus M, James DE. A role for 14-3-3 in insulin-stimulated GLUT4 translocation through its interaction with the RabGAP AS160. J Biol Chem. 2006;281:29174–29180. doi: 10.1074/jbc.M603274200. [DOI] [PubMed] [Google Scholar]
- 166.Ishikura S, Bilan PJ, Klip A. Rabs 8A and 14 are targets of the insulin-regulated Rab-GAP AS160 regulating GLUT4 traffic in muscle cells. Biochem Biophys Res Commun. 2007;353:1074–1079. doi: 10.1016/j.bbrc.2006.12.140. [DOI] [PubMed] [Google Scholar]
- 167.Sano H, et al. Rab10, a target of the AS160 Rab GAP, is required for insulin-stimulated translocation of GLUT4 to the adipocyte plasma membrane. Cell Metab. 2007;5:293–303. doi: 10.1016/j.cmet.2007.03.001. [DOI] [PubMed] [Google Scholar]
- 168.Vazirani RP, et al. Disruption of adipose Rab10-dependent insulin signaling causes hepatic insulin resistance. Diabetes. 2016;65:1577–1589. doi: 10.2337/db15-1128. [DOI] [PMC free article] [PubMed] [Google Scholar]
- 169.Bruno J, Brumfield A, Chaudhary N, Iaea D, McGraw TE. SEC16A is a RAB10 effector required for insulin-stimulated GLUT4 trafficking in adipocytes. J Cell Biol. 2016;214:61–76. doi: 10.1083/jcb.201509052. [DOI] [PMC free article] [PubMed] [Google Scholar]
- 170.Uhm M, et al. Phosphorylation of the exocyst protein Exo84 by TBK1 promotes insulin-stimulated GLUT4 trafficking. Sci Signal. 2017;10:eaah5085. doi: 10.1126/scisignal.aah5085. [DOI] [PubMed] [Google Scholar]
- 171.Lin HV, Accili D. Hormonal regulation of hepatic glucose production in health and disease. Cell Metab. 2011;14:9–19. doi: 10.1016/j.cmet.2011.06.003. [DOI] [PMC free article] [PubMed] [Google Scholar]
- 172.Matsumoto M, Pocai A, Rossetti L, Depinho RA, Accili D. Impaired regulation of hepatic glucose production in mice lacking the forkhead transcription factor Foxo1 in liver. Cell Metab. 2007;6:208–216. doi: 10.1016/j.cmet.2007.08.006. [DOI] [PubMed] [Google Scholar]
- 173.Nakae J, Kitamura T, Silver DL, Accili D. The forkhead transcription factor Foxo1 (Fkhr) confers insulin sensitivity onto glucose-6-phosphatase expression. J Clin Invest. 2001;108:1359–1367. doi: 10.1172/JCI12876. [DOI] [PMC free article] [PubMed] [Google Scholar]
- 174.Haeusler RA, et al. Integrated control of hepatic lipogenesis versus glucose production requires FoxO transcription factors. Nat Commun. 2014;5:5190. doi: 10.1038/ncomms6190. [DOI] [PMC free article] [PubMed] [Google Scholar]
- 175.Nakae J, et al. The forkhead transcription factor Foxo1 regulates adipocyte differentiation. Dev Cell. 2003;4:119–129. doi: 10.1016/s1534-5807(02)00401-x. [DOI] [PubMed] [Google Scholar]
- 176.Plum L, et al. The obesity susceptibility gene Cpe links FoxO1 signaling in hypothalamic proopiomelanocortin neurons with regulation of food intake. Nat Med. 2009;15:1195–1201. doi: 10.1038/nm.2026. [DOI] [PMC free article] [PubMed] [Google Scholar]
- 177.Ren H, et al. FoxO1 target Gpr17 activates AgRP neurons to regulate food intake. Cell. 2012;149:1314–1326. doi: 10.1016/j.cell.2012.04.032. [DOI] [PMC free article] [PubMed] [Google Scholar]
- 178.Kitamura T, et al. The forkhead transcription factor Foxo1 links insulin signaling to Pdx1 regulation of pancreatic β cell growth. J Clin Invest. 2002;110:1839–1847. doi: 10.1172/JCI200216857. [DOI] [PMC free article] [PubMed] [Google Scholar]
- 179.Kitamura YI, et al. FoxO1 protects against pancreatic β cell failure through NeuroD and MafA induction. Cell Metab. 2005;2:153–163. doi: 10.1016/j.cmet.2005.08.004. [DOI] [PubMed] [Google Scholar]
- 180.Horton JD, Goldstein JL, Brown MS. SREBPs: activators of the complete program of cholesterol and fatty acid synthesis in the liver. J Clin Invest. 2002;109:1125–1131. doi: 10.1172/JCI15593. [DOI] [PMC free article] [PubMed] [Google Scholar]
- 181.Flier JS, Hollenberg AN. ADD-1 provides major new insight into the mechanism of insulin action. Proc Natl Acad Sci USA. 1999;96:14191–14192. doi: 10.1073/pnas.96.25.14191. [DOI] [PMC free article] [PubMed] [Google Scholar]
- 182.Owen JL, et al. Insulin stimulation of SREBP-1c processing in transgenic rat hepatocytes requires p70 S6-kinase. Proc Natl Acad Sci USA. 2012;109:16184–16189. doi: 10.1073/pnas.1213343109. [DOI] [PMC free article] [PubMed] [Google Scholar]
- 183.Chen G, Liang G, Ou J, Goldstein JL, Brown MS. Central role for liver X receptor in insulin-mediated activation of Srebp-1c transcription and stimulation of fatty acid synthesis in liver. Proc Natl Acad Sci USA. 2004;101:11245–11250. doi: 10.1073/pnas.0404297101. [DOI] [PMC free article] [PubMed] [Google Scholar]
- 184.Hegarty BD, et al. Distinct roles of insulin and liver X receptor in the induction and cleavage of sterol regulatory element binding protein-1c. Proc Natl Acad Sci USA. 2005;102:791–796. doi: 10.1073/pnas.0405067102. [DOI] [PMC free article] [PubMed] [Google Scholar]
- 185.Kim JB, et al. Nutritional and insulin regulation of fatty acid synthetase and leptin gene expression through ADD1/SREBP1. J Clin Invest. 1998;101:1–9. doi: 10.1172/JCI1411. [DOI] [PMC free article] [PubMed] [Google Scholar]
- 186.Li S, Brown MS, Goldstein JL. Bifurcation of insulin signaling pathway in rat liver: mTORC1 required for stimulation of lipogenesis, but not inhibition of gluconeogenesis. Proc Natl Acad Sci USA. 2010;107:3441–3446. doi: 10.1073/pnas.0914798107. [DOI] [PMC free article] [PubMed] [Google Scholar]
- 187.Nakae J, Park BC, Accili D. Insulin stimulates phosphorylation of the forkhead transcription factor FKHR on serine 253 through a Wortmannin-sensitive pathway. J Biol Chem. 1999;274:15982–15985. doi: 10.1074/jbc.274.23.15982. [DOI] [PubMed] [Google Scholar]
- 188.Brunet A, et al. Akt promotes cell survival by phosphorylating and inhibiting a Forkhead transcription factor. Cell. 1999;96:857–868. doi: 10.1016/s0092-8674(00)80595-4. [DOI] [PubMed] [Google Scholar]
- 189.Biggs WH, III, Meisenhelder J, Hunter T, Cavenee WK, Arden KC. Protein kinase B/Aktmediated phosphorylation promotes nuclear exclusion of the winged helix transcription factor FKHR1. Proc Natl Acad Sci USA. 1999;96:7421–7426. doi: 10.1073/pnas.96.13.7421. [DOI] [PMC free article] [PubMed] [Google Scholar]
- 190.Haas JT, et al. Hepatic insulin signaling is required for obesity-dependent expression of SREBP-1c mRNA but not for feeding-dependent expression. Cell Metab. 2012;15:873–884. doi: 10.1016/j.cmet.2012.05.002. [DOI] [PMC free article] [PubMed] [Google Scholar]
- 191.Shimomura I, et al. Decreased IRS-2 and increased SREBP-1c lead to mixed insulin resistance and sensitivity in livers of lipodystrophic and ob/ob mice. Mol Cell. 2000;6:77–86. [PubMed] [Google Scholar]
- 192.Waters KM, Ntambi JM. Insulin and dietary fructose induce stearoyl-CoA desaturase 1 gene expression of diabetic mice. J Biol Chem. 1994;269:27773–27777. [PubMed] [Google Scholar]
- 193.Paulauskis JD, Sul HS. Hormonal regulation of mouse fatty acid synthase gene transcription in liver. J Biol Chem. 1989;264:574–577. [PubMed] [Google Scholar]
- 194.Peterson TR, et al. mTOR complex 1 regulates lipin 1 localization to control the SREBP pathway. Cell. 2011;146:408–420. doi: 10.1016/j.cell.2011.06.034. [DOI] [PMC free article] [PubMed] [Google Scholar]
- 195.Han J, et al. The CREB coactivator CRTC2 controls hepatic lipid metabolism by regulating SREBP1. Nature. 2015;524:243–246. doi: 10.1038/nature14557. References 194 and 195 offered two mechanisms to explain the post-translational activation of SREBP1c by insulin, a phenomenon that had previously been poorly understood. [DOI] [PubMed] [Google Scholar]
- 196.Jensen M, De Meyts P. Molecular mechanisms of differential intracellular signaling from the insulin receptor. Vitam Horm. 2009;80:51–75. doi: 10.1016/S0083-6729(08)00603-1. [DOI] [PubMed] [Google Scholar]
- 197.Bergeron JJ, Di Guglielmo GM, Dahan S, Dominguez M, Posner BI. Spatial and temporal regulation of receptor tyrosine kinase activation and intracellular signal transduction. Annu Rev Biochem. 2016;85:573–597. doi: 10.1146/annurev-biochem-060815-014659. [DOI] [PubMed] [Google Scholar]
- 198.Nakae J, Kido Y, Accili D. Distinct and overlapping functions of insulin and IGF-I receptors. Endocr Rev. 2001;22:818–835. doi: 10.1210/edrv.22.6.0452. [DOI] [PubMed] [Google Scholar]
- 199.Schmidt V, et al. SORLA facilitates insulin receptor signaling in adipocytes and exacerbates obesity. J Clin Invest. 2016;126:2706–2720. doi: 10.1172/JCI84708. [DOI] [PMC free article] [PubMed] [Google Scholar]
- 200.Smith EN, et al. Longitudinal genome-wide association of cardiovascular disease risk factors in the Bogalusa heart study. PLoS Genet. 2010;6:e1001094. doi: 10.1371/journal.pgen.1001094. [DOI] [PMC free article] [PubMed] [Google Scholar]
- 201.Parks Brian W, et al. Genetic control of obesity and gut microbiota composition in response to high-fat, high-sucrose diet in mice. Cell Metab. 2013;17:141–152. doi: 10.1016/j.cmet.2012.12.007. [DOI] [PMC free article] [PubMed] [Google Scholar]
- 202.Lampson MA, Racz A, Cushman SW, McGraw TE. Demonstration of insulin-responsive trafficking of GLUT4 and vpTR in fibroblasts. J Cell Sci. 2000;113:4065–4076. doi: 10.1242/jcs.113.22.4065. [DOI] [PubMed] [Google Scholar]
- 203.Ross SA, Herbst JJ, Keller SR, Lienhard GE. Trafficking kinetics of the insulin-regulated membrane aminopeptidase in 3T3-L1 adipocytes. Biochem Biophys Res Commun. 1997;239:247–251. doi: 10.1006/bbrc.1997.7459. [DOI] [PubMed] [Google Scholar]
- 204.Keller SR, Davis AC, Clairmont KB. Mice deficient in the insulin-regulated membrane aminopeptidase show substantial decreases in glucose transporter GLUT4 levels but maintain normal glucose homeostasis. J Biol Chem. 2002;277:17677–17686. doi: 10.1074/jbc.M202037200. [DOI] [PubMed] [Google Scholar]
- 205.Screaton RA, et al. The CREB coactivator TORC2 functions as a calciumand cAMP-sensitive coincidence detector. Cell. 2004;119:61–74. doi: 10.1016/j.cell.2004.09.015. [DOI] [PubMed] [Google Scholar]
- 206.Dentin R, et al. Insulin modulates gluconeogenesis by inhibition of the coactivator TORC2. Nature. 2007;449:366–369. doi: 10.1038/nature06128. [DOI] [PubMed] [Google Scholar]
- 207.Ozcan L, et al. Calcium signaling through CaMKII regulates hepatic glucose production in fasting and obesity. Cell Metab. 2012;15:739–751. doi: 10.1016/j.cmet.2012.03.002. [DOI] [PMC free article] [PubMed] [Google Scholar]
- 208.Kawamori D, et al. The forkhead transcription factor Foxo1 bridges the JNK pathway and the transcription factor PDX-1 through its intracellular translocation. J Biol Chem. 2006;281:1091–1098. doi: 10.1074/jbc.M508510200. [DOI] [PubMed] [Google Scholar]
- 209.Martinez SC, et al. Inhibition of Foxo1 protects pancreatic islet β-cells against fatty acid and endoplasmic reticulum stress-induced apoptosis. Diabetes. 2008;57:846–859. doi: 10.2337/db07-0595. [DOI] [PubMed] [Google Scholar]
- 210.Frescas D, Valenti L, Accili D. Nuclear trapping of the forkhead transcription factor FoxO1 via Sirt-dependent deacetylation promotes expression of glucogenetic genes. J Biol Chem. 2005;280:20589–20595. doi: 10.1074/jbc.M412357200. [DOI] [PubMed] [Google Scholar]
- 211.Qiang L, Banks AS, Accili D. Uncoupling of acetylation from phosphorylation regulates FOXO1 function independent of its sub-cellular localization. J Biol Chem. 2010;285:27396–27401. doi: 10.1074/jbc.M110.140228. [DOI] [PMC free article] [PubMed] [Google Scholar]
- 212.Banks AS, et al. Dissociation of the glucose and lipid regulatory functions of FoxO1 by targeted knockin of acetylation-defective alleles in mice. Cell Metab. 2011;14:587–597. doi: 10.1016/j.cmet.2011.09.012. [DOI] [PMC free article] [PubMed] [Google Scholar]
- 213.Tsuchiya K, et al. Homozygosity for an allele encoding deacetylated FoxO1 protects macrophages from cholesterol-induced inflammation without increasing apoptosis. Arterioscler Thromb Vasc Biol. 2011;31:2920–2928. doi: 10.1161/ATVBAHA.110.219477. [DOI] [PMC free article] [PubMed] [Google Scholar]
- 214.Qiang L, et al. Increased atherosclerosis and endothelial dysfunction in mice bearing constitutively deacetylated alleles of Foxo1 gene. J Biol Chem. 2012;287:13944–13951. doi: 10.1074/jbc.M111.332767. [DOI] [PMC free article] [PubMed] [Google Scholar]
- 215.Betz C, Hall MN. Where is mTOR and what is it doing there? J Cell Biol. 2013;203:563–574. doi: 10.1083/jcb.201306041. [DOI] [PMC free article] [PubMed] [Google Scholar]
- 216.Sancak Y, et al. Ragulator-Rag complex targets mTORC1 to the lysosomal surface and is necessary for its activation by amino acids. Cell. 2010;141:290–303. doi: 10.1016/j.cell.2010.02.024. [DOI] [PMC free article] [PubMed] [Google Scholar]
- 217.Inoki K, Li Y, Xu T, Guan KL. Rheb GTPase is a direct target of TSC2 GAP activity and regulates mTOR signaling. Genes Dev. 2003;17:1829–1834. doi: 10.1101/gad.1110003. [DOI] [PMC free article] [PubMed] [Google Scholar]
- 218.Inoki K, Li Y, Zhu T, Wu J, Guan KL. TSC2 is phosphorylated and inhibited by Akt and suppresses mTOR signalling. Nat Cell Biol. 2002;4:648–657. doi: 10.1038/ncb839. [DOI] [PubMed] [Google Scholar]
- 219.Potter CJ, Pedraza LG, Xu T. Akt regulates growth by directly phosphorylating Tsc2. Nat Cell Biol. 2002;4:658–665. doi: 10.1038/ncb840. [DOI] [PubMed] [Google Scholar]
- 220.Menon S, et al. Spatial control of the TSC complex integrates insulin and nutrient regulation of mTORC1 at the lysosome. Cell. 2014;156:771–785. doi: 10.1016/j.cell.2013.11.049. This article demonstrated that insulin regulates mTORC1 activity by controlling the spatial distribution of the TSC complex. [DOI] [PMC free article] [PubMed] [Google Scholar]
- 221.Phillips MJ, Voeltz GK. Structure and function of ER membrane contact sites with other organelles. Nat Rev Mol Cell Biol. 2016;17:69–82. doi: 10.1038/nrm.2015.8. [DOI] [PMC free article] [PubMed] [Google Scholar]
- 222.Rutter GA, Pinton P. Mitochondria-associated endoplasmic reticulum membranes in insulin signaling. Diabetes. 2014;63:3163–3165. doi: 10.2337/db14-0812. [DOI] [PubMed] [Google Scholar]
- 223.Giorgi C, et al. PML regulates apoptosis at endoplasmic reticulum by modulating calcium release. Science. 2010;330:1247–1251. doi: 10.1126/science.1189157. [DOI] [PMC free article] [PubMed] [Google Scholar]
- 224.Betz C, et al. mTOR complex 2-Akt signaling at mitochondria-associated endoplasmic reticulum membranes (MAM) regulates mitochondrial physiology. Proc Natl Acad Sci. 2013;110:12526–12534. doi: 10.1073/pnas.1302455110. [DOI] [PMC free article] [PubMed] [Google Scholar]
- 225.Tubbs E, et al. Mitochondria-associated endoplasmic reticulum membrane (MAM) integrity is required for insulin signaling and is implicated in hepatic insulin resistance. Diabetes. 2014;63:3279–3294. doi: 10.2337/db13-1751. [DOI] [PubMed] [Google Scholar]
- 226.Sarbassov DD, Guertin DA, Ali SM, Sabatini DM. Phosphorylation and Regulation of Akt/PKB by the Rictor-mTOR Complex. Science. 2005;307:1098–1101. doi: 10.1126/science.1106148. [DOI] [PubMed] [Google Scholar]
- 227.Sebastian D, et al. Mitofusin 2 (Mfn2) links mitochondrial and endoplasmic reticulum function with insulin signaling and is essential for normal glucose homeostasis. Proc Natl Acad Sci USA. 2012;109:5523–5528. doi: 10.1073/pnas.1108220109. [DOI] [PMC free article] [PubMed] [Google Scholar]
- 228.Arruda AP, et al. Chronic enrichment of hepatic endoplasmic reticulum-mitochondria contact leads to mitochondrial dysfunction in obesity. Nat Med. 2014;20:1427–1435. doi: 10.1038/nm.3735. [DOI] [PMC free article] [PubMed] [Google Scholar]
- 229.Hijmans BS, Grefhorst A, Oosterveer MH, Groen AK. Zonation of glucose and fatty acid metabolism in the liver: mechanism and metabolic consequences. Biochimie. 2014;96:121–129. doi: 10.1016/j.biochi.2013.06.007. [DOI] [PubMed] [Google Scholar]
- 230.Lee WL, Klip A. Endothelial transcytosis of insulin: does it contribute to insulin resistance? Physiology (Bethesda) 2016;31:336–345. doi: 10.1152/physiol.00010.2016. [DOI] [PubMed] [Google Scholar]
- 231.Rask-Madsen C, Kahn CR. Tissue-specific insulin signaling, metabolic syndrome, and cardiovascular disease. Arterioscler Thromb Vasc Biol. 2012;32:2052–2059. doi: 10.1161/ATVBAHA.111.241919. [DOI] [PMC free article] [PubMed] [Google Scholar]
- 232.King G, Johnson S. Receptor-mediated transport of insulin across endothelial cells. Science. 1985;227:1583–1586. doi: 10.1126/science.3883490. [DOI] [PubMed] [Google Scholar]
- 233.Wang H, Liu Z, Li G, Barrett EJ. The vascular endothelial cell mediates insulin transport into skeletal muscle. Am J Physiol Endocrinol Metab. 2006;291:E323–E332. doi: 10.1152/ajpendo.00047.2006. [DOI] [PubMed] [Google Scholar]
- 234.Vicent D, et al. The role of endothelial insulin signaling in the regulation of vascular tone and insulin resistance. J Clin Invest. 2003;111:1373–1380. doi: 10.1172/JCI15211. [DOI] [PMC free article] [PubMed] [Google Scholar]
- 235.Kubota T, et al. Impaired insulin signaling in endothelial cells reduces insulin-induced glucose uptake by skeletal muscle. Cell Metab. 2011;13:294–307. doi: 10.1016/j.cmet.2011.01.018. [DOI] [PubMed] [Google Scholar]
- 236.Tsuchiya K, Accili D. Liver sinusoidal endothelial cells link hyperinsulinemia to hepatic insulin resistance. Diabetes. 2013;62:1478–1489. doi: 10.2337/db12-1296. [DOI] [PMC free article] [PubMed] [Google Scholar]
- 237.Pajvani UB, et al. Inhibition of Notch signaling ameliorates insulin resistance in a FoxO1-dependent manner. Nat Med. 2011;17:961–967. doi: 10.1038/nm.2378. [DOI] [PMC free article] [PubMed] [Google Scholar]
- 238.Pajvani UB, et al. Inhibition of Notch uncouples Akt activation from hepatic lipid accumulation by decreasing mTorc1 stability. Nat Med. 2013 doi: 10.1038/nm.3259. [DOI] [PMC free article] [PubMed] [Google Scholar]
- 239.Bi P, Kuang S. Notch signaling as a novel regulator of metabolism. Trends Endocrinol Metab. 2015;26:248–255. doi: 10.1016/j.tem.2015.02.006. [DOI] [PMC free article] [PubMed] [Google Scholar]
- 240.Titchenell PM, Lazar MA, Birnbaum MJ. Unraveling the regulation of hepatic metabolism by insulin. Trends Endocrinol Metab. 2017 doi: 10.1016/j.tem.2017.03.003. [DOI] [PMC free article] [PubMed] [Google Scholar]
- 241.Mueckler M. Family of glucose-transporter genes. Implications for glucose homeostasis and diabetes. Diabetes. 1990;39:6–11. doi: 10.2337/diacare.39.1.6. [DOI] [PubMed] [Google Scholar]
- 242.Thorens B, Charron MJ, Lodish HF. Molecular physiology of glucose transporters. Diabetes Care. 1990;13:209–218. doi: 10.2337/diacare.13.3.209. [DOI] [PubMed] [Google Scholar]
- 243.Cross DA, Alessi DR, Cohen P, Andjelkovich M, Hemmings BA. Inhibition of glycogen synthase kinase-3 by insulin mediated by protein kinase B. Nature. 1995;378:785–789. doi: 10.1038/378785a0. [DOI] [PubMed] [Google Scholar]
- 244.Scott PH, Brunn GJ, Kohn AD, Roth RA, Lawrence JC., Jr Evidence of insulin-stimulated phosphorylation and activation of the mammalian target of rapamycin mediated by a protein kinase B signaling pathway. Proc Natl Acad Sci USA. 1998;95:7772–7777. doi: 10.1073/pnas.95.13.7772. [DOI] [PMC free article] [PubMed] [Google Scholar]
- 245.Kitamura T, et al. Forkhead protein FoxO1 mediates Agrp-dependent effects of leptin on food intake. Nat Med. 2006;12:534–540. doi: 10.1038/nm1392. [DOI] [PubMed] [Google Scholar]