

Abstract
Current clinical practice in programming a cochlear implant (CI) for individuals with single-sided deafness (SSD) is to maximize the transmission of speech information via the implant, with the implicit assumption that this will also result in improved spatial-hearing abilities. However, binaural sensitivity is reduced by interaural place-of-stimulation mismatch, a likely occurrence with a standard CI frequency-to-electrode allocation table (FAT). As a step toward reducing interaural mismatch, this study investigated whether a test of interaural-time-difference (ITD) discrimination could be used to estimate the acoustic frequency yielding the best place match for a given CI electrode. ITD-discrimination performance was measured by presenting 300-ms bursts of 100-pulses-per-second electrical pulse trains to a single CI electrode and band-limited pulse trains with variable carrier frequencies to the acoustic ear. Listeners discriminated between two reference intervals (four bursts each with constant ITD) and a moving target interval (four bursts with variable ITD). For 17 out of the 26 electrodes tested across eight listeners, the function describing the relationship between ITD-discrimination performance and carrier frequency had a discernable peak where listeners achieved 70% to 100% performance. On average, this peak occurred 1.15 octaves above the CI manufacturer’s default FAT. ITD discrimination shows promise as a method of estimating the cochlear place of stimulation for a given electrode, thereby providing information to optimize the FAT for SSD-CI listeners.
Keywords: bimodal, binaural hearing, hearing loss, unilateral, sound localization, spatial hearing
Introduction
Binaural hearing provides significant advantages for normal-hearing (NH) listeners in complex auditory environments. People with single-sided deafness (SSD; one deaf ear and one NH ear) are deprived of these benefits. Traditionally, the only treatment options for SSD were hearing-aid devices that transmit sounds from a microphone on the side of the deaf ear to the hearing ear via bone conduction (osseointegrated hearing aid) or wireless link (contralateral routing of signal hearing aid; Arndt et al., 2011; Baguley, Bird, Humphriss, & Prevost, 2006). Recently, cochlear implants (CIs) have begun to emerge as a possible treatment option for SSD, restoring some auditory function to the deaf ear and providing the opportunity to access some of the binaural benefits that having two functioning ears can provide (Arndt et al., 2011; Hansen, Gantz, & Dunn, 2013; Vermeire & Van de Heyning, 2009; Zeitler et al., 2015).
Despite the advantages that CIs can provide to listeners with SSD, the benefits are modest relative to bilaterally NH listeners. SSD-CI listeners demonstrate improved sound-localization abilities (e.g., Erbele, Bernstein, Schuchman, Brungart, & Rivera, 2015; Zeitler et al., 2015), but they are sensitive only to interaural level differences (ILDs) and not to interaural time differences (ITDs; Dorman et al., 2015). For speech understanding in noise, SSD-CI listeners receive a 2- to 5-dB head-shadow benefit from the CI in conditions where the implanted deaf ear has access to a better signal-to-noise ratio (SNR) than the acoustic ear (Arndt et al., 2011; Bernstein, Schuchman, & Rivera, 2017; Firszt, Holden, Reeder, Cowdrey, & King, 2012; Vermeire & Van de Heyning, 2009). SSD-CI listeners show little evidence of binaural squelch (i.e., a benefit from adding the CI in spatial conditions where the CI ear has a poorer SNR than the acoustic ear) for speech understanding in noise (Arndt et al., 2011), although squelch has been demonstrated under conditions involving interfering talkers of the same gender as the target speech (Bernstein, Goupell, Schuchman, Rivera, & Brungart, 2016, Bernstein et al., 2017) where monaural cues are insufficient to facilitate the perceptual separation of the concurrent voices. Even then, Bernstein et al. (2016) reported considerable intersubject variability in performance, with some listeners receiving more than 5 dB of binaural benefit, and others receiving none.
One possible reason for the limited binaural benefits provided by the CI is that for most SSD-CI listeners, there is likely an interaural mismatch in the cochlear places of stimulation between the acoustic and CI ears (here termed ”interaural place mismatch„). This place mismatch arises because the electrode array is not fully inserted into the cochlea, but CIs are typically programmed in the clinic to provide the listener with the full speech bandwidth between about 200 and 8000 Hz. Landsberger, Svrakic, Roland, and Svirsky (2015) examined radiographs from 92 CI patients implanted with devices from the three major manufacturers and found that on average, there was a 4- to 5-mm shift between the frequency allocated to a given electrode and the best frequency associated with the spiral-ganglion neurons closest to that electrode location (Stakhovskaya, Sridhar, Bonham, & Leake, 2007). Landsberger et al. (2015) also conducted a meta-analysis of insertion angles for 661 CI patients reported in the literature; based on this analysis, Wess, Brungart, and Bernstein (2017) estimated the range of interaural place mismatch for 95% (i.e., the mean ± 2 SDs) of SSD-CI listeners to be −0.5 to 11 mm (−0.1 to 2.2 octaves).
For traditional CI patients with limited acoustic hearing in the contralateral ear, mapping the full speech bandwidth to the available electrodes is clearly the most sensible approach because the primary purpose of the CI is to maximize the speech understanding that can be achieved. Any mismatch between the cochlear place of electrical stimulation and the place of acoustic stimulation in a CI ear is at least partly overcome as the CI user learns the pattern of place-shifted speech cues over time (Svirsky, Fitzgerald, Sagi, & Glassman, 2015). But for SSD-CI listeners, the CI plays a very different role and is secondary to the acoustic-hearing ear that already provides high-acuity speech information. Instead, we argue that the main reason for the CI is to provide spatial-hearing advantages. An interaural place mismatch is detrimental to these advantages. Binaural computations require frequency-matched inputs from the two ears (Batra & Yin, 2004; Joris, Smith, & Yin, 1998; Smith & Delgutte, 2007). For bilateral (BI) CI listeners, interaural place mismatch has been shown to reduce binaural sensitivity (Hu & Dietz, 2015; Kan, Litovsky, & Goupell, 2015; Kan, Stoelb, Litovsky, & Goupell, 2013; Poon, Eddington, Noel, & Colburn, 2009). NH listeners show reduced ILD sensitivity for frequency-mismatched uncorrelated noise bands (Francart & Wouters, 2007) and acoustic pulse trains (Goupell, Stoelb, Kan, & Litovsky, 2013). Vocoder simulations of SSD-CI listening have shown that interaural place mismatch can reduce subjectively reported binaural fusion (Aronoff, Shayman, Prasad, Suneel, & Stelmach, 2015; Suneel, Staisloff, Shayman, Stelmach, & Aronoff, 2017), the binaural integration of speech information (Ma, Morris, & Kitterick, 2016), and the ability to perceptually separate concurrent speech (Wess et al., 2017). These results suggest that SSD-CI listeners might benefit if the CI frequency-allocation table (FAT) were adjusted to deliver each acoustic frequency to the electrode that is stimulating the spiral ganglia corresponding to the basilar membrane location that is naturally tuned to that frequency.
To provide the best possible interaural place match would require knowledge of the cochlear place of stimulation for each electrode. There are several possible ways that have been proposed to identify the place of electrical stimulation. Estimates of insertion angle based on radiographic images could be used to estimate the spiral ganglia most likely to be stimulated by a given electrode (Landsberger et al., 2015; Stakhovskaya et al., 2007). However, these estimates do not account for the other factors that determine which spiral ganglia are stimulated, such as the degree of neural survival and the complex interaction between the electric field and cochlear structures (e.g., Kalkman, Briaire, Dekker, & Frijns, 2015). Pitch matching can be used to identify the acoustic frequency that best matches the place pitch associated with a given electrode (Boëx et al., 2006; Dorman et al., 2007; Schatzer et al., 2014; Vermeire et al., 2008; Zeng, Tang, & Lu, 2014). However, interaural pitch matches may be susceptible to cortical plasticity (Reiss et al., 2015; Reiss, Ito, Eggleston, & Wozny, 2014a; Reiss, Turner, Karsten, & Gantz, 2014b) and testing range biases (Carlyon et al., 2010), and therefore may not fully reflect the cochlear place of excitation. If the ultimate goal of a test of interaural mismatch is to improve binaural sensitivity, the most direct way to accomplish this would be to use a test of binaural performance. BI-CI listeners are sensitive to ITDs—the small difference in the arrival times of stimulus pulses at the two ears. Several studies have shown that ITD sensitivity is reduced for BI-CI listeners when there is an interaural place mismatch (Hu & Dietz, 2015; Kan et al., 2013, 2015; Smith & Delgutte, 2007).
The literature regarding ITD processing for SSD-CI listeners is much more limited than for BI-CI listeners. Dorman et al. (2015) found that SSD-CI listeners were not sensitive to ITDs for free-field sound sources. However, bimodal CI users—who use a hearing aid in an ear with limited residual acoustic hearing that is contralateral to the CI—have been shown to be sensitive to ITDs in studies using well-controlled laboratory stimuli (Francart, Brokx, & Wouters, 2009; Francart, Lenssen, & Wouters, 2011, 2014). Francart et al. (2009) provided preliminary evidence from two bimodal CI listeners that ITD discrimination was frequency selective. Therefore, we hypothesized that SSD-CI listeners should also be able to perform ITD discrimination for electric and acoustic pulse-train stimulation. The goal of this study was to determine whether SSD-CI listeners are sensitive to ITDs, and if so, the extent to which ITD sensitivity is frequency selective. ITD discrimination was measured with pulse trains delivered to a single CI electrode and band-limited acoustic pulse trains delivered to the acoustic-hearing ear. The acoustic carrier frequency was varied parametrically to determine whether this approach would yield a clear peak in performance at a certain frequency. If so, the results would provide proof of concept for a perceptual estimate of the optimal acoustic frequency to which a CI electrode should be tuned to maximize binaural sensitivity for SSD-CI listeners.
Methods
Listeners
Eight male SSD-CI listeners participated in the experiment. Table 1 provides demographic and device information, and Table 2 provides audiometric and hearing-aid information for the listeners. Six of the listeners had normal or near-normal hearing in the ear contralateral to the CI (audiometric thresholds no greater than 25 dB HL at octave frequencies between 250 and 4000 Hz). The other two listeners had mild-to-moderate hearing loss in the ear contralateral to the CI. While these two individuals normally wore a hearing aid, they did not use their hearing aid for this study. One listener (S4) also had residual acoustic hearing in the implanted ear and wore a hearing aid in that ear as part of a hybrid CI system; however, all testing was done with direct electrical stimulation, and thus, no acoustic signal was presented to the CI ear. Five of the listeners used Cochlear Ltd. devices, and the other three used Med-El devices. Six listeners were tested at Walter Reed National Military Medical Center, and two were tested with an identical test system at the University of Maryland, College Park. The study was approved by the Institutional Review Boards of Walter Reed National Military Medical Center and the University of Maryland, College Park, and all listeners provided written informed consent.
Table 1.
Demographic information and information regarding the CI ear for the eight participants.
| Listener | Sex | Age | CI ear | Duration of deafness (years) | CI experience (years) | CI brand | Electrode array | Etiology |
|---|---|---|---|---|---|---|---|---|
| S1 | M | 58 | L | 21 | 5 | Cochlear | CI24RE | Sudden SNHL |
| S2 | M | 47 | L | 14 | 3 | Cochlear | CI24RE | Endolymphatic shunt surgery |
| S3 | M | 69 | R | 0.75 | 7 | Cochlear | CI512 | Unknown |
| S4 | M | 52 | L | 3 | 1 | Cochlear | CI522 | Sudden SNHL |
| S5 | M | 59 | R | 8 | 2 | MED-EL | Flex28 | Sudden SNHL |
| S6 | M | 38 | R | 0.25 | 4 | MED-EL | Flex28 | Sudden SNHL |
| S7 | M | 45 | R | 22 | 4 | MED-EL | Flex28 | Enlarged vestibular aqueduct; Trauma |
| S8 | M | 46 | L | 0.75 | 2 | Cochlear | CI422 | Semicircular canal dehiscence; Meniere’s |
Note. CI = cochlear implant; SNHL = sensorineural hearing loss.
Table 2.
Acoustic-ear air-conduction thresholds for the eight participants for the ear contralateral to the CI, and for the ipsilateral ear for listener S4 who had residual acoustic hearing in the CI ear.
| Listener | Audiometric threshold (dB HL) |
Hearing aid? | |||||||
|---|---|---|---|---|---|---|---|---|---|
| 250 | 500 | 1000 | 2000 | 3000 | 4000 | 6000 | 8000 Hz | ||
| S1 | 10 | 10 | 0 | 15 | 15 | 15 | 20 | 20 | No |
| S2 | 10 | 5 | 0 | 0 | 15 | 15 | 25 | 30 | No |
| S3 | 10 | 10 | 20 | 15 | 10 | 20 | DNT | 25 | No |
| S4 Contralateral ear | 20 | 20 | 30 | 40 | 45 | 35 | 25 | 45 | Yes |
| CI ear | 50 | 75 | 95 | 105 | NR | 115 | 100 | 95 | Yes |
| S5 | 15 | 10 | 10 | 10 | 30 | 30 | 20 | 15 | Yes |
| S6 | 10 | 15 | 15 | 0 | 10 | 20 | 20 | 25 | No |
| S7 | 5 | 10 | 10 | 15 | 25 | 25 | 15 | 20 | No |
| S8 | 15 | 15 | 15 | 15 | 25 | 20 | 40 | 10 | No |
Note. CI = cochlear implant; DNT = did not test; NR = no response.
Procedure
The goal of the current study was to identify the acoustic frequency that yielded maximum ITD sensitivity. Because of the expected differences in the amount of time for the CI sound processor to deliver electrical stimulation and the latencies associated with cochlear processing, it was difficult to know a priori the correct range of ITDs to present to allow for successful ITD discrimination performance. Optimal ITD sensitivity for bilaterally NH listeners occurs for reference ITDs around zero (e.g., Koehnke, Culotta, Hawley, & Colburn, 1995), NH listeners are sensitive to ITD differences on the order of tens of microseconds (e.g., Klumpp & Eady, 1956), and the maximum ITD that can occur in the free field is approximately 700 µs (Kuhn, 1977). In practice, SSD-CI listeners are likely to experience enormous difficulty in making use of ITD information due to the long delays of the sound processor (on the order of milliseconds; Wess et al., 2017; Zirn, Arndt, Aschendorff, & Wesarg, 2015) relative to the maximum physiological plausible range (less than 1 ms). Even though the delay associated with traveling wave in the acoustic ear (1–10 ms) will tend to offset the sound-processor delay (Zirn et al., 2015), the longest cochlear delays are associated with low frequencies, whereas delays for the frequencies tested here (>1 kHz) are probably no longer than 1 to 2 ms (Ruggero & Tempkin, 2007). (The delays associated with the sound processor are discussed later in the Reference and Signal Interval ITDs section.) Therefore, no attempt was made to test ITD discrimination in the physiologically plausible range. Rather, the stimuli (discussed in detail later) were chosen to produce salient changes in intracranial location for ITDs larger than 1 ms. Furthermore, the uncertainty of the interaural delay complicated our ability to carry out a traditional left–right discrimination task (e.g., Kan et al., 2013), which would require a time-consuming process of perceptual image centering (Francart et al., 2014) before an ITD discrimination task could proceed. Instead, we employed an ITD change-discrimination task based on Hopkins and Moore (2010), whereby listeners were presented with several groups of pulse-train bursts and were required to detect the group that had a change in ITD.
ITD change sensitivity was measured using a three-interval two-alternative forced-choice procedure. A schematic example of one ITD change-detection trial is shown in Figure 1. On each trial, each of the three intervals contained a group of four bilateral pulse-train bursts (i.e., 12 pulse-train bursts per trial). In the two reference intervals (i.e., the first two groups of four bursts each in Figure 1), the ITD was held constant across the four bursts in the group. In the target interval group (i.e., the last group of four bursts in Figure 1), the ITD varied across the four bursts in the group. The listener’s task was to identify which of the three interval groups contained the sounds that were “moving” or “changing.” The listener was instructed that the target would occur only in the second or third interval group; the first interval group never contained the moving stimulus. Following each response, the listener was given correct/incorrect feedback.
Figure 1.

An example trial in the ITD discrimination paradigm employed in the study. In this three-interval, two-alternative forced-task, two reference intervals each contained a group of four pulse trains with constant ITD, and the target interval (either the second or third interval) contained a group of four pulse trains with variable ITD. ITD = interaural time difference.
The target interval group contained a range of ITDs. In most cases, this range of ITDs covered four equally spaced points in the 10-ms period of the 100-pps pulse train (e.g., −3.75, −1.25, 1.25, 3.75 ms), although the size of the change in ITDs was adjusted for some listeners (see Reference and Signal Interval ITDs section). The reference interval groups contained the same ITD for all four bursts in each group (e.g., 0 ms). In Figure 1, these example ITD values are referenced to a “global ITD reference” that was set to offset the expected difference in processing times between the CI and acoustic-hearing ears, which will be discussed later. The duration of each pulse-train burst was either 250 or 300 ms (i.e., 25 or 30 consecutive pulses at 100 pps), with the value held constant for each listener. The four bursts in a group were each separated by an interburst interval of 50 ms. The three interval groups were separated by 500 ms. Even though the ITDs tested were much larger than the maximum physiological ITD associated with a sound source arising from 90° on side of the head, it is well known that the lateralization of a sound source can be produced by ITDs larger than the physiological range than that introduced by the head (Mossop & Culling, 1998; Yost, Dye, & Sheft, 2007). For example, Mossop and Culling found that NH listeners could lateralize envelope ITDs as large as 3.5 ms for noise stimuli that were high-pass filtered above 1500 Hz or higher, and fine-structure ITDs as large as 10 ms for stimuli that contained energy below 1000 Hz. Majdak, Laback, and Baumgartner (2006) found that BI-CI listeners could lateralize ITDs as large as half of the period of a 100-pps pulse train (i.e., 5 ms): as the interaural phase difference (IPD) was adjusted across the full period of a 100-pps pulse train, the perceived location of the source shifted from the center (IPD = 0, ITD = 0), to one side (IPD = π/2, ITD = 2.5 ms), back to the center (IPD = π, ITD = 5 ms), then to the other side (IPD = 3π/2, ITD = 7.5 ms).
Acoustic Stimuli
For the NH ear, band-limited, constant-amplitude Gaussian-envelope tone (GET) acoustic pulse trains, or Gabor (1944) pulses, were generated as described by Goupell et al. (2013). These pulse trains were used to simulate electrical stimulation (Goupell, Majdak, & Laback, 2010) and allow for precise control over the pulse duration and bandwidth. GET pulses were generated in the time domain by applying a Gaussian-shaped envelope to a tonal carrier at the desired stimulation frequency. GET pulse trains were presented at a rate of 100 pps, with the duration of the individual pulses manipulated to generate an equivalent rectangular bandwidth of 1.5 mm as defined by Greenwood (1990). For each listener and CI electrode tested, a range of acoustic pulse-train carrier frequencies was tested, with the spacing between test carrier frequencies defined to be 1.5 mm apart along the cochlea. Figure 2 provides examples of the acoustic pulse-train stimuli for five of the acoustic carrier center frequencies (CFs) employed in the current study. Figure 2(a) shows the power spectra for each of the CFs, while Figure 2(b) shows the waveforms for two sequential pulses for these same stimuli. Note that as the carrier frequency increased, the individual pulses became temporally narrower because of the broader linear bandwidths of the stimuli required to stimulate the same 1.5-mm wide region of the cochlea. For carrier frequencies below 1000 Hz, the relatively narrow bandwidth (in Hz) yielded a pulse duration longer than 10 ms such that sequential pulses would substantially overlap in time (not shown). Therefore, carrier frequencies below 1000 Hz were not tested. This limitation prevented an estimate of the cochlear place of stimulation for the apical portion of the array. Acoustic stimulation was delivered using one channel of a Hammerfall DSP Multiface II sound card (RME Audio, Haimhausen, Germany) and HD280 pro circumaural headphones (Sennheiser, Wedemark, Germany).
Figure 2.

Example (a) power spectra and (b) waveforms for the acoustic pulse-train stimuli employed in the ITD discrimination experiment. Five example stimuli are shown, with carrier frequencies selected to be 1.5 mm apart on the Greenwood (1990) scale of the cochlear frequency-to-place map. CF indicates carrier center frequency.
Electric Stimuli
Two different methods were used to present constant-amplitude 100-pps pulse trains to the CI ear. The three MED-EL listeners were tested using an “auxiliary-input” method, where acoustic pulse trains were delivered directly to the CI sound processor. The five Cochlear listeners were tested using a “direct-stimulation” method, where electric pulse trains were delivered via a research processor using software that allowed for the exact specification of the electrical stimulation pattern.
Auxiliary-input method
For the auxiliary-input method, single-electrode sound-processor maps were generated to ensure that only one electrode was stimulated at a time. This was done by setting the comfort (C) level for all electrodes other than the desired electrode to zero in the clinical map. Then, the “desired” response band for the desired electrode was set to the maximum possible range, which resulted in an actual response band of 5049–8010 Hz. For each listener, three single-electrode maps were generated and loaded into a spare Opus 2 sound processor kept in the laboratory for research purposes. For each single-electrode map, the volume control was set to its maximum level, with the actual level of the stimulus adjusted by controlling the level of the acoustic stimulus that was delivered to the sound processor. To select an electrode during the experiment, the CI sound processor program was changed using a standard remote control. Acoustic pulse trains delivered on the second channel of the sound card were then delivered to the CI sound processor via the auxiliary input. The pulse-train bandwidth was fixed at 1.5 mm, while the carrier frequency was selected to be the center frequency of the electrode’s response band as defined in the clinical software (6529 Hz). Interaural time alignment was defined in terms of the relative timing of acoustic pulses at the headphone and the auxiliary input to the sound processor.
Direct-stimulation method
In the direct-stimulation method, electric pulse trains were delivered using a research processor, consisting of a Nucleus Freedom programming pod and an L34 sound processor and coil (Cochlear Ltd., Sydney, Australia). Custom MATLAB (Mathworks, Natick, MA) software using NIC2 software (Cochlear Ltd., Sydney, Australia) generated 100-pps monopolar stimulation on the desired CI electrode. The biphasic pulses were 108 µs in duration, with 50-µs anodic and cathodic phase durations separated by an 8-µs gap. Electric-acoustic synchronization was achieved by initiating the delivery of electric pulses with a trigger signal delivered to the programming pod set to “slave” mode. The trigger signal was generated via one channel of the RME Hammerfall DSP Multiface II (RME Audio, Haimhausen, Germany) soundcard, then passed through an amplifier (Tucker-Davis Technologies, Alachua, FL) before being delivered to the programming pod. The timing of the electrical pulses was calibrated by examining the electrical output from the Cochlear Freedom Implant Emulator (Cochlear Ltd., Sydney, Australia) that contains a CI internal device and associated resistive load to approximate the impedance inside the human cochlea. For an ITD of zero, the acoustic and electric signals were time aligned such that the center of each electrical pulse (at the electrode) was coincident with the center of each acoustic pulse (at the headphone transducer).
Loudness balancing
Before the ITD discrimination experiment, across-ear loudness balancing was performed to ensure that all of the stimuli presented were of roughly equal loudness. The procedure began with the experimenter adjusting the level of a stimulus presented to a single CI electrode up and down until the listener indicated that the stimulus was at a comfortable level. Then, for each acoustic carrier frequency tested in the experiment, two sequential pulse trains were presented, one to each ear. The loudness balancing was performed with sequential, rather than simultaneous stimulation of the two ears, because we did not want to allow any perceived lateralization of the stimulus due to an effectively nonzero ITD to affect the perceived relative stimulus levels in the two ears. The experimenter adjusted the level of the acoustic stimulus upward and downward in 1- to 3-dB steps, repeating the sequential presentation each time, until the listener indicated that the loudness of the CI and acoustic pulse trains were matched. This process was then repeated to set the levels for each acoustic pulse-train carrier frequency for each CI electrode tested for each listener. The resulting acoustic-stimulus levels for each electrode tested are shown in Table 3.
Table 3.
Reference and target interval ITDs for each electrode tested in the experiment.
| Listener | Stim method | Electrode | Mean acoustic level (dB SPL) | Interaural time difference (ms) |
|||||
|---|---|---|---|---|---|---|---|---|---|
| Reference bursts | Target bursts |
ITD Step | |||||||
| 1 | 2 | 3 | 4 | ||||||
| S1 | Direct | 15 | 65 | 1.500 | −2.250 | 0.250 | 2.750 | 5.250 | 2.500 |
| 12 | 61 | 0.000 | −7.500 | −2.500 | 2.500 | 7.500 | 5.000 | ||
| 8 | 62 | 1.500 | −2.250 | 0.250 | 2.750 | 5.250 | 2.500 | ||
| S2 | Direct | 14 | 53 | 1.500 | −2.250 | 0.250 | 2.750 | 5.250 | 2.500 |
| 10 | 58 | 1.500 | −2.250 | 0.250 | 2.750 | 5.250 | 2.500 | ||
| 6 | 58 | 1.500 | −2.250 | 0.250 | 2.750 | 5.250 | 2.500 | ||
| S3 | Direct | 10 | 65 | 0.000 | −3.750 | −1.250 | 1.250 | 3.750 | 2.500 |
| 7 | 64 | 0.000 | −3.750 | −1.250 | 1.250 | 3.750 | 2.500 | ||
| 4 | 66 | 0.000 | −3.750 | −1.250 | 1.250 | 3.750 | 2.500 | ||
| S4 | Direct | 14 | 69 | 1.500 | −6.000 | −1.000 | 4.000 | 9.000 | 5.000 |
| 10 | 68 | 1.500 | −6.000 | −1.000 | 4.000 | 9.000 | 5.000 | ||
| 7 | 63 | 1.500 | −6.000 | −1.000 | 4.000 | 9.000 | 5.000 | ||
| S5 | Auxiliary | 6 | 70 | −5.000 | −7.500 | −5.000 | −2.500 | 0.000 | 2.500 |
| 8 | 70 | −5.000 | −7.500 | −5.000 | −2.500 | 0.000 | 2.500 | ||
| 10 | 71 | −5.000 | −7.500 | −5.000 | −2.500 | 0.000 | 2.500 | ||
| S6 | Auxiliary | 6 | 66 | 0.000 | −3.750 | −2.500 | −1.250 | 0.000 | 1.250 |
| 8 | 40 | −5.000 | −7.250 | −5.750 | −4.250 | −2.750 | 1.500 | ||
| 11 | 47 | −2.500 | −6.250 | −3.750 | −1.250 | 1.250 | 2.500 | ||
| S7 | Auxiliary | 4 | 52 | −5.000 | −8.750 | −6.250 | −3.750 | −1.250 | 2.500 |
| 6 | 52 | −5.000 | −8.750 | −6.250 | −3.750 | −1.250 | 2.500 | ||
| 8 | 52 | −5.000 | −8.750 | −6.250 | −3.750 | −1.250 | 2.500 | ||
| S8 | Direct | 21 | 67 | 1.000 | −2.750 | −0.250 | 2.250 | 4.750 | 2.500 |
| 18 | 64 | 1.500 | 0.150 | 1.050 | 1.950 | 2.850 | 0.900 | ||
| 14 | 60 | 2.000 | 1.100 | 1.700 | 2.300 | 2.900 | 0.600 | ||
| 10 | 54 | 1.500 | 0.225 | 1.075 | 1.925 | 2.775 | 0.850 | ||
| 7 | 59 | 2.250 | 1.125 | 1.875 | 2.625 | 3.375 | 0.750 | ||
Note. Positive values indicate that the CI ear was delayed relative to the acoustic ear. The default ITD values in the reference interval were 1.5 ms (for direct simulation) or −5.0 ms (for auxiliary input). The default ITDs values in the target intervals were in 2.5-ms steps placed symmetrically around the reference interval. These values were adjusted when listeners either had difficulty performing the task above chance or performed near ceiling levels. ITD = interaural time difference; SPL = sound pressure level; CI = cochlear implant.
Reference and Signal Interval ITDs
The main parameter of interest in the experiment was the acoustic pulse-train carrier frequency. Measuring ITD discrimination performance as a function of this parameter directly addressed the main experimental question: Can ITD discrimination be used to identify an acoustic frequency in the NH ear that yields optimal sensitivity for a given CI electrode? To answer this question, it was important to be able to measure ITD sensitivity at a sufficient performance level to observe changes as a function of acoustic carrier frequency, but with performance still below ceiling level. To accomplish this, several stimulus parameters were adjusted in pilot tests for each listener and CI electrode tested until ITD discrimination performance exceeded 70% correct but was below 100% correct. These included (a) a global ITD reference that defined the fixed ITD value presented in the reference intervals and (b) the range of ITDs presented in the signal interval group symmetrically around the global ITD reference.
There is a large delay between the ears that occurs from the difference between the signal-processing time in the CI ear and the traveling wave delay in the acoustic ear. Based on personal communications with researchers at the major CI manufacturers, Wess et al. (2017) estimated that the interaural delay for SSD-CI listeners using a sound processor could be anywhere from 0.5 to 12.5 ms (with the CI ear delayed relative to the acoustic ear), depending on the manufacturer, the signal processing setting, and the frequencies involved. Francart et al. (2009, 2011, 2014) examined ITD discrimination for bimodal CI listeners (CI in one ear, acoustic hearing with severe sensorineural hearing loss in the other). They used direct stimulation in the CI ear (i.e., no clinical sound processor) and insert earphone presentation in the acoustic ear (i.e., no hearing aid). Participants perceived a click train at the midline when the CI signal was delayed 1.5 ms relative to the acoustic signal, suggesting that in the absence of a clinical CI sound processor, the acoustic-ear processing time was longer than the CI processing due to the cochlear traveling wave.
In the current experiment, pilot testing showed a substantial amount of intersubject variability in the difficulty of the task. There existed a large possible space of ITD parameters to examine for performance optimization: the ITD in the reference interval, the ITDs in the target interval, and the acoustic carrier frequency. Ideally, for each listener, electrode, and acoustic carrier frequency, careful adjustments of these parameters would have been made to identify the reference ITD to yield a centered image, then adjust the target ITD into the just-noticeable difference range, following the approach of Francart et al. (2009, 2011, 2014). However, given our intention to make measurements for multiple electrodes and multiple acoustic frequencies per electrode, and the difficulty that some listeners experienced in perceiving any change in intracranial sound image location, this approach would have been prohibitively time consuming. Instead, the approach we took was to begin with a default set of ITD parameters. Then, if a listener could not reliably perform the ITD discrimination task, these parameters were adjusted—by changing the reference ITD or increasing the size of the change in ITD in the target interval—until the listener was able to reliably perceive the changing ITD. Alternatively, if listener performance was consistently at or near ceiling levels, the ITD step size was decreased. For the direct-stimulation method, the default approach was to set the reference ITD to 1.5 ms, with the CI ear delayed relative to the acoustic ear to offset the traveling wave delay, following Francart et al. (2009, 2011, 2014). For the auxiliary-input method, the default approach was to fix the reference ITD to 5 ms (with the acoustic ear delayed relative to the CI ear), with the idea that this would offset the CI processing delay. In both cases, the four ITDs in the signal interval were then placed symmetrically around this reference ITD in 2.5-ms steps (e.g., 1.25, 3.75, 6.25, and 8.75 ms). The reference and target ITD values ultimately selected for each listener and electrode tested are provided in Table 3.
After the experiment was completed, the delay caused by the processor and the variability of the timing of the CI electrical stimulus was estimated for the Med-El external sound processor and single-channel maps employed in the experiment using a RIB Detector Box (MED-EL, Innsbruck, Austria). The mean delay and variability relative to the acoustic stimulus were estimated by presenting 100 pulse-train stimuli to each of the three electrodes tested for the three auxiliary-input listeners. The envelopes of the electrical pulse-train output and acoustic pulse train were derived via full-wave rectification and low-pass filtering (500 Hz, sixth-order Butterworth), and the timing of the envelope peak extracted from the envelope. Across the nine electrodes tested, the mean delay of the electrical stimulation with respect to the acoustic stimulus was 557 µs. This means that the sound-processor delay was much shorter than the default 5-ms reference ITD that was selected for the auxiliary-input method. The standard deviations of this delay across 100 trials ranged from 55 to 106 µs across the nine electrodes tested.
Results
The results of the ITD experiment are plotted in Figures 3 to 5. Results for listeners S1 to S4 are shown in Figure 3; S5 to S7 in Figure 4; and S8 in Figure 5. Each column shows the results for one listener. The three electrodes tested (or five electrodes tested for listener S8) are arranged top to bottom from the most apical (lowest frequency) to the most basal (highest frequency) electrode tested. In each panel, the proportion correct in identifying the interval with variable ITD is plotted as a function of the carrier frequency of the pulse train presented to the acoustic ear. Filled circles represent conditions where the percentage-correct value was significantly greater than chance (50%) as estimated using a binomial test.
Figure 3.

ITD discrimination results for listeners S1, S2, S3, and S4. Each column plots the results for one listener. Each panel in the column represents a different CI reference electrode, arranged from top to bottom for subsequently more basal (i.e., higher frequency) electrodes. Curves represent fits of a skewed-normal function to the proportion-correct data. Fitted curves are absent in panels where a fit was not possible due to multiple peaks or other response functions that did not conform to the skewed-normal model. Arrows and vertical-dotted lines indicate the estimate of the acoustic carrier frequency that yielded the best ITD discrimination performance for a given reference electrode. Filled circles indicate conditions were performance was significantly above chance. S = subject; E = electrode. ITD = interaural time difference; CI = cochlear implant.
Figure 4.

Same as Figure 3 but for listeners S5, S6, and S7. S = subject; E = electrode.
Figure 5.
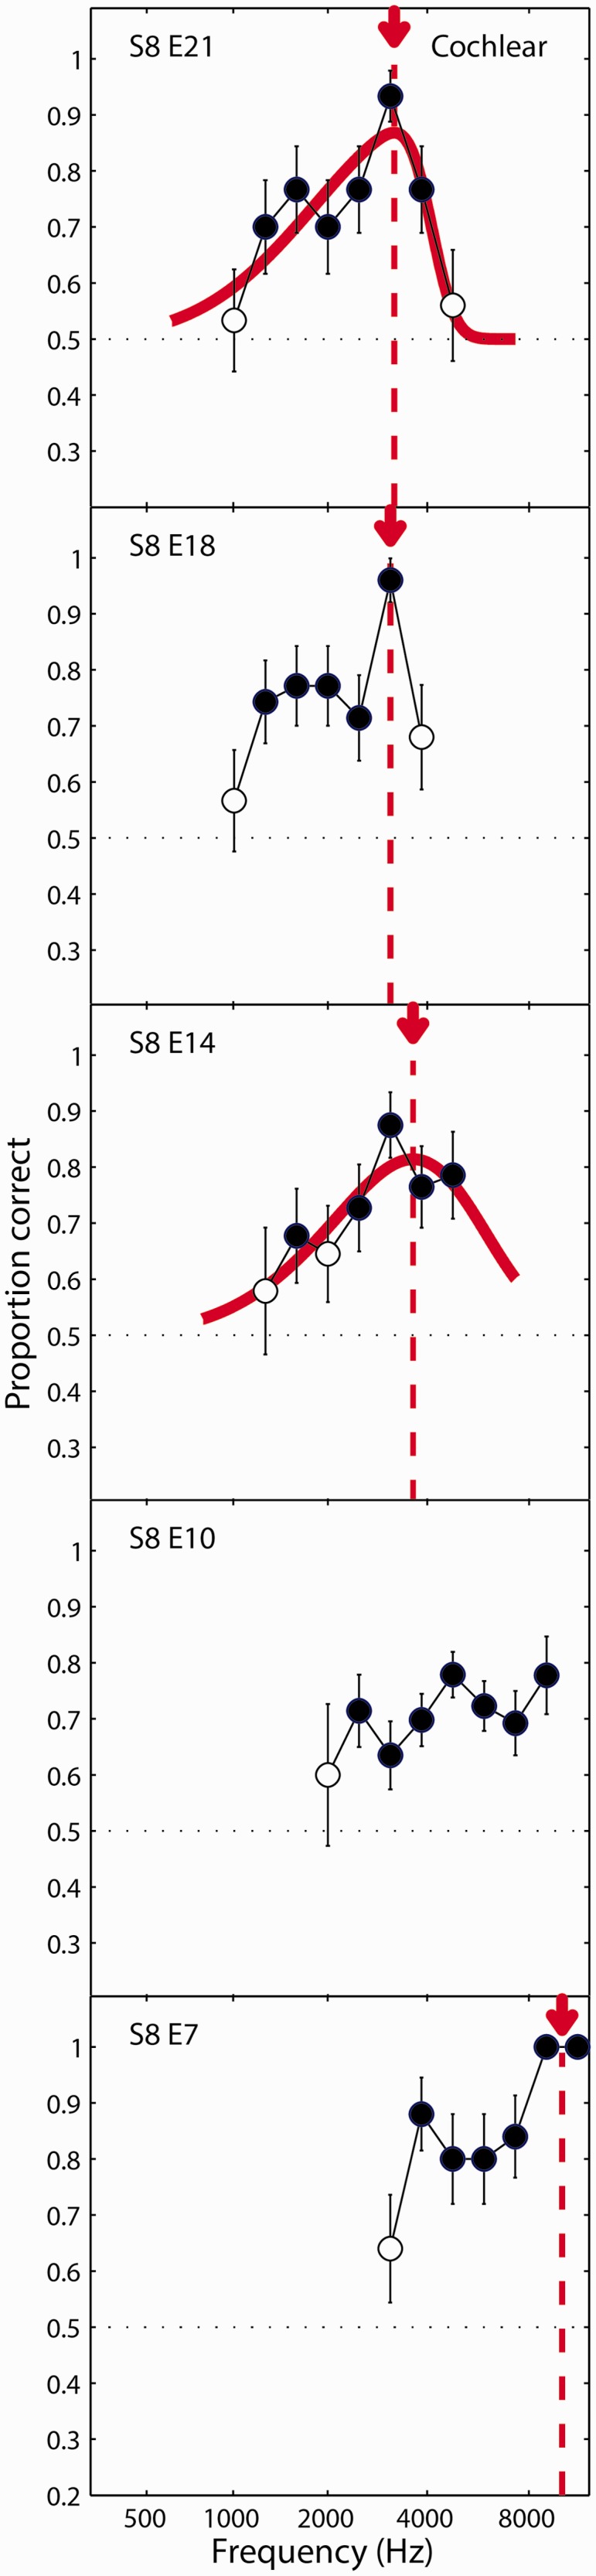
Same as Figure 3 but for listener S8 who was tested on five reference electrodes. S = subject; E = electrode.
To derive an estimate of the acoustic carrier frequency yielding the best ITD sensitivity, the percentage-correct data for each electrode were fit with a skewed-Gaussian function consisting of a standard normal probability-distribution function (φ), multiplied by a standard normal cumulative-distribution function :
| (1) |
where PC indicates the proportion correct, d indicates the Greenwood (1990) cochlear position associated with the acoustic carrier frequency, and four free parameters describe the skewness (α) of the overall skewed-Gaussian function, and the center (m), bandwidth (σ), and amplitude (A) of the underlying function φ.
For all but one of the electrodes tested, listeners could perform the ITD discrimination test above chance for at least one acoustic carrier frequency. For 14 out of the 26 electrodes, the performance function could be reasonably fit by the skewed-Gaussian function. In these cases, the place-matched frequency was taken to be the acoustic carrier frequency associated with the peak of the fitted function. For the 12 other electrodes, a reasonable fit could not be obtained. In these cases, a test for the difference between proportions was used to determine whether the peak performance was significantly greater than the next highest local minimum in the performance function. For the three electrodes where this was found to be the case, the place-matched frequency was taken to be the acoustic carrier frequency yielding the maximum performance (S6, E6, Figure 4; S8, E18, Figure 5), or the midpoint between the two carrier frequencies in the maximum performance plateau (S8, E7, Figure 5). Thus, an estimate of the best ITD frequency could be obtained for 17 out of 26 (65%) of the electrodes tested, and for at least one electrode for each of the eight listeners. For the other nine electrodes, a match was not estimated. In at least four of these cases, there appeared to be two prominent peaks in the function (S2, E6 and S3, E4 in Figure 3; S6, E8 and S6, E11 in Figure 4). For the purposes of providing an SSD-CI listener with a place-matched FAT, it might be possible to identify which of these peaks should guide the frequency remapping by making an a priori assumption that the peak frequencies should increase for progressively more basal electrodes. However, for the analyses presented here, it was desirable not to bias the results based on this expectation. Therefore, these electrodes were not considered in the following summary analysis.
The precision of each of the 17 place-match estimates was characterized in terms of the half width of the performance function—that is, the range of frequencies that yielded performance that was greater than halfway between 50% correct and the peak of the function. This frequency range was converted to equivalent millimeters along the length of the cochlea (Greenwood, 1990) and expressed as ± the average of the half widths associated with the upper and lower slopes of the function. For the 14 skewed-normal-fitted electrodes, this range was calculated using the fitted curve. For the other three electrodes that generated place-matched estimates, this range was calculated by linearly interpolating the performance functions (on a millimeter scale) between adjacent test frequencies. The mean precision for the 17 electrodes was ±3.20 mm (SD =1.56 mm), which is equivalent to ±0.67 octaves.
Figure 6(a) shows the relationship between the place-matched estimates and the standard FAT center frequency for the 17 electrodes for which a single best ITD frequency estimate was obtained (i.e., those panels containing a vertical dashed line in Figures 3 to 5). Also plotted on Figure 6(a) are published estimates of the mean cochlear place of stimulation for individual CI electrodes based on radiographic images for MED-EL Flex28 and Cochlear Contour Advance CI patients (Landsberger et al., 2015). These sample-mean estimates were generated by determining the insertion angles for each electrode in the array, then translating the angles into an equivalent acoustic-stimulus frequency using the spiral-ganglion map established by Stakhovskaya et al. (2007). For the five listeners where a best ITD frequency was estimated for more than one electrode, the best frequency monotonically increased as the stimulating electrode shifted from more apical to more basal portions of the cochlea. The slope of this increase (mean ± SD = 1.03 ± 0.51 oct/oct) was similar to what would be expected if the best ITD frequency matched the standard FAT (1 oct/oct, solid diagonal line) or the sample-mean electrode position described by Landsberger et al. (2015) for electrodes with standard center frequencies between 500 and 4000 Hz (Cochlear: 1.07 oct/oct, MED-EL 1.15 oct/oct; dashed and dotted curves). The mean (± SD) estimated best ITD frequency across the 17 electrodes was 1.15 ± 0.87 octaves above the standard FAT, but only 0.24 ± 0.86 octaves above the Landsberger et al. (2015) sample-mean X-ray-based estimates of electrode position. However, there was a large degree of intersubject variability in the relative shift of the best ITD frequency with respect to these two predictions. For one listener (S3), the best ITD frequency was below the standard FAT. For four listeners (S1, S4, S7, and S8), the best ITD frequency was close to or greater than the X-ray-based estimates of electrode position. For the other three listeners (S2, S5, and S6), the best ITD frequency fell between these two limits.
Figure 6.

Estimates of the acoustic carrier frequency yielding the best ITD-discrimination peformance for the 17 electrodes that showed a clear performance peak. The best ITD frequency is plotted against the center frequency associated with each electrode for (a) a standard FAT recommended by the CI manufacturer, or for (b) the clinical FAT in each listener’s everyday sound processor. The solid diagonal line in each panel represents the expected best ITD frequency if it were equal to the respective CI FAT. The dotted and dashed curves in panel (a) represent the interaurally place-matched frequency that would be expected based on radiographic group-average electrode insertion angle data reported by Landsberger et al. (2015). FAT = frequency-to-electrode allocation table; ITD = interaural time difference; CI = cochlear implant.
In their everyday clinical sound processors, three of the listeners (S3, S4, and S5) used everyday FATs that were close to the standard default settings provided by the CI manufacturers (Figure 7). However, the other five listeners (S1, S2, S6, S7, and S8) had clinical FATs that differed substantially from the manufacturer’s recommendation. The reason was that a large number of basal channels were deactivated because they produced discomfort or vestibular symptoms (S2, S7, and S8), or because the clinical audiologist had modified the FAT in the course of their clinical treatment (S1, S2, S6, and S8). Figure 6(b) plots the same place-matched estimates from Figure 6(a), but in this case relative to each listener’s actual clinical-FAT center frequency for each electrode. Consistent with Figure 6(a), Figure 6(b) shows that the best ITD frequencies were roughly similar to each listener’s clinical FAT for three listeners (S2, S3, and S6) but were generally higher than the clinical FAT for the other five listeners. The mean difference (±SD) between the best ITD frequency and the clinical FAT was 0.50 ± 0.81 octaves (Figure 6(b)), smaller than the 1.15-octave mean difference between the best ITD frequency and the standard FAT (Figure 6(a)).
Figure 7.

Clinical FATs used on a daily basis by each of the eight listeners are plotted as a function of the standard default FATs recommended by the CI manufacturers. The dotted and dashed lines represent hypothetical frequency allocations that would match the radiographic group-average electrode insertion angle data reported by Landsberger et al. (2015). FAT = frequency-to-electrode allocation table; CI = cochlear implant.
Discussion
Summary and Interpretation of Study Findings
The goals of this study were (a) to determine whether SSD-CI listeners are sensitive to changes in ITD for electrically and acoustically presented pulse trains and (b) if so, to determine whether ITD sensitivity is frequency tuned. The results demonstrate that SSD-CI listeners are sensitive to changes in ITD for band-limited stimuli and that in many cases (65% of the electrodes tested), ITD sensitivity is clearly frequency tuned (Figures 3 to 5). This means that the ITD discrimination task can be used to estimate the acoustic frequency to which a given CI electrode should be tuned to yield the best possible ITD sensitivity. ITD sensitivity for listeners with a CI in one ear and acoustic hearing in the other ear has been demonstrated previously (Francart et al., 2009, 2011, 2014). The dependence of ITD sensitivity on the relative cochlear places of stimulation for single-electrode stimulation has also been demonstrated previously for BI-CI listeners (Hu & Dietz, 2015; Kan et al., 2013) and in a pilot study for two bimodal CI listeners (Francart et al., 2009). The current results extend these findings by demonstrating a cochlear-place dependence of ITD sensitivity for multiple individual electrodes in a group of eight SSD-CI listeners.
One key finding in this study was that the ITD place-matched estimates were generally higher than the standard or clinical CI FAT and closer to what the sample-mean insertion-angle data would suggest (Figure 6). In other words, the ITD-based estimates of the optimal electrode frequency allocation more closely reflect the presumed position of the electrode within the cochlea rather than the FAT. Three listeners had ITD-sensitivity estimates that came close to matching their clinical FATs (S2, S3, and S6; Figure 6(b)). On one hand, this result suggests that these listeners might have experienced long-term adaptation to overcome the interaural place mismatch to facilitate ITD discrimination. On the other hand, it is important to point out that two of these listeners (S2 and S6) had FATs that had already been shifted by their clinician in the direction of reducing the expected interaural place mismatch (Figure 7). Therefore, it is not clear whether these listeners in fact experienced plasticity, or if the clinical frequency shift just happened to coincide with the ITD-based estimates of electrode location. For the other five listeners (S1, S4, S5, S7, and S8), the results suggest insufficient plasticity or none at all, even though these listeners had 1 to 5 years of experience using their CIs.
While several studies have shown that listeners are able to adapt to place mismatch for monaural speech perception (Rosen, Faulkner, & Wilkinson, 1999; Svirsky et al., 2015) or the perception of relative pitch across the ears (Reiss et al., 2014a, 2014b, 2015), the frequency mapping of place pitch and speech cues is likely to occur at the level of the inferior colliculus or above (Fallon, Shepherd, & Irvine, 2014). For binaural processing, there is little evidence of plasticity other than the procedural learning and learning of new associations between acoustic cues and sound locations (Hofman, Van Riswick, & Van Opstal, 1998; Shinn-Cunningham, Durlach, & Held, 1998; Van Wanrooij & Van Opstal, 2005). However, these examples all involved the remapping or expansion of ITD or ILD sound-localization cues to which listeners were already sensitive. This is very different from developing sensitivity to place-mismatched binaural cues where neural-computation ability does not already exist. The binaural processing of ITD and ILD cues requires place-matched inputs (Batra & Yin, 2004; Joris et al., 1998) and takes place in the superior olivary complex (SOC; Goldberg & Brown, 1969) of the brainstem. Although there is some evidence of plasticity in the inferior colliculus (Ayala, Pérez-González, Duque, Nelken, & Malmierca, 2013; Malmierca, Cristaudo, Pérez-González, & Covey, 2009) and medial geniculate body (Anderson, Christianson, & Linden, 2009), the degree of adaptation required to overcome interaural place mismatch may not be achievable at the level of the SOC. On the other hand, it is likely that SSD-CI listeners are never exposed to usable ITDs in everyday listening because of the lack of temporal fine-structure information available in the CI signal (Wouters, McDermott, & Francart, 2015) and the large time delay associated with the sound processor (Wess et al., 2017). It could be that the brainstem could adapt to these very large interaural frequency disparities if it was provided with useful ITD cues on an ongoing basis. In any case, these results argue that listeners might achieve better binaural function by changing the FAT in the CI sound processor based on the ITD results.
Study Limitations
This study contained several limitations that should be considered when interpreting the results. Some of these limitations stem from methodological choices that were made to reduce test time or to increase ITD-discrimination performance, including the decision to not attempt to adjust the reference ITD to center the auditory image, the decision to implement a fast loudness-balancing procedure, and the decision to test an ITD range that was larger than physiologically plausible. There was also an important limitation related to the nature of the acoustic stimuli that prevented the examination of carrier frequencies below about 1 kHz.
Image centering and selection of test ITDs
No attempts were made to adjust the reference ITD to precisely offset the relative delay between the CI and acoustic ears and perceptually center the auditory image. This could have limited the level of performance, which is known to be optimal for ITDs near the midline (Koehnke et al., 1995). On the other hand, binaural performance for BI-CI listeners has not been shown to be sensitive to centering, at least for ILD perception (Goupell, 2015). In the case of auxiliary-input stimulation, an analysis of the speech processor output that was carried out after the experiment was completed showed that the mean delay of electrical stimulation with respect to the acoustic stimulus was much shorter (on the order of 0.5 ms) than expected: Zirn et al. (2015) found that the delay associated with a MED-EL sound processor ranged from 0.5 to 7 ms, depending on the electrode being tested. This suggests that the 5-ms delay we applied to the acoustic channel in the case of an auxiliary input was not an appropriate choice for the MED-EL CI users and that better performance might have been obtained with a more optimized offset. This short delay was probably a result of the wide filter bandwidth associated with the single-channel FAT used for this research purpose. When we examined the delay associated with a typical clinical sound-processor analysis bandwidth, the delays increased and were on the order of 1 to 5 ms, closer to the values reported by Zirn et al.
Another possible limitation of the approach employed here was that the test ITDs were not systematically adjusted for different electrodes and carrier frequencies. Because the latency of the traveling wave in the acoustic ear varies as a function of carrier frequency (up to 10 ms along the length of the cochlea), it is theoretically possible that this could have introduced a confounding effect, whereby the reference ITD was more optimal for some acoustic frequencies than others, which could possibly explain some of observed frequency dependence of the performance functions. However, the performance peaks generally shifted in frequency as a function of the test electrode, which would not be expected if the peak represented the frequency that optimally offset the traveling wave latency for a given set of reference and target ITDs. Furthermore, most of the 10-ms range in traveling-wave latency occurs at the apical end of the cochlea. For the 1- to 10-kHz range of frequencies tested in the current study, the traveling wave latency changes only by about 1 ms (Ruggero & Temchin, 2007). The 1-ms difference in delay is much smaller than the range of target ITDs presented (7.5 ms or greater in most cases). Therefore, it seems unlikely that the results were confounded by the frequency dependence of the traveling-wave latency.
Large ITDs
Because of the relatively large ITDs tested, it is an open question whether listeners were actually performing a binaural task based on a perceived change in the intracranial location of the pulse-train stimuli. Although the range of ITDs tested was clearly outside the physiological range, it has been established that ITDs outside of the physiological range generate a perception of lateralization (Majdak et al., 2006; Mossop & Culling, 1988; Yost et al., 2007). Several aspects of the stimuli employed in the current study increased the likelihood that listeners experienced a spatial cue for ITD discrimination. First, the stimuli were complex and had relatively large bandwidths. Stimuli wider than a critical bandwidth are readily lateralized to the correct location because of across channel processing (i.e., straightness; Stern, Zeiberg, & Trahiotis, 1988; Yost et al., 2007). The long duration of the stimuli also increased the likelihood of binaural fusion into a single sound image. The fusion/echo threshold for single clicks is on the order of 5 to 10 ms but is much longer than that (10–50 ms or more) for more complex stimuli (Brown, Stecker, & Tollin, 2015; Litovsky, Colburn, Yost, & Guzman, 1999).
Majdak et al. (2006) demonstrated that BI-CI listeners perceive changes in intracranial location for stimuli with very large delays outside the physiological range. They examined left–right discrimination for BI-CI listeners presented with 12.5-Hz modulated pulse trains with ITDs applied to carrier pulses. They found that listeners perceived the stimuli as originating from the left or right side in concert with the relative phase of the interaural delay, which means that ITDs as large as 5 ms (i.e., half the pulse period) produced a clear spatial cue for the one listener who was tested at a rate of 100 pps. Like the Majdak et al. study, the ITDs in our study spanned a full period, which should have provided salient movement to several different intracranial locations. Still, one difference is that Majdak et al. used ramped stimuli, ensuring that only ongoing cues were available. In contrast, listeners in the current study would have had access to both onset and ongoing ITD cues, and it is not clear whether the observation that ongoing ITDs as large as 5 ms produce a clear spatial percept would carry over to onset ITDs.
Although we did not systematically ask the participants about whether they perceived changes in the spatial location of the stimuli, several participants reported that they did indeed hear the stimuli in the target interval as moving laterally in space. Some listeners reported changes in the perceived vertical position of the stimuli. This could perhaps be associated with place of stimulation (Thakkar & Goupell, 2014), although if this were the case then the perceived location should have been constant for all of the intervals and independent of the ITD cue. Other listeners reported changes in the pitch. If this percept reflected place pitch, then this should have been constant for all of the intervals and independent of the ITD cue. If it reflected a temporal pitch cue, it could theoretically be different for the intervals with different ITDs. In any case, these anecdotal observations suggest that listeners were making use of binaural spatial information in at least some cases.
Loudness balancing
The loudness-balancing procedure in the current study was not carried out as systematically as possible. Ideally, loudness balancing would have been carried out several times for each pairwise comparison, bracketing the balanced level from both above and below the eventual match. In the interest of reducing test time, the current study employed a less systematic procedure that included only a single adjustment for each combination of test electrode and acoustic frequency. This method could have introduced some bias into the eventual loudness match, which might have yielded poor ITD performance in certain cases with a faulty loudness match. However, Koehnke et al. (1995) showed that ITD discrimination performance for NH listeners was completely unaffected by the application of a biasing ILD as large as 12 dB, and ITD just-noticeable differences increased only by a factor of 1.5 with a 24-dB biasing ILD. While we cannot rule out the possibility that such a bias could have influenced the results in certain individual cases, it is unlikely that it would have led to the systematic observation of performance-function peaks observed here. Between the unknown level of fusion and the unknown ITDs, ILDs, and loudness perceptions, precisely centering each stimulus would have been prohibitively time consuming. Furthermore, even if the loudness-balancing procedure had been perfectly unbiased, it is still unlikely that sequential or simultaneous loudness balancing would have produced the desired intracranially centered image (Fitzgerald, Kan, & Goupell, 2015). For these reasons, we chose to use just loudness balancing and the change-detection task. If one could center the auditory images appropriately, one could more likely use a more traditional two-interval left–right discrimination task.
Inability to measure ITD sensitivity near the apex
One important limitation of the ITD-discrimination paradigm employed here is that it is not ideal for examining low-frequency electrodes toward the apex of the cochlea. There are two related reasons for this. First, the frequency tuning of the cochlea toward the apex is very sharp (when expressed in hertz). This means that for a given acoustic pulse rate, fewer of the harmonic components of the stimulus will interact within an auditory filter, which will tend to temporally smear the acoustic pulses at a given place on the cochlea (i.e., the “resolvability” problem). In the extreme, harmonic components will be completely resolved (i.e., at frequencies below 1000 Hz for a pulse rate of 100 pps, Bernstein & Oxenham, 2003), resulting in an unmodulated pure tone rather than a modulated pulse train at the intended cochlear place. Second, because the spread of cochlear excitation is logarithmic, maintaining a constant stimulus bandwidth (expressed in millimeters along the cochlea) requires a longer pulse duration with decreasing carrier frequency. Once the pulse duration approaches the pulse period, successive pulses will begin to temporally overlap (i.e., the “duty-cycle” problem). The current study employed a stimulus bandwidth intended to excite a 1.5-mm region of the cochlea. For carrier frequencies below 1000 Hz, the pulse duration approached the 10-ms period of the 100-pps pulse train. Both problems could be mitigated to some extent by reducing the stimulus pulse rate. The harmonic components of the pulse-train stimulus would be closer together in frequency and therefore interact more at a given place on the cochlea (i.e., become less resolved) to create the desired modulation. Subsequent pulses in the lower-rate stimulus would also be less likely to temporally overlap, thereby increasing the duty cycle. However, reducing the pulse rate would not address the issue that a long pulse duration will nevertheless tend to relay less precise ITD information, regardless of resolvability or duty cycle. Furthermore, ITD sensitivity decreases with decreasing rate below about 60 to 100 pps (e.g., Hancock, Noel, Ryugo, & Delgutte, 2010; Noel & Eddington, 2013).
Clinical Implications
Because SSD-CI listeners will not have access in everyday listening situations to the ITD cues employed in the current study, these results do not necessarily imply that place matching will improve ITD sensitivity in these situations. The ITDs employed were very large (on the order of several milliseconds) and would never occur in real-life listening conditions where the maximum ITD for a sound source coming from one side is about 0.7 ms. Previous studies have shown that under laboratory conditions, BI-CI and bimodal CI listeners can discriminate ITDs that approach or fall within physiological limits (Francart et al., 2014; Kan et al., 2013), although this was not examined here. SSD-CI listeners are also subject to dramatic interaural differences in processing time, with the sound-processor delay in the CI ear much longer than the traveling-wave delay in the acoustic ear, although theoretically, hearing-aid processing could be added to the acoustic ear to offset the processing difference. Furthermore, CI users do not have access to fine-structure ITDs. Although it is possible for these listeners to have access to ITD cues in the signal envelope, envelope onset ITDs will become disrupted by the gross interaural time delay between the acoustic ear and the CI sound processor, leaving only ongoing envelope ITDs, thought to be less salient (Stecker & Brown, 2010).
Despite the small likelihood that SSD-CI listeners would be able to make use of the ITD cues presented in the current study, it is hoped that using ITD measurements to minimize interaural place mismatch will lead to other benefits such as binaural fusion, ILD processing, and binaural squelch. SSD-CI listeners have been shown to be sensitive to ILD information (Dorman et al., 2015), and like ITDs, the processing of these cues likely requires frequency-matched inputs to the SOC. It therefore seems likely that the same frequency matching will be required to optimize both ITD and ILD processing. For binaural fusion, Reiss et al. (2014a) have argued that for listeners with a CI in one ear and acoustic hearing in the other, interaural place mismatch might be overcome through adaptation. Finally, SSD-CI listeners have been shown to benefit from binaural cues for the perceptual separation of concurrent talkers in the environment (Bernstein et al., 2016, 2017). The ability to perceptually fuse speech signals presented to the two ears is a critical step in organizing the auditory scene. Vocoder simulations have suggested that interaural place mismatch might be detrimental to this process (Ma et al., 2016; Wess et al., 2017). Siciliano, Faulkner, Rosen, and Mair (2010) found that extensive training could not improve speech perception for interaurally mismatched vocoders, in contrast to the improvement that has been demonstrated for spectrally shifted monaurally vocoded speech (Rosen et al., 1999). Thus, providing SSD-CI listeners with an interaural place match may be critical to optimize speech perception.
Although the method employed in the current study shows promise as a way to inform programming approaches to reduce SSD-CI interaural place mismatch, any test used as a clinical tool for this purpose would need to be completed in a reasonable amount of time. In its current form, the ITD discrimination test takes hours to complete on multiple electrodes and is therefore not a realistic tool to employ in the clinic. It may be that ITD sensitivity could be measured more efficiently, for example, by measuring sensitivity to binaural beats (van Hoesel, 2007), or by using a nonstandard psychoacoustic technique based on a more subjective yes/no task. It might also be the case that even though this technique suggests a FAT to optimize spatial-hearing performance, similar performance might be obtained by estimating the cochlear place of excitation of a given electrode based on radiographic (Landsberger et al., 2015) or computed-tomography scans (Noble, Labadie, Majdani, & Dawant, 2011), or by measuring electrophysiological responses to binaural stimuli (Hu & Dietz, 2015). Interaural pitch matching is also a possibility (e.g., Schatzer et al., 2014), although pitch matching is subject to testing range biases (Carlyon et al., 2010) and plasticity effects (Reiss et al., 2015) that may preclude its usefulness as a tool to optimize binaural processing.
For the 65% of electrodes tested where an ITD match could be identified, it is an important question whether the ITD-based place-matched estimates were precise enough to allow for a successful remapping of an individual listener’s FATs. An analysis of the width of the ITD tuning functions suggested that on average, the best ITD frequency could be estimated within ±0.7 octaves. This range is smaller than the average difference between the standard FAT and the ITD-based estimates and is also smaller than the intersubject variability in this difference, suggesting that the 0.7-octave precision has the potential to lead to improvements in performance. On the other hand, it is also possible that SSD-CI listeners might benefit substantially from a remapping strategy based simply on the group-average shift. Future studies examining the impact of individualized versus global remapping strategies could shed light on the usefulness of this kind of individualized place-matched data in the remapping process.
Finally, it is important to point out that once an optimal set of frequencies for a series of electrodes is determined (whether through ITD-sensitivity measures or another approach such as a computed-tomography scan), it would be a very simple, straightforward process to implement the changes in a clinical mapping procedure. All that would be required is to change the FAT settings in the clinical software. The main potential drawback of this approach is that it would require that low-frequency information be discarded. Specifically, frequencies below about 500 to 700 Hz would not be presented to the CI because these frequencies are associated with insertion angles more apical than the deepest electrode in the array. This approach is not generally taken for traditional, bilaterally deaf, unilateral CI listeners because this process would discard important speech information, and plasticity allows CI listeners to adjust to the place-mismatched speech cues (e.g., Svirsky et al., 2015). But the absence of low-frequency speech cues from the CI is much less likely to be a problem for SSD-CI listeners. Because head shadow is minimal at these low frequencies (Feddersen, Sandel, Teas, & Jeffress, 1957), any low-frequency speech information that is missing from the CI below 500 Hz should be readily available in the NH ear. Frequency remapping could cause a temporary speech-perception deficit in conditions where listeners are more heavily relying on their CI ear because of shifted speech cues, but plasticity should be able to overcome this problem (Svirsky et al., 2015) especially if the speech is shifted to the more natural place on the cochlea in line with the contralateral ear.
Summary and Conclusions
A measure of sensitivity to changes in ITD for narrowband stimuli was able to identify the optimal acoustic frequency for a given CI electrode to minimize interaural place mismatch for 17 out of 26 (65%) of the electrodes tested, and for at least one electrode for each of the eight SSD-CI participants. On average across these 17 electrodes, the optimal acoustic frequency was 1.15 octaves above the frequency associated with a standard FAT, and 0.50 octaves above the frequency associated with the listener’s actual clinical FAT. In general, the optimal acoustic frequency was shifted in the direction expected based on average insertion-depth data from the literature. Although the technique employed in this study is currently too time consuming for clinical use, the results suggest the possibility that SSD-CI listeners might benefit from frequency remapping based on this type of psychoacoustic information.
Acknowledgments
We thank Coral Dirks for assistance with data collection and Cochlear Ltd. and MED-EL for providing test equipment and technical support. Portions of this work were previously presented at the 5th Joint Meeting of the Acoustical Society of America and Acoustical Society of Japan, Honolulu, Hawaii, November 29, 2016; the Midwinter Meeting of the Association for Research in Otolaryngology, Baltimore, MD, February 12, 2017; and the Conference on Implantable Auditory Prostheses, Tahoe City, CA, July 20, 2017. The content is solely the responsibility of the authors and does not necessarily represent the official views of the National Institutes of Health. The views expressed in this article are those of the authors and do not reflect the official policy of the Department of Army/Navy/Air Force, Department of Defense, or U.S. Government. The identification of specific products or scientific instrumentation does not constitute endorsement or implied endorsement on the part of the author, DoD, or any component agency.
Declaration of Conflicting Interests
The authors declared no potential conflicts of interest with respect to the research, authorship, and/or publication of this article.
Funding
The authors disclosed receipt of the following financial support for the research, authorship, and/or publication of this article: Research reported in this publication was supported by the National Institute on Deafness and Other Communication Disorders of the National Institutes of Health under Award Number R01 DC015798 (to J. G. W. B. and M. J. G.).
References
- Anderson L. A., Christianson G. B., Linden J. F. (2009) Stimulus-specific adaptation occurs in the auditory thalamus. Journal of Neuroscience 29(22): 7359–7363. doi:10.1523/jneurosci.0793-09.2009. [DOI] [PMC free article] [PubMed] [Google Scholar]
- Arndt S., Aschendorff A., Laszig R., Beck R., Schild C., Kroeger S., Wesarg T. (2011) Comparison of pseudobinaural hearing to real binaural hearing rehabilitation after cochlear implantation in patients with unilateral deafness and tinnitus. Otology and Neurotology 32(1): 39–47. doi:10.1097/MAO.0b013e3181fcf271. [DOI] [PubMed] [Google Scholar]
- Aronoff J. M., Shayman C., Prasad A., Suneel D., Stelmach J. (2015) Unilateral spectral and temporal compression reduces binaural fusion for normal hearing listeners with cochlear implant simulations. Hearing Research 320: 24–29. doi:10.1016/j.heares.2014.12.005. [DOI] [PMC free article] [PubMed] [Google Scholar]
- Ayala Y. A., Pérez-González D., Duque D., Nelken I., Malmierca M. S. (2013) Frequency discrimination and stimulus deviance in the inferior colliculus and cochlear nucleus. Frontiers in Neural Circuits 6: 119 doi:10.3389/fncir.2012.00119. [DOI] [PMC free article] [PubMed] [Google Scholar]
- Baguley D. M., Bird J., Humphriss R. L., Prevost A. T. (2006) The evidence base for the application of contralateral bone anchored hearing aids in acquired unilateral sensorineural hearing loss in adults. Clinical Otolaryngology 31(1): 6–14. doi:10.1111/j.1749-4486.2006.01137.x. [DOI] [PubMed] [Google Scholar]
- Batra R., Yin T. C. T. (2004) Cross correlation by neurons of the medial superior olive: A reexamination. Journal of the Association for Research in Otolaryngology 5(3): 238–252. doi:10.1007/s10162-004-4027-4. [DOI] [PMC free article] [PubMed] [Google Scholar]
- Bernstein J. G. W., Goupell M. J., Schuchman G. I., Rivera A. L., Brungart D. S. (2016) Having two ears facilitates the perceptual separation of concurrent talkers for bilateral and single-sided deaf cochlear implantees. Ear and Hearing 37(3): 289–302. doi:10.1097/AUD.0000000000000284. [DOI] [PMC free article] [PubMed] [Google Scholar]
- Bernstein J. G. W., Oxenham A. J. (2003) Pitch discrimination of diotic and dichotic tone complexes: Harmonic resolvability or harmonic number? The Journal of the Acoustical Society of America 113(6): 3323–3334. doi:10.1121/1.1572146. [DOI] [PubMed] [Google Scholar]
- Bernstein J. G. W., Schuchman G. I., Rivera A. L. (2017) Head shadow and binaural squelch for unilaterally deaf cochlear implantees. Otology and Neurotology 38(7): e195–e202. doi:10.1097/MAO.0000000000001469. [DOI] [PubMed] [Google Scholar]
- Boëx C., Baud L., Cosendai G., Sigrist A., Kós M. I., Pelizzone M. (2006) Acoustic to electric pitch comparisons in cochlear implant subjects with residual hearing. Journal of the Association for Research in Otolaryngology 7(2): 110–124. doi:10.1007/s10162-005-0027-2. [DOI] [PMC free article] [PubMed] [Google Scholar]
- Brown A. D., Stecker G. C., Tollin D. J. (2015) The precedence effect in sound localization. Journal of the Association for Research in Otolaryngology 16(1): 1–28. doi:10.1007/s10162-014-0496-2. [DOI] [PMC free article] [PubMed] [Google Scholar]
- Carlyon R. P., Macherey O., Frijns J. H. M., Axon P. R., Kalkman R. K., Boyle P., Dauman R. (2010) Pitch comparisons between electrical stimulation of a cochlear implant and acoustic stimuli presented to a normal-hearing contralateral ear. Journal of the Association for Research in Otolaryngology 11(4): 625–640. doi:10.1007/s10162-010-0222-7. [DOI] [PMC free article] [PubMed] [Google Scholar]
- Dorman M. F., Spahr T., Gifford R., Loiselle L., McKarns S., Holden T., Finley C. (2007) An electric frequency-to-place map for a cochlear implant patient with hearing in the nonimplanted ear. Journal of the Association for Research in Otolaryngology 8(2): 234–240. doi:10.1007/s10162-007-0071-1. [DOI] [PMC free article] [PubMed] [Google Scholar]
- Dorman M. F., Zeitler D., Cook S. J., Loiselle L. J., Yost W. A., Wanna G. B., Gifford R. H. (2015) Interaural level difference cues determine sound source localization by single-sided deaf patients fit with a cochlear implant. Audiology and Neurotology 20(3): 183–188. doi:10.1159/000375394. [DOI] [PMC free article] [PubMed] [Google Scholar]
- Erbele I. D., Bernstein J. G. W., Schuchman G. I., Brungart D. S., Rivera A. (2015) An initial experience of cochlear implantation for patients with single-sided deafness after prior osseointegrated hearing device. Otology and Neurotology 36(1): e24–e29. doi:10.1097/MAO.0000000000000652. [DOI] [PubMed] [Google Scholar]
- Fallon J. B., Shepherd R. K., Irvine D. R. F. (2014) Effects of chronic cochlear electrical stimulation after an extended period of profound deafness on primary auditory cortex organization in cats. European Journal of Neuroscience 39(5): 811–820. doi:10.1111/ejn.12445. [DOI] [PubMed] [Google Scholar]
- Feddersen W. E., Sandel T. T., Teas D. C., Jeffress L. A. (1957) Localization of high-frequency tones. The Journal of the Acoustical Society of America 29(9): 988–991. doi:10.1121/1.1909356. [Google Scholar]
- Firszt J. B., Holden L. K., Reeder R. M., Cowdrey L., King S. (2012) Cochlear implantation in adults with asymmetric hearing loss. Ear and Hearing 33(4): 521–533. doi:10.1097/AUD.0b013e31824b9dfc. [DOI] [PMC free article] [PubMed] [Google Scholar]
- Fitzgerald M. B., Kan A., Goupell M. J. (2015) Bilateral loudness balancing and distorted spatial maps in recipients of bilateral cochlear implants. Ear and Hearing 36(5): e225–e236. doi:10.1097/AUD.0000000000000174. [DOI] [PMC free article] [PubMed] [Google Scholar]
- Francart T., Brokx J., Wouters J. (2009) Sensitivity to interaural time differences with combined cochlear implant and acoustic stimulation. Journal of the Association for Research in Otolaryngology 10(1): 131–141. doi:10.1007/s10162-008-0145-8. [DOI] [PMC free article] [PubMed] [Google Scholar]
- Francart T., Lenssen A., Wouters J. (2011) Sensitivity of bimodal listeners to interaural time differences with modulated single- and multiple-channel stimuli. Audiology and Neurotology 16(2): 82–92. doi:10.1159/000313329. [DOI] [PubMed] [Google Scholar]
- Francart T., Lenssen A., Wouters J. (2014) Modulation enhancement in the electrical signal improves perception of interaural time differences with bimodal stimulation. Journal of the Association for Research in Otolaryngology 15(4): 633–647. doi:10.1007/s10162-014-0457-9. [DOI] [PMC free article] [PubMed] [Google Scholar]
- Francart T., Wouters J. (2007) Perception of across-frequency interaural level differences. The Journal of the Acoustical Society of America 122(5): 2826–2831. doi:10.1121/1.2783130. [DOI] [PubMed] [Google Scholar]
- Gabor D. (1944) Theory of communication. Journal of the Institution of Electrical Engineers-Part III: Radio and Communication Engineering 93(26): 429–457. doi:10.1049/ji-3-2.1946.0074. [Google Scholar]
- Goldberg J. M., Brown P. B. (1969) Response of binaural neurons of dog superior olivary complex to dichotic tonal stimuli: Some physiological mechanisms of sound localization. Journal of Neurophysiology 32(4): 613–636. doi:10.1007/978-1-4612-2700-7_3. [DOI] [PubMed] [Google Scholar]
- Goupell M. J. (2015) Interaural envelope correlation change discrimination in bilateral cochlear implantees: Effects of mismatch, centering, and onset of deafness. The Journal of the Acoustical Society of America 137(3): 1282–1297. doi:10.1121/1.4908221. [DOI] [PMC free article] [PubMed] [Google Scholar]
- Goupell M. J., Majdak P., Laback B. (2010) Median-plane sound localization as a function of the number of spectral channels using a channel vocoder. The Journal of the Acoustical Society of America 127(2): 990–1001. doi:10.1121/1.3283014. [DOI] [PMC free article] [PubMed] [Google Scholar]
- Goupell M. J., Stoelb C., Kan A., Litovsky R. Y. (2013) Effect of mismatched place-of-stimulation on the salience of binaural cues in conditions that simulate bilateral cochlear-implant listening. The Journal of the Acoustical Society of America 133(4): 2272–2287. doi:10.1121/1.4792936. [DOI] [PMC free article] [PubMed] [Google Scholar]
- Greenwood D. D. (1990) A cochlear frequency-position function for several species—29 years later. The Journal of the Acoustical Society of America 87(6): 2592–2605. doi:10.1121/1.399052. [DOI] [PubMed] [Google Scholar]
- Hancock K. E., Noel V., Ryugo D. K., Delgutte B. (2010) Neural coding of interaural time differences with bilateral cochlear implants: Effects of congenital deafness. Journal of Neuroscience 30(42): 14068–14079. doi:10.1523/JNEUROSCI.3213-10.2010. [DOI] [PMC free article] [PubMed] [Google Scholar]
- Hansen M. R., Gantz B. J., Dunn C. (2013) Outcomes after cochlear implantation for patients with single-sided deafness, including those with recalcitrant Ménière’s disease. Otology and Neurotology 34(9): 1681–1687. doi:10.1097/MAO.0000000000000102. [DOI] [PMC free article] [PubMed] [Google Scholar]
- Hofman P. M., Van Riswick J. G., Van Opstal A. J. (1998) Relearning sound localization with new ears. Nature Neuroscience 1(5): 417–421. doi:10.1038/1633. [DOI] [PubMed] [Google Scholar]
- Hopkins K., Moore B. C. J. (2010) Development of a fast method for measuring sensitivity to temporal fine structure information at low frequencies. International Journal of Audiology 49(12): 940–946. doi:10.3109/14992027.2010.512613. [DOI] [PubMed] [Google Scholar]
- Hu H., Dietz M. (2015) Comparison of interaural electrode pairing methods for bilateral cochlear implants. Trends in Hearing 19: 2331216515617143 doi:10.1177/2331216515617143. [DOI] [PMC free article] [PubMed] [Google Scholar]
- Joris P. X., Smith P. H., Yin T. C. T. (1998) Coincidence detection in the auditory system: 50 years after Jeffress. Neuron 21(6): 1235–1238. doi:10.1016/S0896-6273(00)80643-1. [DOI] [PubMed] [Google Scholar]
- Kalkman R. K., Briaire J. J., Dekker D. M. T., Frijns J. H. M. (2015) Place pitch versus electrode location in a realistic computational model of the implanted human cochlea. Hearing Research 315: 10–24. doi:10.1016/j.heares.2014.06.003. [DOI] [PubMed] [Google Scholar]
- Kan A., Litovsky R. Y., Goupell M. J. (2015) Effects of interaural pitch matching and auditory image centering on binaural sensitivity in cochlear implant users. Ear and Hearing 36(3): e62–e68. doi:10.1097/AUD.0000000000000135. [DOI] [PMC free article] [PubMed] [Google Scholar]
- Kan A., Stoelb C., Litovsky R. Y., Goupell M. J. (2013) Effect of mismatched place-of-stimulation on binaural fusion and lateralization in bilateral cochlear-implant users. The Journal of the Acoustical Society of America 134(4): 2923–2936. doi:10.1121/1.4820889. [DOI] [PMC free article] [PubMed] [Google Scholar]
- Klumpp R. G., Eady H. R. (1956) Some measurements of interaural time difference thresholds. The Journal of the Acoustical Society of America 28(5): 859–860. doi:10.1121/1.1908493. [Google Scholar]
- Koehnke J., Culotta C. P., Hawley M. L., Colburn H. S. (1995) Effects of reference interaural time and intensity differences on binaural performance in listeners with normal and impaired hearing. Ear and Hearing 16(4): 331–353. doi:10.1097/00003446-199508000-00001. [DOI] [PubMed] [Google Scholar]
- Kuhn G. F. (1977) Model for the interaural time differences in the azimuthal plane. The Journal of the Acoustical Society of America 62(1): 157–167. doi:10.1121/1.381498. [Google Scholar]
- Landsberger D. M., Svrakic M., Roland J. T., Svirsky M. (2015) The relationship between insertion angles, default frequency allocations, and spiral ganglion place pitch in cochlear implants. Ear and Hearing 36: 207–213. doi:10.1097/AUD.0000000000000163. [DOI] [PMC free article] [PubMed] [Google Scholar]
- Litovsky R. Y., Colburn H. S., Yost W. A., Guzman S. J. (1999) The precedence effect. The Journal of the Acoustical Society of America 106(4): 1633–1654. doi:10.1121/1.427914. [DOI] [PubMed] [Google Scholar]
- Ma N., Morris S., Kitterick P. T. (2016) Benefits to speech perception in noise from the binaural integration of electric and acoustic signals in simulated unilateral deafness. Ear and Hearing 37(3): 248–259. doi:10.1097/AUD.0000000000000252. [DOI] [PMC free article] [PubMed] [Google Scholar]
- Majdak P., Laback B., Baumgartner W.-D. (2006) Effects of interaural time differences in fine structure and envelope on lateral discrimination in electric hearing. The Journal of the Acoustical Society of America 120(4): 2190–2201. doi:10.1121/1.2258390. [DOI] [PubMed] [Google Scholar]
- Malmierca M. S., Cristaudo S., Pérez-González D., Covey E. (2009) Stimulus-specific adaptation in the inferior colliculus of the anesthetized rat. Journal of Neuroscience 29(17): 5483–5493. doi:10.1523/JNEUROSCI.4153-08.2009. [DOI] [PMC free article] [PubMed] [Google Scholar]
- Mossop J. E., Culling J. F. (1998) Lateralization of large interaural delays. The Journal of the Acoustical Society of America 104(3): 1574–1579. doi:10.1121/1.424369. [DOI] [PubMed] [Google Scholar]
- Noble J. H., Labadie R. F., Majdani O., Dawant B. M. (2011) Automatic segmentation of intra-cochlear anatomy in conventional CT. IEEE Transactions on Biomedical Engineering 58(9): 2625–2632. doi:10.1109/TBME.2011.2160262. [DOI] [PMC free article] [PubMed] [Google Scholar]
- Noel V. A., Eddington D. K. (2013) Sensitivity of bilateral cochlear implant users to fine-structure and envelope interaural time differences. The Journal of the Acoustical Society of America 133(4): 2314–2328. doi:10.1121/1.4794372. [DOI] [PMC free article] [PubMed] [Google Scholar]
- Poon B. B., Eddington D. K., Noel V., Colburn H. S. (2009) Sensitivity to interaural time difference with bilateral cochlear implants: Development over time and effect of interaural electrode spacing. The Journal of the Acoustical Society of America 126(2): 806–815. doi:10.1121/1.3158821. [DOI] [PMC free article] [PubMed] [Google Scholar]
- Reiss L. A. J., Ito R. A., Eggleston J. L., Liao S., Becker J. J., Lakin C. E., McMenomey S. O. (2015) Pitch adaptation patterns in bimodal cochlear implant users: Over time and after experience. Ear and Hearing 36(2): e23–e34. doi:10.1097/AUD.0000000000000114. [DOI] [PMC free article] [PubMed] [Google Scholar]
- Reiss L. A. J., Ito R. A., Eggleston J. L., Wozny D. R. (2014. a) Abnormal binaural spectral integration in cochlear implant users. Journal of the Association for Research in Otolaryngology 15(2): 235–248. doi:10.1007/s10162-013-0434-8. [DOI] [PMC free article] [PubMed] [Google Scholar]
- Reiss L. A. J., Turner C. W., Karsten S. A., Gantz B. J. (2014. b) Plasticity in human pitch perception induced by tonotopically mismatched electro-acoustic stimulation. Neuroscience 256(2014): 43–52. doi:10.1016/j.neuroscience.2013.10.024. [DOI] [PMC free article] [PubMed] [Google Scholar]
- Rosen S., Faulkner A., Wilkinson L. (1999) Adaptation by normal listeners to upward spectral shifts of speech: Implications for cochlear implants. The Journal of the Acoustical Society of America 106(6): 3629–3636. doi:10.1121/1.428215. [DOI] [PubMed] [Google Scholar]
- Ruggero M. A., Temchin A. N. (2007) Similarity of traveling-wave delays in the hearing organs of humans and other tetrapods. Journal of the Association for Research in Otolaryngology 8(2): 153–166. doi:10.1007/s10162-007-0081-z. [DOI] [PMC free article] [PubMed] [Google Scholar]
- Schatzer R., Vermeire K., Visser D., Krenmayr A., Kals M., Voormolen M., Zierhofer C. (2014) Electric-acoustic pitch comparisons in single-sided-deaf cochlear implant users: Frequency-place functions and rate pitch. Hearing Research 309: 26–35. doi:10.1016/j.heares.2013.11.003. [DOI] [PubMed] [Google Scholar]
- Shinn-Cunningham B. G., Durlach N. I., Held R. M. (1998) Adapting to supernormal auditory localization cues. I. Bias and resolution. The Journal of the Acoustical Society of America 103(6): 3656–3666. doi:10.1121/1.423088. [DOI] [PubMed] [Google Scholar]
- Siciliano C. M., Faulkner A., Rosen S., Mair K. (2010) Resistance to learning binaurally mismatched frequency-to-place maps: Implications for bilateral stimulation with cochlear implants. The Journal of the Acoustical Society of America 127(3): 1645–1660. doi:10.1121/1.3293002. [DOI] [PubMed] [Google Scholar]
- Smith Z. M., Delgutte B. (2007) Sensitivity to interaural time differences in the inferior colliculus with bilateral cochlear implants. Journal of Neuroscience 27(25): 6740–6750. doi:10.1523/JNEUROSCI.0052-07.2007. [DOI] [PMC free article] [PubMed] [Google Scholar]
- Stakhovskaya O., Sridhar D., Bonham B. H., Leake P. A. (2007) Frequency map for the human cochlear spiral ganglion: Implications for cochlear implants. Journal of the Association for Research in Otolaryngology 8(2): 220–233. doi:10.1007/s10162-007-0076-9. [DOI] [PMC free article] [PubMed] [Google Scholar]
- Stecker C. G., Brown A. D. (2010) Temporal weighting of binaural cues revealed by detection of dynamic interaural differences in high-rate Gabor click trains. The Journal of the Acoustical Society of America 127(5): 3092–3103. doi:10.1121/1.3377088. [DOI] [PMC free article] [PubMed] [Google Scholar]
- Stern R. M., Zeiberg A. S., Trahiotis C. (1988) Lateralization of complex binaural stimuli: A weighted-image model. The Journal of the Acoustical Society of America 84(1): 156–165. doi:10.1121/1.396982. [DOI] [PubMed] [Google Scholar]
- Suneel D., Staisloff H., Shayman C. S., Stelmach J., Aronoff J. M. (2017) Localization performance correlates with binaural fusion for interaurally mismatched vocoded speech. The Journal of the Acoustical Society of America 142(3): EL276–EL280. doi:10.1121/1.5001903. [DOI] [PMC free article] [PubMed] [Google Scholar]
- Svirsky M. A., Fitzgerald M. B., Sagi E., Glassman E. K. (2015) Bilateral cochlear implants with large asymmetries in electrode insertion depth: Implications for the study of auditory plasticity. Acta Otolaryngolica 135(4): 354–363. doi:10.3109/00016489.2014.1002052. [DOI] [PMC free article] [PubMed] [Google Scholar]
- Thakkar T., Goupell M. J. (2014) Internalized elevation perception of simple stimuli in cochlear-implant and normal-hearing listeners. The Journal of the Acoustical Society of America 136(2): 841–852. doi:10.1121/1.4884770. [DOI] [PMC free article] [PubMed] [Google Scholar]
- van Hoesel R. J. M. (2007) Sensitivity to binaural timing in bilateral cochlear implant users. The Journal of the Acoustical Society of America 121(4): 2192–2206. doi:10.1121/1.2537300. [DOI] [PubMed] [Google Scholar]
- Van Wanrooij M. M., Van Opstal A. J. (2005) Relearning sound localization with a new ear. Journal of Neuroscience 25(22): 5413–5424. doi:10.1523/JNEUROSCI.0850-05.2005. [DOI] [PMC free article] [PubMed] [Google Scholar]
- Vermeire K., Nobbe A., Schleich P., Nopp P., Voormolen M. H., Van de Heyning P. H. (2008) Neural tonotopy in cochlear implants: An evaluation in unilateral cochlear implant patients with unilateral deafness and tinnitus. Hearing Research 245(1): 98–106. doi:10.1016/j.heares.2008.09.003. [DOI] [PubMed] [Google Scholar]
- Vermeire K., Van de Heyning P. (2009) Binaural hearing after cochlear implantation in subjects with unilateral sensorineural deafness and tinnitus. Audiology and Neurotology 14(3): 163–171. doi:10.1159/000171478. [DOI] [PubMed] [Google Scholar]
- Wess J. M., Brungart D. S., Bernstein J. G. W. (2017) The effect of interaural mismatches on contralateral unmasking with single-sided vocoders. Ear and Hearing 38(3): 374–386. doi:10.1097/AUD.0000000000000374. [DOI] [PubMed] [Google Scholar]
- Wouters J., McDermott H. J., Francart T. (2015) Sound coding in cochlear implants: From electric pulses to hearing. IEEE Signal Processing Magazine 32(2): 67–80. doi:10.1109/MSP.2014.2371671. [Google Scholar]
- Yost W. A., Dye R. H., Sheft S. (2007) Interaural time difference processing of broadband and narrow-band noise by inexperienced listeners. The Journal of the Acoustical Society of America 121(3): EL103–EL109. doi:10.1121/1.2437841. [DOI] [PMC free article] [PubMed] [Google Scholar]
- Zeitler D. M., Dorman M. F., Natale S. J., Loiselle L., Yost W. A., Gifford R. H. (2015) Sound source localization and speech understanding in complex listening environments by single-sided deaf listeners after cochlear implantation. Otology and Neurotology 36(9): 1467–1471. doi:10.1097/MAO.0000000000000841. [DOI] [PMC free article] [PubMed] [Google Scholar]
- Zeng F. G., Tang Q., Lu T. (2014) Abnormal pitch perception produced by cochlear implant stimulation. PLoS One 9(2): e88662 doi:10.1371/journal.pone.0088662. [DOI] [PMC free article] [PubMed] [Google Scholar]
- Zirn S., Arndt S., Aschendorff A., Wesarg T. (2015) Interaural stimulation timing in single sided deaf cochlear implant users. Hearing Research 328: 148–156. doi:10.1016/j.heares.2015.08.010. [DOI] [PubMed] [Google Scholar]