

Abstract
The striatum controls food-related actions and consumption and is linked to feeding disorders, including obesity and anorexia nervosa. Two populations of neurons project from the striatum: direct pathway medium spiny neurons and indirect pathway medium spiny neurons. The selective contribution of direct pathway medium spiny neurons and indirect pathway medium spiny neurons to food-related actions and consumption remains unknown. Here, we used in vivo electrophysiology and fiber photometry in mice (of both sexes) to record both spiking activity and pathway-specific calcium activity of dorsal striatal neurons during approach to and consumption of food pellets. While electrophysiology revealed complex task-related dynamics across neurons, population calcium was enhanced during approach and inhibited during consumption in both pathways. We also observed ramping changes in activity that preceded both pellet-directed actions and spontaneous movements. These signals were heterogeneous in the spiking units, with neurons exhibiting either increasing or decreasing ramps. In contrast, the population calcium signals were homogeneous, with both pathways having increasing ramps of activity for several seconds before actions were initiated. An analysis comparing population firing rates to population calcium signals also revealed stronger ramping dynamics in the calcium signals than in the spiking data. In a second experiment, we trained the mice to perform an action sequence to evaluate when the ramping signals terminated. We found that the ramping signals terminated at the beginning of the action sequence, suggesting they may reflect upcoming actions and not preconsumption activity. Plasticity of such mechanisms may underlie disorders that alter action selection, such as drug addiction or obesity.
SIGNIFICANCE STATEMENT Alterations in striatal function have been linked to pathological consumption in disorders, such as obesity and drug addiction. We recorded spiking and population calcium activity from the dorsal striatum during ad libitum feeding and an operant task that resulted in mice obtaining food pellets. Dorsal striatal neurons exhibited long ramps in activity that preceded actions by several seconds, and may reflect upcoming actions. Understanding how the striatum controls the preparation and generation of actions may lead to improved therapies for disorders, such as drug addiction or obesity.
Keywords: accumbens, basal ganglia, electrophysiology, feeding, reward, striatum
Introduction
The dorsal striatum regulates food-related actions, consumption, and palatability (Volkow et al., 2002; Krause et al., 2010) and is a site of pathology in feeding disorders, such as obesity (Robinson et al., 2015; Contreras-Rodríguez et al., 2017) and anorexia nervosa (Frank et al., 2005). Electrophysiological recording studies report a mix of excitatory and inhibitory responses of striatal neurons during food-related actions (movements toward food), and mainly inhibitory responses during consumption itself (Taha and Fields, 2006; Krause et al., 2010). However, there are two main neural subtypes in the striatum, and their relative contribution to food-related actions and consumption remains unclear. Therefore, we sought to understand how these striatal populations encode food-related actions and consumption.
The striatum contains two types of output neurons: (1) direct pathway medium spiny neurons (dMSNs) that express D1 dopamine receptors and project to the substantia nigra; and (2) indirect pathway medium spiny neurons (iMSNs) that express D2 dopamine receptors and project to the external segment of the globus pallidus (Albin et al., 1989; DeLong, 1990; Gerfen et al., 1990). Recent studies have reported that both output populations are activated during actions (Cui et al., 2013; Isomura et al., 2013; Jin et al., 2014; Tecuapetla et al., 2014), leading us to hypothesize that the activity of both pathways would increase during food-directed approach. Based on their distinct roles in reward and reinforcement (Kravitz et al., 2012), we hypothesized that iMSN activity may be inhibited during consumption, whereas dMSN activity may be enhanced or sustained. This could reduce aversive drive via iMSNs, while sustaining the reinforcing properties of food consumption via dMSNs (Kravitz and Kreitzer, 2012; Kravitz et al., 2012).
We addressed these predictions using a combination of in vivo electrophysiology to record action potential firing and fiber photometry to record the population calcium responses from dMSNs and iMSNs. Most prior electrophysiological studies were performed in the ventral striatum (Carelli et al., 2000; Nicola et al., 2004a; Wilson and Bowman, 2004; Yun et al., 2004; Roitman et al., 2005; Taha and Fields, 2005, 2006; Wheeler et al., 2005; Wan and Peoples, 2006; Jones et al., 2008; Khamassi et al., 2008; Krause et al., 2010; Roitman et al., 2010; Ambroggi et al., 2011; Day et al., 2011), but the dorsal striatum has also been implicated in outcome-directed actions (Yin et al., 2005; Gremel and Costa, 2013; Furlong et al., 2014; Jin et al., 2014) and in food consumption (Balleine et al., 2007; DiFeliceantonio et al., 2012). To better understand the role of the dorsal striatum in food approach and consumption, we characterized spiking activity in the dorsomedial striatum (DMS) during food approach and consumption. We then used fiber photometry (Cui et al., 2013; Tecuapetla et al., 2014) to record population calcium activity of dMSNs and iMSNs during approach to and consumption of food pellets.
We noted time-locked changes in activity around approach and consumption in both spiking and photometry recordings. Surprisingly, we also observed ramping changes in activity that started several seconds before food-related and spontaneous actions. Our results support the conclusion that dorsal striatal activity relates to upcoming actions and may reflect a novel manner by which the striatum contributes to action selection.
Materials and Methods
Animals and experimental procedures.
A total of 22 adult mice (C57BL/6 background, p60-p180) were housed in standard mouse vivarium caging and kept on a 12 h light/dark cycle at 23°C–25°C. Cre lines (A2A-cre KG139, D1-cre EY217) were generated by the GENSAT project. Both male and female mice were included in these experiments (9 female, 13 male). Mice were single housed after surgery to protect the cranial implants. Standard chow diet (5001 Rodent Diet; LabDiet) and water were given ad libitum, and cages were changed at least biweekly. No mice had drug exposures other than those associated with surgery and postoperative care. All were of normal weight and immune status. All animal studies were approved by the National Institute of Diabetes and Digestive and Kidney Diseases/National Institutes of Health Animal Care and Use Committee.
Ad libitum feeding experiment.
Feeding experimentation devices (FEDs) (Nguyen et al., 2016) dispensing grain-based chow pellets (MLabRodent Tablet 20MG; TestDiet) with a 60 s refractory period after each pellet retrieval were used during recording experiments. The device was modified with a custom software to introduce a 60 s time-out after each pellet retrieval (custom code available here: https://github.com/KravitzLab/FED/tree/FED-London-et-al). This time-out was imposed to space out pellets for analysis of consumption responses in electrophysiological recordings. Mice were habituated to an FED in their home cage for several days before recording. For electrophysiological recordings, mice were fasted for 4–6 h preceding each recording, and mice ate from FED for 2–3 h. For fiber photometry experiments, mice were not fasted but were run overnight, and so were required to eat pellets to obtain sustenance.
Operant task training.
Behavioral training occurred during the dark cycle and took between 10 and 21 d to complete. Mice were trained in behavioral chambers equipped with cameras for behavioral recording and monitoring (PhenoTyper 3000, 30 cm × 30 cm × 35 cm, Noldus Information Technologies). Video and behavioral events (e.g., timestamps of pellet dispensing) were collected with Ethovision XT version 10 (Noldus Information Technologies, NED). One side of training chamber contained a 10 cm Petri dish to serve as a tangible cue for the trigger zone, whereas the other contained the pellet receptacle. Mice were progressively trained to remain in the trigger zone for 6 s, completion of which was signaled with a tone (2 s, 2300 Hz). Following the tone, the mice had 6 s to traverse the arena to the pellet dispenser to retrieve a 20 mg pellet. Failure to reach the pellet dispenser within 6 s required the mouse to reenter the trigger zone and initiate a new trial.
Viral expression and implantation.
Anesthesia was induced with 2–3% isoflurane (v/v) and maintained with 0.5%–1.0% isoflurane through a nose cone mounted on a stereotaxic apparatus (Stoelting). A 5 μl Hamilton syringe with a 33-gauge metal needle was used to infuse the virus (AAVDJ-GCaMP6s) with a syringe pump (KD Scientific) at a rate of 50 nl/min−1 with a total volume of 500 nl. All stereotaxic coordinates were in relation to bregma for DMS: anteroposterior, 0.5 mm; mediolateral, +/−1.5 mm; dorsoventral, −2.8 mm. Following the infusion, the needle was kept at the injection site for 5 min then slowly withdrawn. For array and fiber implantation, we followed the same coordinates (anteroposterior, 0.5; mediolateral, 1.5; dorsoventral, −2.6 mm per bregma). The recombinant AAV vectors were serotyped with AAVDJ coat proteins and packaged by the viral vector core at the University of North Carolina.
For in vivo electrophysiology, recordings were obtained with an array with 32 Teflon-coated tungsten microwires (35 μm diameter; Innovative Neurophysiology) implanted into the DMS. For fiber photometry, optical fiber cannulas were implanted (fiber: core of 200 μm; 0.48 NA; M3 thread titanium receptacle; Doric Lenses). Cannulas and electrode arrays were secured to the skull using a base layer of adhesive dental cement (C&B Metabond; Parkell) followed by a second layer of cranioplastic cement (Stoelting). Behavioral testing started 2 weeks after surgery to allow for viral expression and recovery from surgery.
Data processing: in vivo electrophysiology.
Electrical signals were sampled, digitized, time-stamped, and stored for offline analysis using a Plexon recording system. Spike channels were acquired at 40 kHz with 16-bit resolution, and the signal was bandpass filtered at 150 Hz to 3 kHz before spike sorting. Single and multiple units were discriminated using principal component analysis (Offline Sorter; Plexon). MSNs were identified based on waveform shape.
Data processing: fiber photometry.
Mice were connected for fiber photometry with a single optic fiber (core of 200 μm; 0.48 NA; M3 connector; Doric Lenses). Blue light (475 nm Plexbright LED, Plexon) was modulated with an 80 Hz sinusoid waveform from a function generator (B&K Precision, model 4054B) and delivered to the brain at 20–40 μW. The emitted green fluorescence passed through a dichroic mirror and 505–535 nm cut filter (FMC4 port minicube, Doric Lenses) and was detected with a femtowatt silicon photoreceiver (Model 2151, Newport). Analog signals from the detector were amplified and recorded with a digital acquisition system (Omniplex, Plexon).
Raw signals were demodulated and converted to z scores with custom Python scripts that were executed in Neuroexplorer version 5 (scripts available at: https://github.com/KravitzLab). These scripts demodulated the raw signal by returning its power at 79–81 Hz, using the spectrogram analysis in Neuroexplorer version 5. This demodulated signal was transformed into local z scores by subtracting the mean and dividing by the SD of a moving baseline of ±60 s around each data point. This approach corrected for bleaching and standardized fluorescence values in all animals for comparisons.
Data analysis.
Pellet retrieval data from FED were synchronized with electrophysiological or photometry recordings by relaying a TTL output from FED to the data acquisition hardware (OmniPlex; Plexon). We divided events into four task periods: baseline, approach, consumption, and postconsumption. Baseline was defined as 45–30 s before trial initiation, approach defined as 2 s before removing a pellet, consumption defined as 5–10 s following pellet retrieval, and postconsumption defined as 30–45 s after tone onset. Analysis periods were chosen based on visual observation, and identical analyses windows were used for electrophysiology and photometry data. The ramping period was defined as 15–2 s before the pellet retrieval, and signals were evaluated for exhibiting a significant positive or negative correlation with a monotonically increasing straight line (Donnelly et al., 2015; Emmons et al., 2017). Spiking data from this same ramping period were used for the principal component analysis.
For the operant task, we analyzed six task periods during the recordings: Baseline was defined as 60–45 s before tone onset, pretrial was defined as 10–15 s before tone onset, waiting was defined as 0–5 s before tone onset, approach as 5 s before entering zone around feeding device, consumption as 5–10 s following pellet retrieval, and postconsumption as 60–45 s after tone onset.
Video of mouse behavior was processed and quantified with Ethovision XT (Noldus Information Technologies). Data were organized and analyzed in Neuroexplorer version 5. Statistical comparisons were made in GraphPad Prism version 7, via ANOVAs and t tests where specified.
Histology.
Brains were removed and postfixed in 10% formalin for 16–24 h. Brains were transferred to 30% sucrose in PBS for 2–3 d and sectioned at 40 μm on a freezing microtome (Leica). Sections were counter stained with DAPI and mounted on slides for imaging with a slide-scanning microscope (Olympus VS120) at 10×. Fluorescence areas from slide scans were outlined in ImageJ (https://imagej.nih.gov/ij/) and positioned over a corresponding atlas section in Illustrator (Adobe).
Results
To gain an understanding of striatal neural responses during approach and consumption, we performed a meta-analysis of electrophysiological studies that reported the firing rates of rodent striatal neurons during actions around consumption (Fig. 1A). Twenty-two studies were evaluated, of which 17 included information on both excitatory and inhibitory responses and were included in this meta-analysis. The majority (10 of 17) of studies in this analysis used sucrose solution as the task outcome, whereas two used sucrose pellets (Ambroggi et al., 2011; Day et al., 2011), two used an ethanol solution (Janak et al., 1999, 2004), one used saccharin (Wheeler et al., 2008), and two used water (Carelli et al., 2000; Khamassi et al., 2008). Regardless of the task outcome, the majority of accumbal spiking responses during consumption were inhibitory (one-sample t test, p < 0.0001; Fig. 1B). Nine of these studies also reported responses to actions that directly preceded consumption, including nose-pokes, lever-presses, or approach. Responses during these actions were heterogeneous and did not reveal a significant trend toward excitation or inhibition (one-sample t test, p = 0.22; Fig. 1C).
Figure 1.

Meta-analysis of neural responses to approach and consumption during electrophysiology recordings. A, Schematic of investigated behaviors. B, Proportion of inhibitory versus excitatory responses during consumption. C, Proportion of inhibitory versus excitatory responses during action and/or approach.
As most of the prior studies were recorded in the ventral striatum or nucleus accumbens, we performed in vivo electrophysiological recordings to evaluate responses in the dorsal striatum during consumption of and approach to food (Fig. 2A). We took advantage of a pellet-dispensing device developed by our laboratory that identifies the time each food pellet is removed by the mouse by emitting a digital pulse (Nguyen et al., 2016, 2017). Fifty extracellularly recorded single or multiunits were recorded from 5 mice while they freely ate food pellets from this device. Consistent with prior research in the accumbens, the most common response to pellet consumption was inhibition (15 neurons, 30%; Fig. 2B,F), whereas a smaller number (6 neurons, 12%) were excited during consumption (z test, p < 0.05; Fig. 2E). Fourteen neurons were inhibited, whereas 10 were excited during approach (Fig. 2B–D; z test, p = 0.35). Interestingly, only 1 of 10 neurons that were activated during approach was modulated during consumption (firing of this neuron remained elevated during consumption), whereas 7 of 15 neurons that were inhibited during approach were also inhibited during consumption (Fig. 2D). Overall, the results indicate that neurons that were excited during approach were largely distinct from those that were modulated during consumption, whereas neurons that were inhibited during approach often maintained this inhibition through consumption.
Figure 2.

Dorsal striatal phasic responses to food approach and consumption. A, Schematic of analyzed behavior and histology showing recording array locations. X's indicate histological estimate of the center of recording arrays on a coronal section of a mouse brain. B, Proportion of neural responses to approach, consumption, and overlapping responses. C–F, Top to bottom, Example perievent histograms, its corresponding firing rate, and average firing rate for approach increase, approach decrease, consumption increase, and consumption decrease responses. Average firing rate expressed as z score for the corresponding groups, with shaded error bars indicating SEM. Time 0 (seconds) aligned to pellet retrieval.
A growing literature suggests that cortical and striatal brain areas encode timing between behavioral events through accumulating “ramps” in activity (Narayanan and Laubach, 2009; Ding, 2015; Donnelly et al., 2015; Emmons et al., 2017). These are typically thought to track temporal progress toward goals in tasks that require animals to time their behavioral responses (Ma et al., 2014; Narayanan, 2016). Although we did not impose any temporal delays in this experiment, we considered whether such ramps in activity might exist leading up to each pellet retrieval. Ramping activity has been quantified in two ways in the literature: linear regression or principal component analysis. We first used linear regression to analyze the period between 2 and 15 s preceding pellet retrieval and looked for ramping changes in activity (monotonic increases or decreases in activity). We observed ramping changes in activity in 20 (40%) of the units, with 7 decreasing and 13 increasing (Fig. 3A–C). Group mean plots of all ramping neurons are shown in Figure 3D, E.
Figure 3.
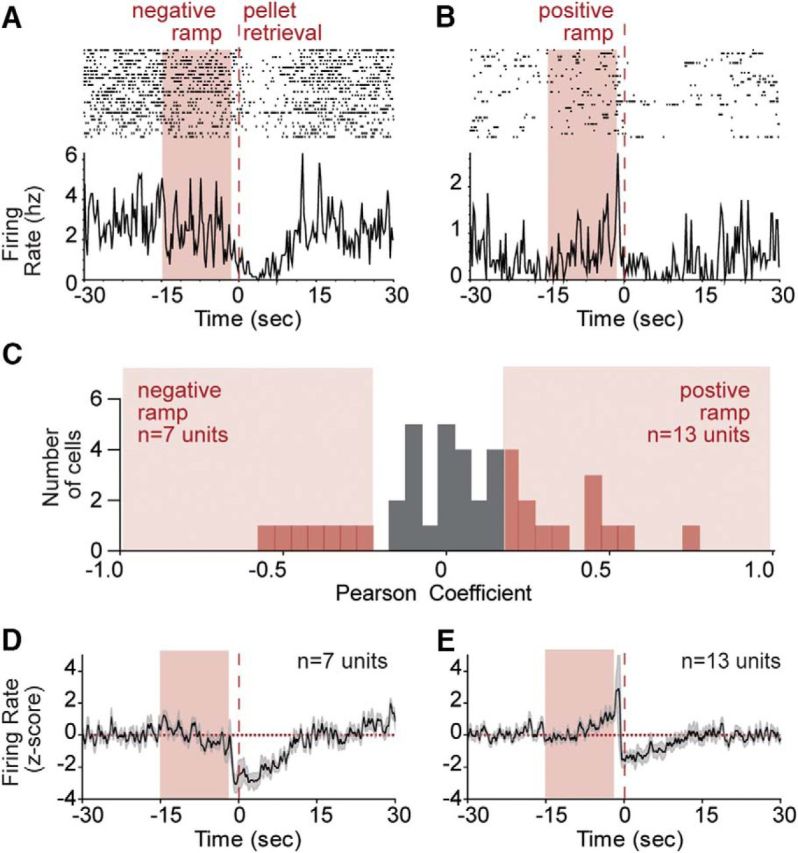
Ramping signals in the dorsal striatum leading up to pellet retrieval. A, Example of a negative ramping neuron. B, Example of a positive ramping neuron. C, Distribution of Pearson correlation coefficients for ramping in all recorded neurons, with significantly ramping neurons in red bars. D, Average firing rate of all negative ramping neurons. E, Average firing rate of all positive ramping neurons. Average firing rate expressed as z score for the corresponding groups, with shaded error bars indicating SEM. Time 0 (seconds) aligned to pellet retrieval.
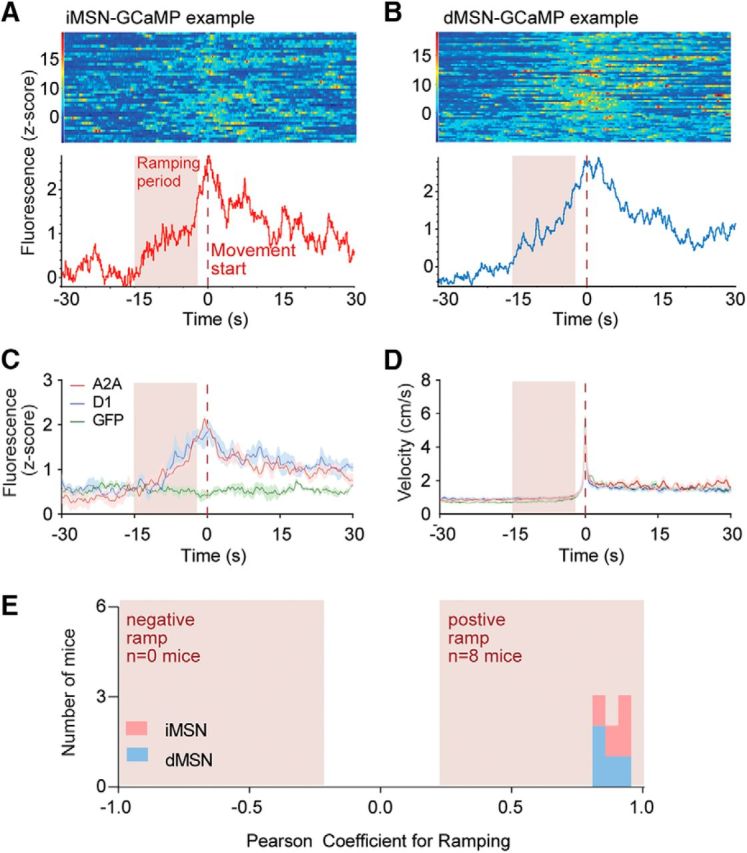
We next sought to evaluate the responses of the two main projection pathways of the striatum during these same behavioral periods. To investigate the population calcium responses of iMSNs and dMSNs during approach and consumption, we expressed GCaMP6s in each population using a cre-dependent viral strategy (Fig. 4A). We used fiber photometry (Fig. 4B,E) to record fluctuations in population fluorescence as mice ate pellets. We did not detect any difference in overall transient rates between iMSNs and dMSNs (two-tailed t test, p = 0.29; Fig. 4C). Recordings lasted ∼8.5 h and were run overnight to capture naturalistic eating without requiring food restriction (Fig. 4D). We quantified fluorescence in each pathway during four defined task periods: baseline, approach, consumption, and postconsumption (see Materials and Methods). GFP-expressing animals (n = 3) were recorded to control for potential effects of movement and did not exhibit transients or modulation around the pellet removal (Fig. 4C,E).
Figure 4.

Using fiber photometry to record bulk calcium signals from striatal subpopulations. A, Coronal section at (0.5 mm) anterior to bregma for GCaMP6s expression. B, Fiber-photometry system schematic with feeding device. C, Transient rate by genotype. D, Example path plot of behavior in chamber. E, Example calcium traces from iMSN-GCaMP-, dMSN-GCaMP-, and GFP-expressing animals.
Example responses for an iMSN and dMSN mouse are provided in Figure 5A, B. The response profile for each population was very similar, showing a ramping increase leading up to the pellet retrieval, and an inhibition of activity during the subsequent consumption period. By repeated-measures ANOVA, we detected a significant effect of task period (F(3,24) = 16, p < 0.0001), genotype (F(2,8) = 8, p < 0.02), and interaction (F(6,24) = 3.6, p < 0.02) on fluorescence levels. Post hoc tests revealed that, relative to baseline, dMSNs (p < 0.005) were significantly activated, whereas iMSNs trended toward an activation (p = 0.10) during approach to the pellet (Fig. 5C,D). Both populations were significantly inhibited during consumption (both p < 0.05). Neither approach nor consumption resulted in significant alterations in GFP expressing animals (all p < 0.70). Velocity of the mice is presented in Figure 5E. Counter to our earlier hypothesis, both striatal pathways were activated during approach and were inhibited during consumption. In addition, we analyzed whether ramping of activity occurred in these two groups leading up to the pellet retrieval (again using the period of 2–15 s preceding pellet retrieval). Despite the heterogeneity of ramping signals in the spiking data, recordings from both pathways were homogeneous, and both ramped in a positive direction leading up to pellet retrieval (Fig. 5F).
Figure 5.

Population calcium activity during approach and consumption. A, Example response around pellet retrieval of a mouse expressing GCaMP6s in iMSNs. Single trials are represented in the heat map, whereas average calcium signal is represented in the trace below. B, Same as in A for a mouse expressing GCaMP6s in dMSNs. C, Average fluorescence around pellet retrieval. D, Average fluorescence power during task periods: baseline, approach, consumption, and postconsumption. E, Velocity around time of pellet retrieval. F, Distribution of Pearson correlation coefficients for ramping in all recorded mice. Circles represent values from individual mice. *Significance from baseline. Red dashed line at time 0 indicates pellet retrieval.
To ask whether the ramping signals were specific to actions directed at obtaining pellets, or whether they might be a general feature of action selection in the striatum, we analyzed the spiking and photometry data around spontaneous movements that were preceded by 30 s of rest and occurred at least 30 s away from any pellet retrieval (Fig. 6A,B). We observed ramping activity leading up to these movement events in 21 (42%) of the recorded units in our electrophysiological recordings, with 9 decreasing and 12 increasing (Fig. 6C–E). This indicates that these signals are not specific to actions that resulted in pellets but may be a more general feature of striatal signaling preceding actions. Despite the heterogeneity of ramping signals in the spiking data, photometry recordings were again homogeneous between the pathways, and both ramped in a positive direction leading up to spontaneous movements (Fig. 7A–C,E).
Figure 6.

Striatal neurons also ramp before spontaneous movements that do not result in pellets. A, Schematic of analysis used to identify movement events. B, Average velocity trace of identified movements. C, Distribution of Pearson correlation coefficients for ramping in all recorded neurons, with significantly ramping neurons in red bars. D, Average firing of positive ramping units. E, Average firing of positive ramping units. Average firing rate expressed as z score for the corresponding groups, with shaded error bars indicating SEM. Time 0 (seconds) aligned to movement start.
Figure 7.
Population calcium signals show strong ramping before spontaneous movements that do not result in pellets. A, Example response around start of movement of a mouse expressing GCaMP6s in iMSNs. Single trials are represented in the heat map, whereas average calcium signal is represented in the trace below. B, Same as in A for a mouse expressing GCaMP6s in dMSNs. C, Average fluorescence around start of movement for all genotypes. D, Average velocity around start of movement for all genotypes. E, Distribution of Pearson correlation coefficients for ramping in all recorded mice. Red dashed line at time 0 indicates start of movement.
These analyses support the conclusion that the heterogeneity in the spiking data cannot be explained by differences between iMSN and dMSN population activity. In addition, ramping analyses revealed a distinction between population spiking and photometry data, suggesting that photometry recordings may not simply reflect average spiking of the underlying population of neurons. As the two populations of neurons had very similar response profiles, we pooled the photometry data to formally compare it with average spiking data in the ramping period. At the population average, little ramping was observed in the spiking data preceding pellet retrievals or spontaneous movements (Fig. 8A–D). This was not surprising, given that only 40% of neurons showed significant ramps, and these were in both positive and negative directions. In contrast, ramps were observed in the pooled photometry data for both task events (Fig. 8E,F). We compared the strength of ramping by examining Pearson correlation coefficients for the spiking versus photometry data, and found that the photometry recordings had significantly higher ramping than the spiking data for both pellet retrieval (average spiking r = 0.06, average photometry r = 0.65, p < 0.01), and spontaneous movements (average spiking r = −0.15, average photometry r = 0.88, p < 0.0001; Fig. 8G,H).
Figure 8.
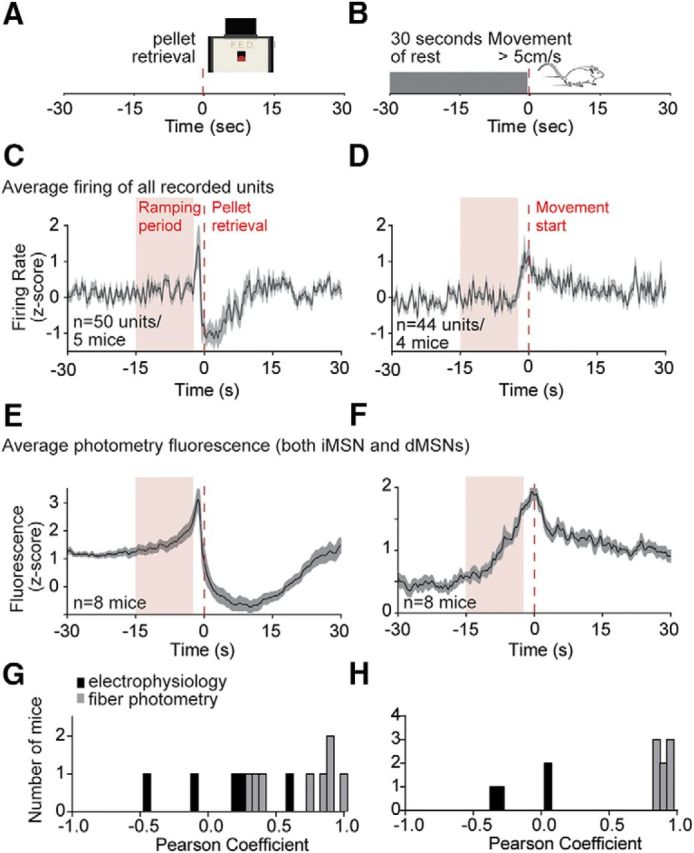
Comparison of ramping signals in electrophysiology and population calcium recordings, for pellet retrievals and spontaneous movements. A, B, Schematic of pellet retrieval (left) or spontaneous movement (right) events. C, D, Average firing of all recorded units around pellet retrieval (left) or spontaneous movement (right). E, F, Average population calcium signal (both pathways) around pellet retrieval (left) or spontaneous movement (right). G, H, Distributions of Pearson correlation coefficients for ramping of average firing and population calcium signals in all recorded mice leading up to pellet retrieval (left) or spontaneous movements (right).
Principal component analysis has also been used to identify ramping in population signals that may otherwise elude detection in individual neural spike trains (Narayanan and Laubach, 2009; Ma et al., 2014; Emmons et al., 2017). To examine whether we were undersampling ramping at the population level through our regression analysis, we also performed a principal component analysis of the spiking data around pellet retrievals and spontaneous movements. The first four principal components are plotted in Figure 9 and demonstrate task-related modulations, but there is little evidence of ramping at the population level leading up to these task events.
Figure 9.

Principal component (PC) analyses of firing around behavioral events. A, First 4 PCs of firing rates of all units leading up to pellet retrieval. B, First 4 PCs of firing rates of all units leading up to spontaneous movement. C, D, Percentage of variance explained by each PC for data in A and B.
The above experiments demonstrate that striatal neurons ramp before two types of actions: pellet retrieval and spontaneous movements that did not result in a pellet. Although the spontaneous movements did not result in a pellet, we could not rule out that they were also directed at a pellet as they were recorded in the same session as the pellet feeding. Therefore, it remains unclear whether the ramping signals reflect actions that lead to the pellet, to consumption itself, or to both. To distinguish between these possibilities, mice were trained to perform a sequence of events to receive a pellet. Importantly, mice did not receive a pellet until the entire chain was complete, which allowed us to evaluate whether the ramping signals terminated at the initiation of the chain and/or at the delivery of the pellet (Movie 1).
Example of mouse performing the task with text highlighting relevant task events.
Mice initiated behavioral sequences by entering a “trigger zone” in the behavioral chamber. After remaining in this zone for 6 s, a 2 s tone signaled the availability of a chow pellet and the mice had 6 s to approach the pellet well to retrieve a pellet (Fig. 10A,B). Failure to approach the pellet well within 6 s resulted in no pellet delivery and required mice to reinitiate a new trial. Sessions were run at night and mice received their entire nighttime caloric needs via this task (∼100 pellets resulting in ∼7 Kcal/night). The mice from the prior experiment, plus an additional 2 iMSN-GCaMP and 3 dMSN-GCaMP mice were trained on this task (6 iMSN-GCaMP and 7 dMSN-GCaMP mice in total). During recording sessions, mice completed 57% of the trials they initiated, with the incomplete trials split between “no move” trials (25%), in which the mice remained in the trigger zone for at least 6 s following the tone, and “wrong move” trials, in which mice left the trigger zone but did not approach the pellet well within 6 s (18%; Fig. 10C).
Figure 10.
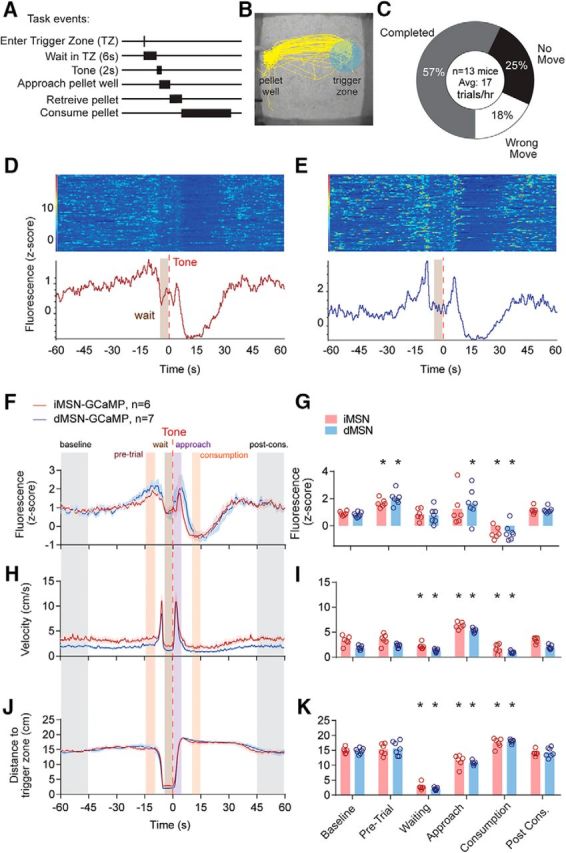
Changes in calcium activity during completed trials. A, Diagram of behavioral task events. B, Example path plot of completed trials. C, Averaged proportion of completed, no movement, and wrong movement trials. D, Example response of successfully completed trials around tone of a mouse expressing GCaMP6s in iMSNs. Single trials are represented in the heat map, whereas average calcium signal is represented in the trace below. E, Same as in D for a mouse expressing GCaMP6s in dMSNs. F, G, Average fluorescence. H, I, Velocity. J, K, Distance to trigger zone during completed trials. Colored bars represent trial periods. Average fluorescence in z score for the corresponding groups with colored error bars (SEM). Time 0 (seconds) indicates tone onset. *Significant difference from baseline.
Calcium activity in both populations increased in a ramping manner starting ∼15 s before the start of each trial and terminated at the initiation of each trial (Fig. 10D–F). A repeated-measures ANOVA of GCaMP6 fluorescence during six task periods (baseline, pretrial, waiting, approach, consumption, and postconsumption) revealed a significant effect of task period (F(5,55) = 22, p < 0.0001), but not genotype nor interaction (both p > 0.49). Post hoc tests revealed that this effect of task period was driven by activation of both pathways during the period before the trial initiation (termed: pretrial period, both p < 0.05), as well as inhibition of both pathways during consumption (both p < 0.005) (Fig. 10G).
We considered whether this ramping activity reflected changes in velocity leading up to trial initiation. A repeated-measures ANOVA of velocity revealed a significant effect of task period (F(5,55) = 210, p < 0.0001), which was driven by the waiting, approach, and consumption periods (Fig. 10H,I). Velocity was not significantly altered for either group during the pretrial period (both p > 0.17). We also considered whether the ramping signal might reflect a gradual approach of the mouse toward the trigger zone. Again, while a repeated-measures ANOVA revealed a significant effect of task period on this distance (F(5,55) = 203, p < 0.0001), this was driven by changes during the waiting, approach, and consumption periods (Fig. 10J,K). Distance was not significantly altered during the pretrial period for iMSNs (p > 0.28); and although there was a trend toward significance for dMSNs (p > 0.06), the difference was a small shift away from the trigger zone (∼1.5 cm; Fig. 10J,K). As we could not observe any significant change in behavior during this pretrial activity, we conclude that these ramping signals reflects something internal to the mouse, such as the expectation or planning of future actions.
Finally, we examined whether the pretrial activity might reflect the performance of the mice on the task, or errors (Fig. 11A,E). Two types of errors were evaluated: “no movement” errors, in which mice remained in the trigger zone for a full 6 s following the tone; and “wrong movement” errors, in which mice left the trigger zone following the tone but did not enter the pellet well within 6 s (velocity shown in Fig. 11D,H). A repeated-measures ANOVA examining five task periods (baseline, pretrial, waiting, tone, and after trial) revealed a significant effect of task period (no move: F(4,44) = 24, p < 0.001; wrong move: F(4,44) = 5.3. p < 0.05), but not genotype nor interaction for both conditions (all p < 0.30; Fig. 11B,C,F,G). Post hoc analyses revealed that “no movement” and “wrong movement” trials in both pathways were characterized by elevated activity in the pretrial period (all p < 0.05). No move trials were also characterized by significantly inhibited calcium activity in iMSNs during both the waiting and tone periods (p < 0.05), whereas wrong movement trials were characterized by significantly elevated iMSN activity during the tone/movement period (p < 0.05). These results indicate that (1) population calcium activity during the pretrial period was elevated in both pathways regardless of task outcome; and (2) errors on the task were associated with dysregulation of iMSN signaling during the task itself.
Figure 11.
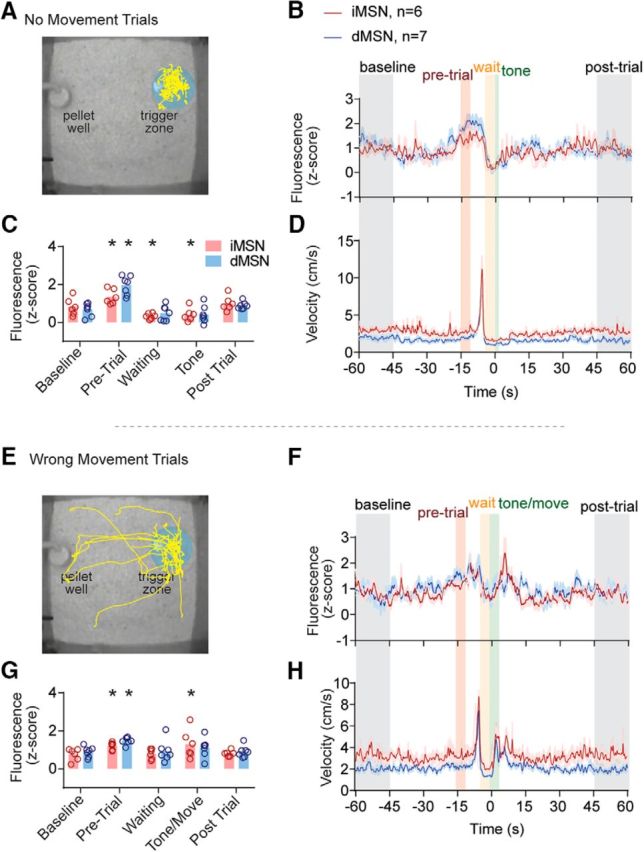
Changes in calcium activity during error trials A, Example path plot during no movement trials. B, D, Average fluorescence and velocity trace during no movement trials. C, Average fluorescence power during five trial periods: baseline, pretrial, waiting, tone, and postconsumption. E–H, Same as A–D for wrong movement trials. Colored bars represent trial periods. Average fluorescence in z score for the corresponding groups with colored error bars (SEM). Time 0 (seconds) indicates tone onset. *Significant difference from baseline.
Discussion
Here, we examined the relationship between neural activity in the dorsal striatum to the approach and consumption of food. Consistent with recordings from the ventral striatum, dorsal striatal neurons exhibited a mix of excitatory and inhibitory responses during approach to food, and mainly inhibitory responses during consumption. Striatal dMSNs have been linked to reinforcement (Hikida et al., 2010; Lobo et al., 2010; Ferguson et al., 2011; Kravitz and Kreitzer, 2012), leading us to initially hypothesize that consumption-related inhibitory responses may occur more strongly in iMSNs than dMSNs. However, recording of population calcium signals revealed that both pathways were inhibited to similar degrees during the consumption of food pellets. This suggests that both pathways contributed to the inhibitory responses observed during electrophysiological recordings during consumption (Nicola et al., 2004b; Taha and Fields, 2006; Krause et al., 2010), and argues that consumption is associated with a coordinated inhibition of both pathways. Interestingly, a recent study on the ventral striatum reported sustained elevations in calcium activity during consumption (Natsubori et al., 2017). The difference between our result and this result may reflect differences in calcium indicator that was used, the task design, or location of recordings.
Despite heterogenous spiking responses, which included a mix of inhibition and excitation during approach to the pellet, population calcium activity in both pathways was activated during the approach to food. This is consistent with optogenetic studies that demonstrate that stimulation of dMSNs reinforced approach to stimuli (Kravitz et al., 2012; Yttri and Dudman, 2016), but unclear how it relates to demonstration from these same studies that iMSN activation can reduce behavior. These results are also consistent with reports of activation of both striatal pathways during actions (Cui et al., 2013; Isomura et al., 2013; Tecuapetla et al., 2014; Barbera et al., 2016; Klaus et al., 2017), and before food reward (Natsubori et al., 2017). Together, our results support a model in which MSNs of both pathways are engaged during approach and inhibited during consumption. It remains unclear how these homogeneous population responses relate to the opposing behavioral changes elicited by optogenetic stimulation (Kravitz et al., 2012; Yttri and Dudman, 2016).
Finally, we observed ramping changes in both spiking activity and population calcium signals that started up to 15 s before actions. In the free-feeding task, we observed ramping changes in spiking in ∼40% of the recorded neurons, with approximately two-thirds increasing and one-third decreasing. In this same task, we observed ramping changes in the population calcium signals, which ramped in a positive direction in all mice. This difference from the spiking data may reflect the fact that more individual neurons ramped in a positive direction in this task, or it may reflect an inherent difference between electrophysiology and population calcium recordings. We trained mice on an operant task to disambiguate whether the ramping signals preceded actions or consumption. Here, we observed that ramping increases in calcium activity preceded the initiation of each trial, rather than consumption. These ramps may reflect upcoming actions (Ma et al., 2014; Emmons et al., 2017).
We also investigated firing around spontaneous movements that did not result in pellets, and noted that spiking of individual neurons ramped during this period as well. Again, both positive and negative ramps were observed in the spiking data, whereas only positive ramping was observed in the population calcium signals. As these ramps occurred in periods that explicitly preceded movement, they support the conclusion that the ramping signals do not reflect changes in velocity of the mice. In the operant task, we also found that the ramps did not reflect a gradual change in the velocity or position of the mice relative to the trial-initiation zone. As we did not observe any global behavioral correlate of these ramping signals, we believe they may reflect premotor activity or expectation of upcoming actions. That said, it is possible that these ramps reflect behavioral correlates that we were not able to observe with an overhead camera, such as mouth movements or changes in posture or limb positions.
Although the ramping signals did not track changes in observable movement parameters, both spiking and population calcium activity reflected changes in velocity around movement initiation in these experiments. Spiking and calcium population signals were elevated around the start of movement in both pellet-directed and spontaneous movements in the free-feeding task and the operant task. This is consistent with literature showing increased spiking and calcium signals at the initiation of learned actions/action sequences in the striatum (Costa et al., 2004; Cui et al., 2013; Isomura et al., 2013; Jin et al., 2014; Yttri and Dudman, 2016) or voluntary movements (Barbera et al., 2016). Thus, although the ramping signal is not a movement or locomotor correlate, neurons in our task do also demonstrate locomotor correlates. As the ramping signal precedes movement, we suspect it may relate to the selection of upcoming actions.
Ramping signals have been described in cortex of both rodents and primates (Shidara and Richmond, 2002; Narayanan and Laubach, 2009; Ma et al., 2014; Ding, 2015; Donnelly et al., 2015; Narayanan, 2016; Emmons et al., 2017). In cortex, ramping signals are commonly thought to reflect timing, as they occur during experimenter-imposed delay periods in tasks, and scale with the length of these delays. Inhibiting the mPFC or impairing dopamine D1 receptor function in the mPFC, impairs an animal's ability in interval timing tasks that require delays, suggesting that ramping in these regions may be necessary for the timing of these tasks (Narayanan et al., 2012; Parker et al., 2014). The cortical regions where ramping has been described (most commonly mPFC) project to the DMS and may transmit ramping signals to the striatum (Emmons et al., 2017). Ramps have also been described in striatum, in approximately the same prevalence observed in our electrophysiology experiments here, although ramps occur at a lower prevalence in striatum than cortex (Ma et al., 2014; Emmons et al., 2017). Additionally, ramping increases in dopamine levels have been reported to indicate value or distance to reward, and such changes in dopamine may alter the excitability of striatal neurons (Howe et al., 2013; Morita and Kato, 2014). As our recordings occurred in the DMS, the ramps we observed may be especially relevant to action-outcome relationships, such as those that resulted in pellets here. While similar signals may occur in other striatal regions, we would expect that they may underlie different behavioral processes in those regions. Although the ramping we observed here did not occur during experimenter-imposed delays, it may reflect similar phenomena as the ramps described under such conditions in cortex and striatum. Because of differences in task design, it is also possible that the phenomena reported here reflect a different process.
Interestingly, the ramping signals differed substantially between the electrophysiology and population calcium recordings. Ramping was a very strong component of the population calcium signal that preceded actions in all conditions. In contrast, ramping was a somewhat minor component of the spiking data and was not observed at the level of population averages. If population calcium reflected the average spiking of the underlying population, we would expect the signals to more closely resemble one another. There are several reasons why this did not appear to be the case. First, population calcium recordings can be influenced by both somatic action potentials and subthreshold events. In contrast, extracellular electrophysiology can only record superthreshold spiking events. If the ramping signals are transmitted to the striatum from cortex, they may cause changes in dendritic calcium that may not lead to changes in spiking of striatal neurons. In addition, MSNs have dense collateral projections within the striatum (Dobbs et al., 2016), which may also be detected in population calcium recordings. Third, the time course of GCaMP fluorescence is much slower than electrical recordings. Single action potentials can evoke neuronal calcium responses that last multiple seconds (Ghitani et al., 2017). It is possible that the summation of a minority population of ramping neurons could result in a sustained increase in global fluorescence that would not be observed with electrical recording. Finally, it is worth noting that, with both spiking and photometry, it is difficult to dissociate linear increases in spiking rate on single trials from “step-like” changes in activity that occur at different times relative to actions on different trials (Latimer et al., 2015). In photometry recordings, this difficulty is compounded by the population nature of the recorded signal; therefore, our results do not inform whether single striatal neurons ramp linearly, versus exhibit “step-like” changes in firing at variable times on individual trials. Further work will be needed to investigate these possibilities and understand how population calcium signals relate to the activity in individual neurons within the underlying neural population.
Footnotes
This work was supported by National Institutes of Health Intramural Research Program (National Institute of Diabetes and Digestive and Kidney Diseases). T.D.L. was supported by National Institute on Drug Abuse Scientific Director's Fund for Diversity in Research. We thank the GENIE project at Janelia Research Campus for GCaMP reagents.
The authors declare no competing financial interests.
References
- Albin RL, Young AB, Penney JB (1989) The functional anatomy of basal ganglia disorders. Trends Neurosci 12:366–375. 10.1016/0166-2236(89)90074-X [DOI] [PubMed] [Google Scholar]
- Ambroggi F, Ghazizadeh A, Nicola SM, Fields HL (2011) Roles of nucleus accumbens core and shell in incentive-cue responding and behavioral inhibition. J Neurosci 31:6820–6830. 10.1523/JNEUROSCI.6491-10.2011 [DOI] [PMC free article] [PubMed] [Google Scholar]
- Balleine BW, Delgado MR, Hikosaka O (2007) The role of the dorsal striatum in reward and decision-making. J Neurosci 27:8161–8165. 10.1523/JNEUROSCI.1554-07.2007 [DOI] [PMC free article] [PubMed] [Google Scholar]
- Barbera G, Liang B, Zhang L, Gerfen CR, Culurciello E, Chen R, Li Y, Lin DT (2016) Spatially compact neural clusters in the dorsal striatum encode locomotion relevant information. Neuron 92:202–213. 10.1016/j.neuron.2016.08.037 [DOI] [PMC free article] [PubMed] [Google Scholar]
- Carelli RM, Ijames SG, Crumling AJ (2000) Evidence that separate neural circuits in the nucleus accumbens encode cocaine versus “natural” (water and food) reward. J Neurosci 20:4255–4266. [DOI] [PMC free article] [PubMed] [Google Scholar]
- Contreras-Rodríguez O, Martín-Pérez C, Vilar-López R, Verdejo-Garcia A (2017) Ventral and dorsal striatum networks in obesity: link to food craving and weight gain. Biol Psychiatry 81:789–796. 10.1016/j.biopsych.2015.11.020 [DOI] [PubMed] [Google Scholar]
- Costa RM, Cohen D, Nicolelis MA (2004) Differential corticostriatal plasticity during fast and slow motor skill learning in mice. Curr Biol 14:1124–1134. 10.1016/j.cub.2004.06.053 [DOI] [PubMed] [Google Scholar]
- Cui G, Jun SB, Jin X, Pham MD, Vogel SS, Lovinger DM, Costa RM (2013) Concurrent activation of striatal direct and indirect pathways during action initiation. Nature 494:238–242. 10.1038/nature11846 [DOI] [PMC free article] [PubMed] [Google Scholar]
- Day JJ, Jones JL, Carelli RM (2011) Nucleus accumbens neurons encode predicted and ongoing reward costs in rats. Eur J Neurosci 33:308–321. 10.1111/j.1460-9568.2010.07531.x [DOI] [PMC free article] [PubMed] [Google Scholar]
- DeLong MR. (1990) Primate models of movement disorders of basal ganglia origin. Trends Neurosci 13:281–285. 10.1016/0166-2236(90)90110-V [DOI] [PubMed] [Google Scholar]
- DiFeliceantonio AG, Mabrouk OS, Kennedy RT, Berridge KC (2012) Enkephalin surges in dorsal neostriatum as a signal to eat. Curr Biol 22:1918–1924. 10.1016/j.cub.2012.08.014 [DOI] [PMC free article] [PubMed] [Google Scholar]
- Ding L. (2015) Distinct dynamics of ramping activity in the frontal cortex and caudate nucleus in monkeys. J Neurophysiol 114:1850–1861. 10.1152/jn.00395.2015 [DOI] [PMC free article] [PubMed] [Google Scholar]
- Dobbs LK, Kaplan AR, Lemos JC, Matsui A, Rubinstein M, Alvarez VA (2016) Dopamine regulation of lateral inhibition between striatal neurons gates the stimulant actions of cocaine. Neuron 90:1100–1113. 10.1016/j.neuron.2016.04.031 [DOI] [PMC free article] [PubMed] [Google Scholar]
- Donnelly NA, Paulsen O, Robbins TW, Dalley JW (2015) Ramping single unit activity in the medial prefrontal cortex and ventral striatum reflects the onset of waiting but not imminent impulsive actions. Eur J Neurosci 41:1524–1537. 10.1111/ejn.12895 [DOI] [PMC free article] [PubMed] [Google Scholar]
- Emmons EB, De Corte BJ, Kim Y, Parker KL, Matell MS, Narayanan NS (2017) Rodent medial frontal control of temporal processing in the dorsomedial striatum. J Neurosci 37:8718–8733. 10.1523/JNEUROSCI.1376-17.2017 [DOI] [PMC free article] [PubMed] [Google Scholar]
- Ferguson SM, Eskenazi D, Ishikawa M, Wanat MJ, Phillips PE, Dong Y, Roth BL, Neumaier JF (2011) Transient neuronal inhibition reveals opposing roles of indirect and direct pathways in sensitization. Nat Neurosci 14:22–24. 10.1038/nn.2703 [DOI] [PMC free article] [PubMed] [Google Scholar]
- Frank GK, Bailer UF, Henry SE, Drevets W, Meltzer CC, Price JC, Mathis CA, Wagner A, Hoge J, Ziolko S, Barbarich-Marsteller N, Weissfeld L, Kaye WH (2005) Increased dopamine D2/D3 receptor binding after recovery from anorexia nervosa measured by positron emission tomography and [11c]raclopride. Biol Psychiatry 58:908–912. 10.1016/j.biopsych.2005.05.003 [DOI] [PubMed] [Google Scholar]
- Furlong TM, Jayaweera HK, Balleine BW, Corbit LH (2014) Binge-like consumption of a palatable food accelerates habitual control of behavior and is dependent on activation of the dorsolateral striatum. J Neurosci 34:5012–5022. 10.1523/JNEUROSCI.3707-13.2014 [DOI] [PMC free article] [PubMed] [Google Scholar]
- Gerfen CR, Engber TM, Mahan LC, Susel Z, Chase TN, Monsma FJ Jr, Sibley DR (1990) D1 and D2 dopamine receptor regulated gene-expression of striatonigral and striatopallidal neurons. Science 250:1429–1432. 10.1126/science.2147780 [DOI] [PubMed] [Google Scholar]
- Ghitani N, Barik A, Szczot M, Thompson JH, Li C, Le Pichon CE, Krashes MJ, Chesler AT. 2017. Specialized mechanosensory nociceptors mediating rapid responses to hair pull. Neuron 95:944–954.e4. [DOI] [PMC free article] [PubMed] [Google Scholar]
- Gremel CM, Costa RM (2013) Orbitofrontal and striatal circuits dynamically encode the shift between goal-directed and habitual actions. Nat Commun 4:2264. 10.1038/ncomms3264 [DOI] [PMC free article] [PubMed] [Google Scholar]
- Hikida T, Kimura K, Wada N, Funabiki K, Nakanishi S (2010) Distinct roles of synaptic transmission in direct and indirect striatal pathways to reward and aversive behavior. Neuron 66:896–907. 10.1016/j.neuron.2010.05.011 [DOI] [PubMed] [Google Scholar]
- Howe MW, Tierney PL, Sandberg SG, Phillips PE, Graybiel AM. 2013. Prolonged dopamine signalling in striatum signals proximity and value of distant rewards. Nature 500:575–579. [DOI] [PMC free article] [PubMed] [Google Scholar]
- Isomura Y, Takekawa T, Harukuni R, Handa T, Aizawa H, Takada M, Fukai T (2013) Reward-modulated motor information in identified striatum neurons. J Neurosci 33:10209–10220. 10.1523/JNEUROSCI.0381-13.2013 [DOI] [PMC free article] [PubMed] [Google Scholar]
- Janak PH, Chang JY, Woodward DJ (1999) Neuronal spike activity in the nucleus accumbens of behaving rats during ethanol self-administration. Brain Res 817:172–184. 10.1016/S0006-8993(98)01245-1 [DOI] [PubMed] [Google Scholar]
- Janak PH, Chen MT, Caulder T (2004) Dynamics of neural coding in the accumbens during extinction and reinstatement of rewarded behavior. Behav Brain Res 154:125–135. 10.1016/j.bbr.2004.02.003 [DOI] [PubMed] [Google Scholar]
- Jin X, Tecuapetla F, Costa RM (2014) Basal ganglia subcircuits distinctively encode the parsing and concatenation of action sequences. Nat Neurosci 17:423–430. 10.1038/nn.3632 [DOI] [PMC free article] [PubMed] [Google Scholar]
- Jones JL, Wheeler RA, Carelli RM (2008) Behavioral responding and nucleus accumbens cell firing are unaltered following periods of abstinence from sucrose. Synapse 62:219–228. 10.1002/syn.20486 [DOI] [PubMed] [Google Scholar]
- Khamassi M, Mulder AB, Tabuchi E, Douchamps V, Wiener SI (2008) Anticipatory reward signals in ventral striatal neurons of behaving rats. Eur J Neurosci 28:1849–1866. 10.1111/j.1460-9568.2008.06480.x [DOI] [PubMed] [Google Scholar]
- Klaus A, Martins GJ, Paixao VB, Zhou P, Paninski L, Costa RM. 2017. The spatiotemporal organization of the striatum encodes action space. Neuron 95:1171–1180.e7. [DOI] [PMC free article] [PubMed] [Google Scholar]
- Krause M, German PW, Taha SA, Fields HL (2010) A pause in nucleus accumbens neuron firing is required to initiate and maintain feeding. J Neurosci 30:4746–4756. 10.1523/JNEUROSCI.0197-10.2010 [DOI] [PMC free article] [PubMed] [Google Scholar]
- Kravitz AV, Kreitzer AC (2012) Striatal mechanisms underlying movement, reinforcement, and punishment. Physiology (Bethesda) 27:167–177. 10.1152/physiol.00004.2012 [DOI] [PMC free article] [PubMed] [Google Scholar]
- Kravitz AV, Tye LD, Kreitzer AC (2012) Distinct roles for direct and indirect pathway striatal neurons in reinforcement. Nat Neurosci 15:816–818. 10.1038/nn.3100 [DOI] [PMC free article] [PubMed] [Google Scholar]
- Latimer KW, Yates JL, Meister ML, Huk AC, Pillow JW (2015) NEURONAL MODELING: single-trial spike trains in parietal cortex reveal discrete steps during decision-making. Science 349:184–187. 10.1126/science.aaa4056 [DOI] [PMC free article] [PubMed] [Google Scholar]
- Lobo MK, Covington HE 3rd, Chaudhury D, Friedman AK, Sun H, Damez-Werno D, Dietz DM, Zaman S, Koo JW, Kennedy PJ, Mouzon E, Mogri M, Neve RL, Deisseroth K, Han MH, Nestler EJ (2010) Cell type-specific loss of BDNF signaling mimics optogenetic control of cocaine reward. Science 330:385–390. 10.1126/science.1188472 [DOI] [PMC free article] [PubMed] [Google Scholar]
- Ma L, Hyman JM, Phillips AG, Seamans JK (2014) Tracking progress toward a goal in corticostriatal ensembles. J Neurosci 34:2244–2253. 10.1523/JNEUROSCI.3834-13.2014 [DOI] [PMC free article] [PubMed] [Google Scholar]
- Morita K, Kato A (2014) Striatal dopamine ramping may indicate flexible reinforcement learning with forgetting in the cortico-basal ganglia circuits. Front Neural Circuits 8:36. 10.3389/fncir.2014.00036 [DOI] [PMC free article] [PubMed] [Google Scholar]
- Narayanan NS. (2016) Ramping activity is a cortical mechanism of temporal control of action. Curr Opin Behav Sci 8:226–230. 10.1016/j.cobeha.2016.02.017 [DOI] [PMC free article] [PubMed] [Google Scholar]
- Narayanan NS, Land BB, Solder JE, Deisseroth K, DiLeone RJ (2012) Prefrontal D1 dopamine signaling is required for temporal control. Proc Natl Acad Sci U S A 109:20726–20731. 10.1073/pnas.1211258109 [DOI] [PMC free article] [PubMed] [Google Scholar]
- Narayanan NS, Laubach M (2009) Delay activity in rodent frontal cortex during a simple reaction time task. J Neurophysiol 101:2859–2871. 10.1152/jn.90615.2008 [DOI] [PMC free article] [PubMed] [Google Scholar]
- Natsubori A, Tsutsui-Kimura I, Nishida H, Bouchekioua Y, Sekiya H, Uchigashima M, Watanabe M, de Kerchove d'Exaerde A, Mimura M, Takata N, Tanaka KF (2017) Ventrolateral striatal medium spiny neurons positively regulate food-incentive, goal-directed behavior independently of D1 and D2 selectivity. J Neurosci 37:2723–2733. 10.1523/JNEUROSCI.3377-16.2017 [DOI] [PMC free article] [PubMed] [Google Scholar]
- Nguyen KP, O'Neal TJ, Bolonduro OA, White E, Kravitz AV (2016) Feeding experimentation device (FED): a flexible open-source device for measuring feeding behavior. J Neurosci Methods 267:108–114. 10.1016/j.jneumeth.2016.04.003 [DOI] [PMC free article] [PubMed] [Google Scholar]
- Nguyen KP, et al. 2017. Feeding experimentation device (FED): construction and validation of an open-source device for measuring food intake in rodents. J Vis Exp 2017:120. [DOI] [PMC free article] [PubMed] [Google Scholar]
- Nicola SM, Yun IA, Wakabayashi KT, Fields HL (2004a) Cue-evoked firing of nucleus accumbens neurons encodes motivational significance during a discriminative stimulus task. J Neurophysiol 91:1840–1865. 10.1152/jn.00657.2003 [DOI] [PubMed] [Google Scholar]
- Nicola SM, Yun IA, Wakabayashi KT, Fields H (2004b) Firing of nucleus accumbens neurons during the consummatory phase of a discriminative stimulus task depends on previous reward predictive cues. J Neurophysiol 91:1866–1882. 10.1152/jn.00658.2003 [DOI] [PubMed] [Google Scholar]
- Parker KL, Chen KH, Kingyon JR, Cavanagh JF, Narayanan NS (2014) D1-dependent 4 Hz oscillations and ramping activity in rodent medial frontal cortex during interval timing. J Neurosci 34:16774–16783. 10.1523/JNEUROSCI.2772-14.2014 [DOI] [PMC free article] [PubMed] [Google Scholar]
- Robinson MJ, Burghardt PR, Patterson CM, Nobile CW, Akil H, Watson SJ, Berridge KC, Ferrario CR (2015) Individual differences in cue-induced motivation and striatal systems in rats susceptible to diet-induced obesity. Neuropsychopharmacology 40:2113–2123. 10.1038/npp.2015.71 [DOI] [PMC free article] [PubMed] [Google Scholar]
- Roitman MF, Wheeler RA, Tiesinga PH, Roitman JD, Carelli RM (2010) Hedonic and nucleus accumbens neural responses to a natural reward are regulated by aversive conditioning. Learn Mem 17:539–546. 10.1101/lm.1869710 [DOI] [PMC free article] [PubMed] [Google Scholar]
- Roitman MF, Wheeler RA, Carelli RM (2005) Nucleus accumbens neurons are innately tuned for rewarding and aversive taste stimuli, encode their predictors, and are linked to motor output. Neuron 45:587–597. 10.1016/j.neuron.2004.12.055 [DOI] [PubMed] [Google Scholar]
- Shidara M, Richmond BJ (2002) Anterior cingulate: single neuronal signals related to degree of reward expectancy. Science 296:1709–1711. 10.1126/science.1069504 [DOI] [PubMed] [Google Scholar]
- Taha SA, Fields HL (2005) Encoding of palatability and appetitive behaviors by distinct neuronal populations in the nucleus accumbens. J Neurosci 25:1193–1202. 10.1523/JNEUROSCI.3975-04.2005 [DOI] [PMC free article] [PubMed] [Google Scholar]
- Taha SA, Fields HL (2006) Inhibitions of nucleus accumbens neurons encode a gating signal for reward-directed behavior. J Neurosci 26:217–222. 10.1523/JNEUROSCI.3227-05.2006 [DOI] [PMC free article] [PubMed] [Google Scholar]
- Tecuapetla F, Matias S, Dugue GP, Mainen ZF, Costa RM. 2014. Balanced activity in basal ganglia projection pathways is critical for contraversive movements. Nat Commun 5:4315. [DOI] [PMC free article] [PubMed] [Google Scholar]
- Volkow ND, Wang GJ, Fowler JS, Logan J, Jayne M, Franceschi D, Wong C, Gatley SJ, Gifford AN, Ding YS, Pappas N (2002) “Nonhedonic” food motivation in humans involves dopamine in the dorsal striatum and methylphenidate amplifies this effect. Synapse 44:175–180. 10.1002/syn.10075 [DOI] [PubMed] [Google Scholar]
- Wan X, Peoples LL (2006) Firing patterns of accumbal neurons during a Pavlovian-conditioned approach task. J Neurophysiol 96:652–660. 10.1152/jn.00068.2006 [DOI] [PubMed] [Google Scholar]
- Wheeler RA, et al. 2005. Single neurons in the nucleus accumbens track relative reward. Int J Comp Psychol 18 Available at https://escholarship.org/uc/item/9p1783ph#author. [Google Scholar]
- Wheeler RA, Twining RC, Jones JL, Slater JM, Grigson PS, Carelli RM (2008) Behavioral and electrophysiological indices of negative affect predict cocaine self-administration. Neuron 57:774–785. 10.1016/j.neuron.2008.01.024 [DOI] [PubMed] [Google Scholar]
- Wilson DI, Bowman EM (2004) Nucleus accumbens neurons in the rat exhibit differential activity to conditioned reinforcers and primary reinforcers within a second-order schedule of saccharin reinforcement. Eur J Neurosci 20:2777–2788. 10.1111/j.1460-9568.2004.03747.x [DOI] [PubMed] [Google Scholar]
- Yin HH, Ostlund SB, Knowlton BJ, Balleine BW (2005) The role of the dorsomedial striatum in instrumental conditioning. Eur J Neurosci 22:513–523. 10.1111/j.1460-9568.2005.04218.x [DOI] [PubMed] [Google Scholar]
- Yttri EA, Dudman JT. 2016. Opponent and bidirectional control of movement velocity in the basal ganglia. Nature 533:402–406. [DOI] [PMC free article] [PubMed] [Google Scholar]
- Yun IA, Wakabayashi KT, Fields HL, Nicola SM (2004) The ventral tegmental area is required for the behavioral and nucleus accumbens neuronal firing responses to incentive cues. J Neurosci 24:2923–2933. 10.1523/JNEUROSCI.5282-03.2004 [DOI] [PMC free article] [PubMed] [Google Scholar]
Associated Data
This section collects any data citations, data availability statements, or supplementary materials included in this article.
Supplementary Materials
Example of mouse performing the task with text highlighting relevant task events.