Abstract
Objective
Assess whether differences in speech perception are observed after exclusive listening experience with High Definition Continuous Interleaved Sampling (HDCIS) versus Fine Structure Processing (FSP) coding strategies.
Methods
Subjects were randomly assigned at initial activation of the external speech processor to receive the HDCIS or FSP coding strategy. Frequency filter assignments were consistent across subjects. The speech perception test battery included CNC words in quiet, HINT sentences in quiet and steady noise (+10 dB SNR), AzBio sentences in quiet and a 10-talker babble (+10 dB SNR), and BKB-SIN. Assessment intervals included 1, 3 and 6 months post-activation.
Results
Data from 22 subjects (11 with HDCIS and 11 with FSP) were assessed over time. Speech perception performance was not significantly different between groups.
Discussion
Speech perception performance was not significantly different after 6-months of listening experience with the HDCIS or FSP coding strategy.
Keywords: Cochlear Implant, Signal Coding Strategy, Processing Strategy, Speech Perception
Introduction
Cochlear implant (CI) coding strategies attempt to provide the listener with the most useful electric representation of the original acoustic signal to improve the speech perception of patients with poor preoperative auditory sensitivity. The process of encoding the acoustic signal typically utilizes envelope extraction (Loizou, 2006), which has been shown to support speech perception (Shannon et al, 1995). The Continuous-Interleaved Sampling (CIS) coding strategy, which is utilized by all modern CI clinical programming software, uses non-simultaneous interleaved biphasic pulses to present envelope information to individual electrodes (Wilson et al, 1991). The CIS coding strategy has largely replaced coding strategies based on feature extraction, which explicitly present the fundamental frequency (F0) and formant frequencies, due to superior speech perception in both quiet and noise (Kiefer et al, 1996).
Though envelope-extraction supports better performance than feature-based extraction methods, CI recipients continue to experience difficulty with speech perception in noise. Normal-hearing subjects listening to vocoded speech have shown improvements in speech perception with the addition of fine structure information (Hopkins & Moore, 2009; Qin & Oxenham, 2006). CI recipients with residual low-frequency hearing in one or both ears experience an improvement in speech perception when acoustic low-frequency information is added to electric stimulation (Adunka et al, 2013; Incerti, Ching & Cowan, 2013; Dunn et al, 2010; Zhang, Dorman & Spahr, 2010; Kong, Sticknewy & Zeng, 2005; Gantz & Turner, 2004). This is presumed to result from low-frequency acoustic fine structure information in combination with the electric envelope information. Conventional CI recipients without residual hearing may experience similar speech perception outcomes if fine structure information could be effectively encoded electrically and combined with an envelope-extraction method.
The Fine Structure Processing (FSP) coding strategy developed by MED-EL attempts to provide envelope and fine structure information via electric stimulation. The FSP coding strategy uses the envelope-extraction method of CIS on the mid-to-high frequency channels while presenting fine structure cues on the low-frequency channels. The low-frequency channels carry fine structure information by presenting pulses triggered by the zero-crossings of an individual channel’s bandpass filter output, as opposed to the fixed stimulation rate used by the CIS channels (Hochmair et al, 2006). Fine structure channels start on the most apical, active electrode (electrode 1; E1). The number of fine structure channels is dependent on the pulse durations, with shorter pulse durations allowing for more fine structure channels.
Previous comparisons of the FSP coding strategy to envelope-extraction methods have shown mixed results for speech perception. These studies compared performance with either the CIS or High-Definition Continuous Interleaved Sampling (HDCIS) coding strategy, a form of CIS offered in the MED-EL clinical programming software. Some investigators reported an improvement in speech perception as measured with sentences in noise when subjects listened with the FSP coding strategy (Vermeire, Punte, & Van de Heyning, 2010; Riss et al, 2009; Arnoldner et al, 2007), while others reported no difference in speech perception performance (Müller et al, 2012; Magnusson, 2011).
Limitations of these previous investigations include differences in listening experience and differences in frequency filter settings between coding strategies. For example, conversion studies evaluated FSP in subjects with previous experience listening to either the CIS or HDCIS coding strategy (Müller et al, 2012; Magnusson, 2011; Vermeire, Punte & Van de Heyning, 2010; Riss et al, 2009; Arnoldner et al, 2007), which may influence performance and preference for the initial coding strategy. Further, previous investigations used default settings for the low-frequency filter, which are 70 or 100 Hz for FSP and 250 Hz for HDCIS (Müller et al, 2012; Vermeire, Punte & Van de Heyning, 2010; Riss et al, 2009; Arnoldner et al, 2007). Differences in the frequency-to-filter assignment may impact the performance observed for FSP and CIS strategies. The differences in speech perception reported between the FSP and HDCIS coding strategies may have resulted from the changes in the low-frequency filter instead of the representation of fine structure information.
The goal of the present study was to compare speech perception performance with HDCIS and FSP coding strategies, holding listening experience and filter frequency constant. In the present study, subjects were randomly assigned to listen with either the HDCIS or FSP coding strategy at initial activation of the external speech processor. Devices for both cohorts were programmed with the same filter-to-frequency assignment, and each subject listened exclusively to the assigned coding strategy for 6 months. This study design directly assesses potential differences in initial speech perception outcomes between the HDCIS and FSP coding strategies.
Methods
This prospective, randomized, double-blinded study was approved by the study site’s Institutional Review Board (IRB). All subjects provided consent and were compensated for their time on research-related procedures. The audiologists responsible for programming subject maps were aware of the specific coding strategy used by each subject. In contrast, both the subject and the audiologists performing the postoperative speech perception assessments were blinded to an individual subject’s coding strategy, to control for potential biases.
All subjects were 18 years of age at the time of implantation, fluent English speakers, and post-lingually deafened. They passed the Mini Mental State Examination (MMSE), agreed to participate in study procedures, and were implanted with either the MED-EL Concert standard, medium, or Flex28 electrode array (Innsbruck, Austria). Potential subjects were excluded if they were bilaterally implanted or had a history of revision cochlear implantation.
Subjects were randomized at initial activation of the external speech processor to the HDCIS or FSP coding strategy. Subjects listened exclusively to the assigned coding strategy for the first 6 months after CI activation. All subjects received the Opus 2 external speech processor. The audiologists responsible for programming conducted routine mapping procedures to optimize sound quality, including behavioral measurement of threshold and comfort levels, loudness balancing, and deactivation of electrodes when warranted. The range of frequencies represented by the implant was 100-8500 Hz for all subjects. Subjects who listened with a hearing aid in the contralateral ear discontinued use during the study period, with the rationale that listening with the CI alone would facilitate acclimation to the CI sound quality. The contralateral hearing aid was reintroduced after subjects completed the 6-month interval.
Assessment intervals included 1, 3 and 6 months post-initial activation. At each interval the subjects completed aided speech perception testing followed by mapping of the external speech processor. Recorded speech perception materials were presented at 60 dB SPL in the sound field with the subject seated 1 meter away from the speaker at 0° azimuth. Speech perception was assessed with the CI alone. Masking was provided to the contralateral ear when warranted. Speech perception measures included CNC words in quiet, HINT sentences in quiet and steady noise (+10 dB SNR), AzBio sentences in quiet and a 10-talker babble (+10 dB SNR), and BKB-SIN.
Data analysis was conducted with SPSS software (New York, USA, version 22), with a significance criterion of α=0.05. Percent correct scores were subject to rationalized arcsine transform (Studebaker, 1985) prior to analysis. The Greenhouse-Geisser correction factor was applied when Mauchly’s Test of Sphericity indicated non-sphericity. Data were analyzed using a repeated-measures analysis of covariance (rmANCOVA) to evaluate the interaction between follow-up interval (1, 3 and 6 months) and coding strategy (HDCIS and FSP), while controlling for age at implantation and duration of profound hearing loss. If coding strategy has a consistent effect on subjects’ speech perception, then we would expect a significant main effect of coding strategy in the rmANCOVA. On the other hand, if coding strategy has an effect that varies over time, then we would expect a significant interaction between follow-up interval and coding strategy in the rmANCOVA.
A power analysis was performed to better understand the magnitude of effect that could be observed with the present design. This analysis used the values of α=0.05 and β=0.2; estimates of the correlation between repeated measures were based on previous data in a similar group of patients. A value of f=0.53 was found for the between groups analysis and a value of f=0.72 was found for the interaction between coding strategy and follow-up interval. For reference, these values would be classified as “large” effects (Kotrlik & Williams, 2003).
Results
Thirty-nine (39) subjects were enrolled at initial activation of the external speech processor and randomly assigned to listen with the HDCIS (n=17) or FSP (n=22) coding strategy. Eight (8) subjects were withdrawn during the study period for the following reasons: one reported a history of perilingual deafness, one was unwilling to participate in the study protocol, one passed MMSE screener preoperatively and failed at the 6-month interval, one subject in the FSP cohort was mapped with a stimulation rate too low to support implementation of a fine structure channel, one subject in the FSP cohort failed to perform up to expectation and the programming audiologist decided to map off study protocol1, and three were lost to follow-up. Results from one HDCIS subject were excluded from analyses since this subject missed the 3-month interval. The noise condition was not routinely assessed (HINT sentences in steady noise, AzBio sentences in babble, and/or BKB-SIN) when a subject’s speech perception in the quiet condition was less than 30% correct. This practice is conducted clinically since performance in the noise condition is assumed to be zero and it limits participant frustration/fatigue. The four poorest performers from each cohort were omitted prior to analysis to limit potential bias.
Data from the remaining 22 subjects were analyzed, with 11 in the HDCIS cohort and 11 in the FSP cohort. Table 1 displays the demographic information for each subject, including duration of profound hearing loss prior to implantation, preoperative pure tone average in the ear to be implanted (PTA; 500, 1000, and 2000 Hz), preoperative aided word recognition in the ear to be implanted (CNC words), and age at implantation. The two cohorts were closely matched with respect to hearing sensitivity prior to implantation. Comparing means between the HDCIS and FSP groups, values of the PTA in the ear to be implanted were 87 and 84 dB, values of the PTA in the contralateral ear were 83 and 80 dB, and word recognition scores in the ear to be implanted were 11 and 9%. None of these differences approached significance (p≥0.691). The two groups did differ subtly with respect to demographics. The average age at implantation was 72 years for the HDCIS cohort and 65 years for the FSP cohort (t(15.57)=-1.54, p=0.145), while the average duration of hearing loss was 5 years for the HDCIS cohort and 8 years for the FSP cohort (t(19.61)=1.67, p=0.111). Age at implantation and duration of hearing loss therefore warrant consideration when evaluating speech perception outcomes.
Table 1.
Demographic information for each subject.
| Subject | Demographics | Implantation | Mapping | |||||||||
|---|---|---|---|---|---|---|---|---|---|---|---|---|
|
| ||||||||||||
| Etiology | Duration since HL onset (yr) | Duration since profound HL (yr) | PreOp Ipsi PTA (dB HL) | PreOp Contra PTA (dB HL) | Aided CNC (%) | Age at Implantation | Electrode Array | Ear | Deactivated Electrodes | Rate | # of FS channels | |
| FSP1 | NIHL | 46.4 | 11.4 | 48.3 | 48.3 | 24 | 71.4 | Flex28 | Right | None | 1463 | 2 |
| FSP2 | NIHL | 20.7 | 10.7 | 75.0 | 56.7 | 0 | 80.7 | Flex28 | Right | None | 1302 | 2 |
| FSP3 | Unknown | 15.3 | 5.3 | 76.7 | 75.0 | 1 | 68.3 | Standard | Right | None | 1705 | 2 |
| FSP4 | Unknown | 37.9 | 11.9 | 105.0 | 111.7 | 0 | 40.9 | Flex28 | Left | None | 1299 | 1 |
| FSP5 | Usher’s Syndrome | 47.0 | 11.0 | 95.0 | 98.3 | 0 | 52.0 | Standard | Left | E2, E5 | 2083 | 2 |
| FSP6 | Unknown | 27.6 | 7.6 | 96.7 | 85.0 | 0 | 70.6 | Flex28 | Left | None | 1345 | 2 |
| FSP7 | Meniere’s Disease | 5.0 | 4.0 | 65.0 | 120.0 | 40 | 51.0 | Standard | Left | E12 | 1348 | 1 |
| FSP8 | NIHL | 35.9 | 10.9 | 83.3 | 73.3 | 8 | 65.9 | Standard | Right | None | 2013 | 3 |
| FSP9 | Meniere’s Disease | 32.8 | 9.8 | 95.0 | 96.7 | 0 | 67.8 | Standard | Left | E1 | 1780 | 2 |
| FSP10 | Unknown | 11.1 | 6.1 | 120.0 | 73.3 | 0 | 46.1 | Standard | Left | None | 2510 | 3 |
| FSP11 | NIHL | 58.8 | 1.8 | 80.0 | 65.0 | 16 | 81.8 | Medium | Right | None | 1268 | 1 |
|
| ||||||||||||
| HDCIS1 | Unknown | 23.2 | 3.2 | 70.0 | 63.3 | 40 | 83.2 | Flex28 | Left | None | 1237 | NA |
| HDCIS2 | Meniere’s Disease | 38.2 | 2.2 | 100.0 | 113.3 | 0 | 78.2 | Standard | Right | None | 1152 | NA |
| HDCIS3 | NIHL | 25.6 | 10.6 | 106.7 | 68.3 | 0 | 77.6 | Standard | Right | None | 1348 | NA |
| HDCIS4 | Unknown | 40.0 | 6.0 | 91.7 | 80.0 | 0 | 65.0 | Standard | Left | None | 1474 | NA |
| HDCIS5 | Unknown | 59.8 | 10.8 | 101.7 | 105.0 | 4 | 65.8 | Standard | Left | E9, E11 | 1313 | NA |
| HDCIS6 | NIHL | 40.2 | 10.2 | 65.0 | 70.0 | 8 | 80.2 | Flex28 | Right | None | 979 | NA |
| HDCIS7 | Unknown | 4.8 | 0.8 | 65.0 | 65.0 | 24 | 60.8 | Standard | Right | None | 1395 | NA |
| HDCIS8 | Unknown | 26.0 | 6.0 | 90.0 | 85.0 | 12 | 71.0 | Standard | Left | None | 1379 | NA |
| HDCIS9 | Meniere’s Disease | 9.2 | 1.2 | 58.3 | 116.7 | 24 | 66.2 | Standard | Right | None | 1237 | NA |
| HDCIS10 | Unknown | 20.0 | 1.0 | 111.7 | 63.3 | 0 | 67.0 | Standard | Right | None | 1220 | NA |
| HDCIS11 | NIHL | 11.6 | 3.6 | 101.7 | 80.0 | 4 | 71.6 | Standard | Right | None | 1449 | NA |
Individual performance on each test measure is plotted over the study period in Figures 1–6. Diamonds represent individuals in the HDCIS cohort and circles represent individuals in the FSP cohort. Average performance over time is indicated with a solid line for the HDCIS cohort and a dashed line for the FSP cohort. Results are reported in percent correct for CNC words, HINT sentences and AzBio sentences, and in dB SNR for BKB-SIN.
Figure 1.
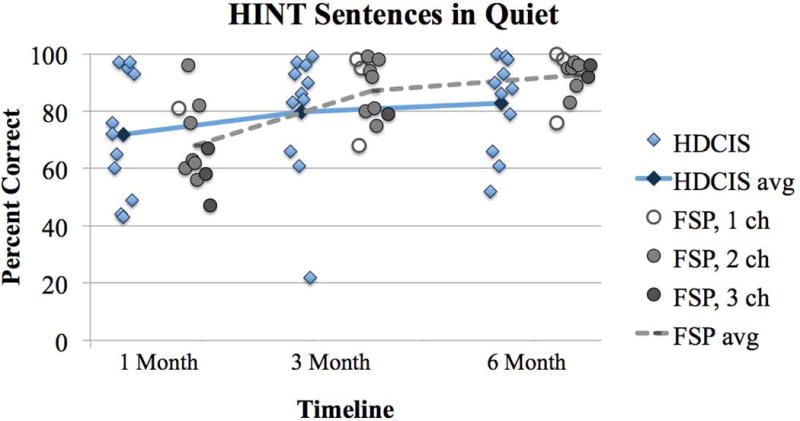
Percent correct scores for HINT sentences in quiet for subjects listening with the HDCIS or FSP coding strategy. Individual performance is designated with a diamond for the HDCIS cohort and with a circle for the FSP cohort. Average performance is tracked over time with a solid line for the HDCIS cohort and a dashed line for the FSP cohort. The number of fine structure channels for each FSP subject at each interval is designated by an open circle for 1 channel, a light grey circle for 2 channels, and a dark grey circle for 3 channels.
Figure 6.
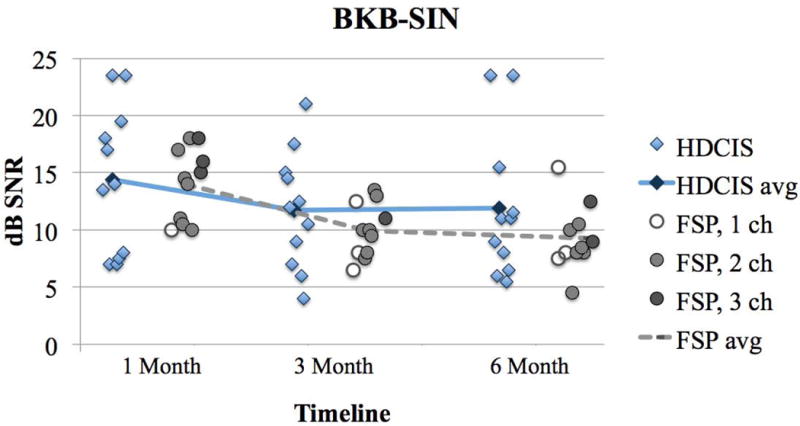
BKB-SIN scores with subjects using the HDCIS or FSP coding strategies. Results are reported as the dB SNR where the subject achieves 50% correct on sentence material, with a smaller value indicating better performance. Plotting conventions are the same as Figure 1–5.
Map parameters for each subject’s everyday map evaluated at the 6-month follow-up interval are listed in Table 1. All subjects in the FSP coding strategy cohort had at least one fine structure channel. Some subjects in the FSP coding strategy cohort experienced a change in the number of fine structure channels over the study period due to changes in pulse durations. These subjects were: FSP4 (2 channels at 1-month and 1 channel at 3- and 6-months), FSP5 (3 channels at 1-month and 2 channels at 3- and 6-months), FSP8 (2 channels at 3-months and 3 channels at 1- and 6-months), FSP9 (3 channels at 1-month and 2 channels at 3- and 6-months), and FSP11 (2 channels at 1-month and 1 channel at 3- and 6-months). The number of fine structure channels for each individual in the FSP cohort is represented with shading: open circles indicate 1 FSP channel, light grey circles indicate FSP 2 channels, and dark grey circles indicate 3 FSP channels in Figures 1–6.
There was a main effect of follow-up interval (1, 3 and 6 months) for HINT sentences in quiet (F(2,36)=3.37, p=0.046; Figure 1). This demonstrates that speech perception improved over time on this test measure. There was no main effect of follow-up interval for CNC words in quiet (F(2,36)=0.11, p=0.897; Figure 2), HINT sentences in steady noise (F(2,36)=3.03, p=0.061; Figure 3), AzBio sentences in quiet (F(2,36)=2.24, p=0.121; Figure 4) and in babble (F(2,36)=0.76, p=0.474; Figure 5) and BKB-SIN (F(2,36)=0.23, p=0.796; Figure 6). This demonstrates stability in speech perception during the study period on these test measures. There was no main effect of coding strategy (HDCIS versus FSP) for any of the six speech measures: CNC words in quiet (F(1,18)=0.04, p=0.841), HINT sentences in quiet (F(1,18)=1.05, p=0.319) or in steady noise (F(1,18)=1.89, p=0.186), AzBio sentences in quiet (F(1,18)=0.45, p=0.510) or in babble (F(1,18)=0.20, p=0.661), and BKB-SIN (F(1,18)=1.40, p=0.253). This is indicative of a non-significant difference in speech perception when listening exclusively with the HDCIS versus FSP coding strategy. Recall that all these analyses controlled for age at implantation and duration of hearing loss.
Figure 2.
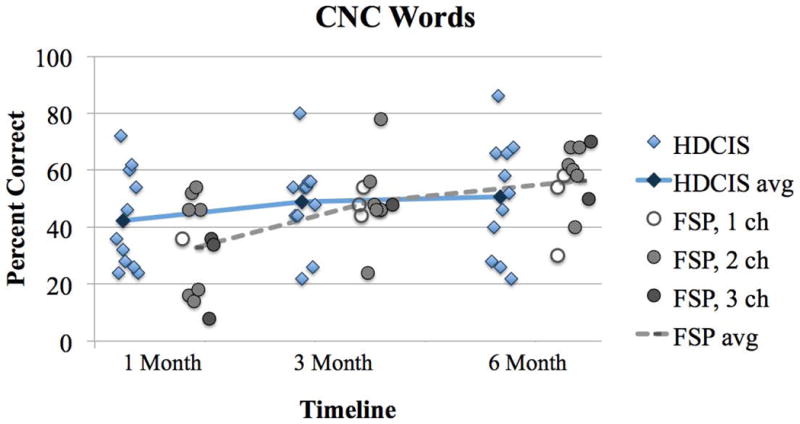
Percent correct scores for CNC words in quiet. Plotting conventions follow the same as Figure 1.
Figure 3.
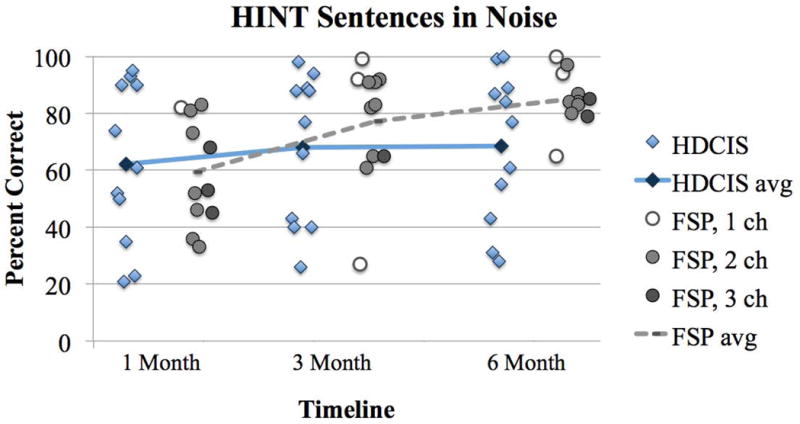
Percent correct scores for HINT sentences in steady noise (10 dB SNR). Plotting conventions are the same as Figures 1–2.
Figure 4.
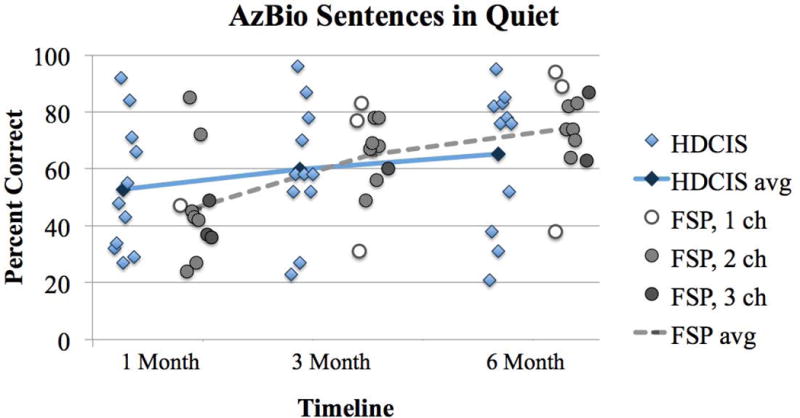
Percent correct scores for AzBio sentences in quiet. Plotting conventions are the same as Figure 1–3.
Figure 5.
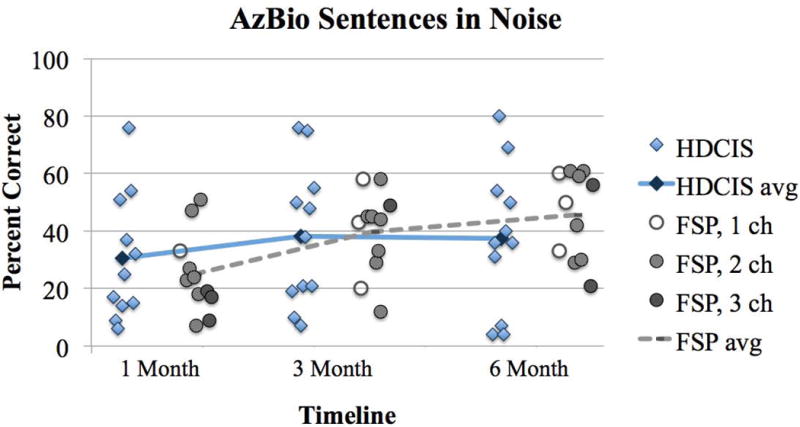
Percent correct for AzBio sentences in babble (10 dB SNR). Plotting conventions are the same as Figures 1–4.
There was no interaction between coding strategy (HDCIS versus FSP) and follow-up interval (1, 3 and 6 months) for CNC words in quiet (F(2,36)=1.27, p=0.293), HINT sentences in quiet (F(2,36)=1.05, p=0.361) and in steady noise (F(2,36)=1.80, p=0.179), AzBio sentences in quiet (F(2,36)=1.72, p=0.193) and in babble (F(2,36)=1.85, p=0.173), and BKB-SIN (F(2,36)=0.06, p=0.940). This demonstrates speech perception outcomes over time were not significantly different when listening with the HDCIS or FSP coding strategy.
Discussion
The present study examined potential speech perception differences between an envelope-based coding strategy (HDCIS) and an enveloped-based strategy with fine structure cues included (FSP) from activation to the 6-month interval. No difference between coding strategies was observed for speech perception assessed in quiet or in the presence of a masker.
One of the differences between the present study and previous investigations of speech perception with the CIS/HDCIS versus FSP coding strategy is that the range of frequencies represented by the implant were the same for the two cohorts. This feature of the experimental design was intended to support assessment of speech perception differences related to the presence of fine structure channels as opposed to differences in the low-frequency filter assignment. Similarly, Riss et al (2011) evaluated the effect of low-frequency filter assignment on speech perception in a group of CI users with at least one year of listening experience with the FSP coding strategy. The low-frequency filter was maintained at 70 Hz for the FSP coding strategy map and the comparison HDCIS coding strategy map. They reported no significant difference on speech perception measures between the two coding strategies. Maintaining frequency filter assignments between coding strategies comparisons may be important to accurately assess performance differences based on the specific coding strategy.
One parameter not controlled in the present study was the electrode array. In the HDCIS cohort, 2 subjects were implanted with the Flex28 device and 9 with the Standard device. In the FSP cohort, 4 subjects were implanted with the Flex28 device, 1 with the Medium device, and 6 with the Standard device. Buchman et al (2014) reported differences in speech perception within the first 12 months of listening experience in subjects implanted with the Medium versus the Standard electrode array. Differences in the electrode array used for individual subjects may have introduced some variability in the speech perception results observed in the present report. If analysis is limited to those subjects implanted with the Standard device, there was a significant interaction between follow-up interval and coding strategy for CNC words (F(1.38,15.13)=5.12, p=0.030), HINT sentences in quiet (F(2,22)=3.78, p=0.039), and AzBio sentences in quiet (F(2,22)=4.95, p=0.017). These results appear to be driven by better speech perception with the HDCIS coding strategy at the 1-month interval and better speech perception with the FSP coding strategy at the 6-month interval. Considering this, insertion depth cannot be ruled out as a potential influence on initial speech perception outcomes.
A map feature not controlled in the present study was the number of fine structure channels in the FSP coding strategy cohort. The number of fine structure channels is dependent on the stimulation rate, which is influenced by changes in pulse width and number of active electrodes. It may be that subjects with larger numbers of fine structure channels perform better, due to more fine structure information being available to the listener. The majority of the subjects in this study had two fine structure channels, with some experiencing a change in the number of fine structure channels over the study period. Roy et al (2015) reported similar performance between one and two fine structure channel maps on measures of music rating. In newer generations of the FSP coding strategy, such as the FS4 and FS4-p coding strategies, four fine structure channels are regularly available. A review of subjects listening consistently to four fine structure channels may reveal whether the number of active fine structure channels in related to changes in speech perception. Riss et al (2014) conducted a crossover study with the FSP, FS4 and FS4-p coding strategies for subjects with previous listening experience with the FSP coding strategy. The number of available fine structure channels varied between and within subjects. They reported no difference on speech perception in noise between the three coding strategies, though noted variability in which coding strategy resulted in the best performance. They recommended CI recipients compare coding strategies to determine which offers the best performance.
A potential limitation of the current analysis is the duration of CI listening experience by the study endpoint (6-months post-activation). Six-months post-initial activation was selected as the study endpoint as it has been shown to be an interval where a plateau in speech perception abilities occurs with various signal coding strategies (Lenarz et al, 2012). Some have suggested that longer listening experience is needed with the FSP coding strategy before differences in speech perception emerge. Vermeire, Punte and Van de Heyning (2010) reported on the performance of experienced CI listeners who were upgraded to the Opus 2 speech processor and were fit with either the HDCIS or FSP coding strategy. After 12 months of listening experience, the FSP coding strategy group showed a significant improvement in speech perception in noise while the HDCIS group showed no difference. In a follow-up study, Kleine Punte, De Bodt and Van de Heyning (2014) reported an improvement in the FSP coding strategy group after 24 months of listening experience, while the HDCIS coding strategy group did not show a significant difference. It is possible that extended listening experience, beyond the 6-month interval evaluated here, may be needed to benefit from electrically represented fine structure information.
Another consideration in evaluating the present results is the relatively low power of the present study design. Although results from 22 subjects represents a relatively large dataset in the context of prospective CI studies, the marked variability in outcomes across individuals within each group limits the ability to detect differences in performance that could be meaningful for individual subjects.
Conclusions
Speech perception performance was not significantly different after 6-months of exclusive listening with either the HDCIS or FSP coding strategy. Studies comparing coding strategies should control variables, such as frequency filter assignments and insertion depth, to evaluate the effect of the coding strategy.
Footnotes
The subject who was withdrawn from the study due to poor performance had a CNC word score of 4% at the 3-month follow-up interval. This prompted the clinician to consider mapping parameters outside the protocol of the study. It was later discovered that this subject was non-compliant with listening experience recommendations, so it is possible that poor performance in this case was due to limited CI use rather than suboptimal mapping parameters.
References
- Adunka OF, Dillon MT, Adunka MC, King ER, Pillsbury HC, Buchman CA. Hearing preservation and speech perception outcomes with electric-acoustic stimulation after 12 months of listening experience. Laryngoscope. 2013;123(10):2509–2515. doi: 10.1002/lary.23741. [DOI] [PubMed] [Google Scholar]
- Arnoldner C, Riss D, Brunner M, Durisin M, Baumgartner WD, Hamzavi JS. Speech and music perception with the new fine structure speech coding strategy: preliminary results. Acta Otolaryngol. 2007;127(12):1298–1303. doi: 10.1080/00016480701275261. [DOI] [PubMed] [Google Scholar]
- Buchman CA, Dillon MT, King ER, Adunka MC, Adunka OF, Pillsbury HC. Influence of cochlear implant insertion depth on performance: a prospective randomized trial. Otol Neurotol. 2014;35(10):1773–9. doi: 10.1097/MAO.0000000000000541. [DOI] [PubMed] [Google Scholar]
- Dunn CC, Perreau A, Gantz B, Tyler RS. Benefits of localization and speech perception with multiple noise sources in listeners with a short-electrode cochlear implant. Journal of the American Academy of Audiology. 2010;21(1):44–51. doi: 10.3766/jaaa.21.1.6. [DOI] [PMC free article] [PubMed] [Google Scholar]
- Gantz BJ, Turner C. Combining acoustic and electrical speech processing: Iowa/Nucleus hybrid implant. Acta Oto-laryngologica. 2004;124(4):344–347. doi: 10.1080/00016480410016423. [DOI] [PubMed] [Google Scholar]
- Hochmair I, Nopp P, Jolly C, Schmidt M, Schösser H, Garnham C, Anderson I. MED-EL Cochlear implants: state of the art and a glimpse into the future. Trends Amplif. 2006;10(4):201–219. doi: 10.1177/1084713806296720. [DOI] [PMC free article] [PubMed] [Google Scholar]
- Hopkins K, Moore BC. The contribution of temporal fine structure to the intelligibility of speech in steady and modulated noise. J Acoust Soc Am. 2009;125(1):442–446. doi: 10.1121/1.3037233. [DOI] [PubMed] [Google Scholar]
- Incerti PV, Ching TY, Cowan R. A systematic review of electric-acoustic stimulation: device fitting ranges, outcomes, and clinical fitting practices. Trends in Amplification. 2013;17(1):3–26. doi: 10.1177/1084713813480857. [DOI] [PMC free article] [PubMed] [Google Scholar]
- Kiefer J, Muller J, Pfennigdorff T, et al. Speech understanding in quiet and in noise with the CIS speech coding strategy (MED-EL Combi-40) compared to the multipeak and spectral peak strategies (nucleus) ORL J Otorhinolaryngol Relat Spec. 1996;58(3):127–135. doi: 10.1159/000276812. [DOI] [PubMed] [Google Scholar]
- Kleine Punte A, De Bodt M, Van de Heyning P. Long-term improvement of speech perception with the fine structure processing coding strategy in cochlear implants. ORL J Otorhinolaryngol Relat Spec. 2014;76(1):36–43. doi: 10.1159/000360479. [DOI] [PubMed] [Google Scholar]
- Kong YY, Sticknewy GS, Zeng FG. Speech and melody recognition in binaurally combined acoustic and electric hearing. Journal of the Acoustical Society of America. 2005;117(3 Pt 1):1351–1361. doi: 10.1121/1.1857526. [DOI] [PubMed] [Google Scholar]
- Kotrlik J, Williams H. The incorporation of effect size in information technology, learning, and performance research. Information Technology, Learning and Performance Journal. 2003;21(1):1–7. [Google Scholar]
- Lenarz M, Sönmez H, Joseph G, Büchner A, Lenarz T. Long-term performance of cochlear implants in postlingually deafened adults. Otolaryngol Head Neck Surg. 2012;147(1):112–118. doi: 10.1177/0194599812438041. [DOI] [PubMed] [Google Scholar]
- Loizou PC. Speech processing in vocoder-centric cochlear implant. Adv Otorhinolaryngol. 2006;64:109–43. doi: 10.1159/000094648. [DOI] [PubMed] [Google Scholar]
- Magnusson L. Comparison of the fine structure processing (FSP) strategy and the CIS strategy used in the MED-EL cochlear implant system: speech intelligibility and music sound quality. Int J Audiol. 2011;50(4):279–287. doi: 10.3109/14992027.2010.537378. [DOI] [PubMed] [Google Scholar]
- Müller J, Brill S, Hagen R, Moeltner A, Brockmeier SJ, Stark T, Helbig J, Zahnert T, Zierhofer C, Nopp P, Anderson I. Clinical trial results with the MED-EL fine structure processing coding strategy in experienced cochlear implant users. ORL J Otorhinolaryngol Relat Spec. 2012;74(4):185–198. doi: 10.1159/000337089. [DOI] [PubMed] [Google Scholar]
- Oxenham AJ. Revisiting place and temporal theories of pitch. Acoust Sci Technol. 2013;34(6):388–396. doi: 10.1250/ast.34.388. [DOI] [PMC free article] [PubMed] [Google Scholar]
- Prentiss SM, Friedland DR, Nash JJ, Runge CL. Differences in perception of musical stimuli among acoustic, electric, and combined modality listeners. JAAA. 2015;26(5):494–501. doi: 10.3766/jaaa.14098. [DOI] [PubMed] [Google Scholar]
- Qin MK, Oxenham AJ. Effects of introducing unprocessed low-frequency information on the reception of envelope-vocoder processed speech. Journal of the Acoustical Society of America. 2006;119(4):2417–2426. doi: 10.1121/1.2178719. [DOI] [PubMed] [Google Scholar]
- Riss D, Arnoldner C, Reiss S, Baumgartner WD, Hamzavi JS. 1-year results using the Opus speech processor with the fine structure speech coding strategy. Acta Otolaryngol. 2009;129(9):988–991. doi: 10.1080/00016480802552485. [DOI] [PubMed] [Google Scholar]
- Riss D, Hamzavi JS, Blindeder M, Honeder C, Ehrenreich I, Kaider A, Baumgartner WD, Gstoettner W, Arnoldner C. FS4-FS4-p, and FSP: a 4-month crossover study of 3 fine structure sound-coding strategies. Ear Hear. 2014;35(6):e272–281. doi: 10.1097/AUD.0000000000000063. [DOI] [PubMed] [Google Scholar]
- Riss D, Hamzavi JS, Selberherr A, Kaider A, Blineder M, Starlinger V, Gstoettner W, Arnoldner C. Envelope versus fine structure speech coding strategy: a crossover study. Otol Neurotol. 2011;32(7):1094–1101. doi: 10.1097/MAO.0b013e31822a97f4. [DOI] [PubMed] [Google Scholar]
- Roy AT, Carver C, Jiradejvong P, Limb CJ. Musical sound quality in cochlear implant users: a comparison in bass frequency perception between fine structure processing and high-definition continuous interleaved sampling strategies. Ear Hear. 2015;36(5):582–590. doi: 10.1097/AUD.0000000000000170. [DOI] [PubMed] [Google Scholar]
- Shannon RV, Zeng FG, Kamath V, Wygonski J, Ekelid M. Speech recognition with primarily temporal cues. Science. 1995;270(5234):303–304. doi: 10.1126/science.270.5234.303. [DOI] [PubMed] [Google Scholar]
- Studebaker GA. A “rationalized” arcsine transform. Journal of Speech and Hearing Research. 1985;28(3):455–462. doi: 10.1044/jshr.2803.455. [DOI] [PubMed] [Google Scholar]
- Vermeire K, Punte AK, Van de Heyning P. Better speech recognition in noise with the fine structure processing coding strategy. ORL J Otorhinolaryngol Relat Spec. 2010;72(6):305–311. doi: 10.1159/000319748. [DOI] [PubMed] [Google Scholar]
- Wilson BS, Finley CC, Lawson DT, Wolford RD, Eddington DK, Rabinowitz WM. Better speech recognition with cochlear implants. Nature. 1991;352(6332):236–238. doi: 10.1038/352236a0. [DOI] [PubMed] [Google Scholar]
- Zhang T, Dorman MF, Spahr AJ. Information from the voice fundamental frequency (F0) region accounts for the majority of the benefit when acoustic stimulation is added to electric stimulation. Ear and Hearing. 2010;31(1):63–69. doi: 10.1097/aud.0b013e3181b7190c. [DOI] [PMC free article] [PubMed] [Google Scholar]


