Abstract
SIGNIFICANCE
Glaucomatous nasal visual field abnormalities correspond to damage in the temporal raphe—where individual nerve bundles can be visualized. The ability to quantify structural abnormality in the raphe, with a clinically applicable protocol, sets the stage for investigating the raphe as a potential site for assessing early glaucoma.
PURPOSE
To develop a clinically applicable imaging and analysis technique for identifying retinal nerve fiber bundle abnormalities in the temporal raphe.
METHODS
Spectralis optical coherence tomography scans customized for the temporal raphe were gathered from 30 younger controls, 30 older controls, and 29 patients with glaucoma. An analysis technique was developed based on the reflectance of the nerve fiber bundles. The technique was first developed in the younger controls, and then applied to the older controls to generate normative data for quantifying nerve fiber bundle reflectance abnormalities in the patients with glaucoma. Matrix perimetric data were gathered in the patients with glaucoma to evaluate the reflectance technique’s findings. Reflectance abnormality in the patients was defined when the fraction of enface area showing reflectance abnormality was greater than the 95th percentile estimated from controls. Spearman’s rho was used to quantify the relation between the total deviation at the perimetric testing locations and the fraction of corresponding enface area showing reflectance abnormality.
RESULTS
Twenty-five of the 29 patients had reflectance abnormalities. Eight of these had mild to no perimetric mean deviation abnormality. Similar results were found when perimetric total deviations were compared to reflectance abnormalities in the corresponding enface locations. Spearman’s rho comparing the total deviations to reflectance abnormalities found rs(174) = −0.72, P < .001.
CONCLUSIONS
The technique typically identified reflectance abnormality when perimetric abnormality was present. It also identified reflectance abnormalities even when perimetric abnormality was mild or absent. The findings support the potential of raphe imaging in detecting early glaucomatous damage.
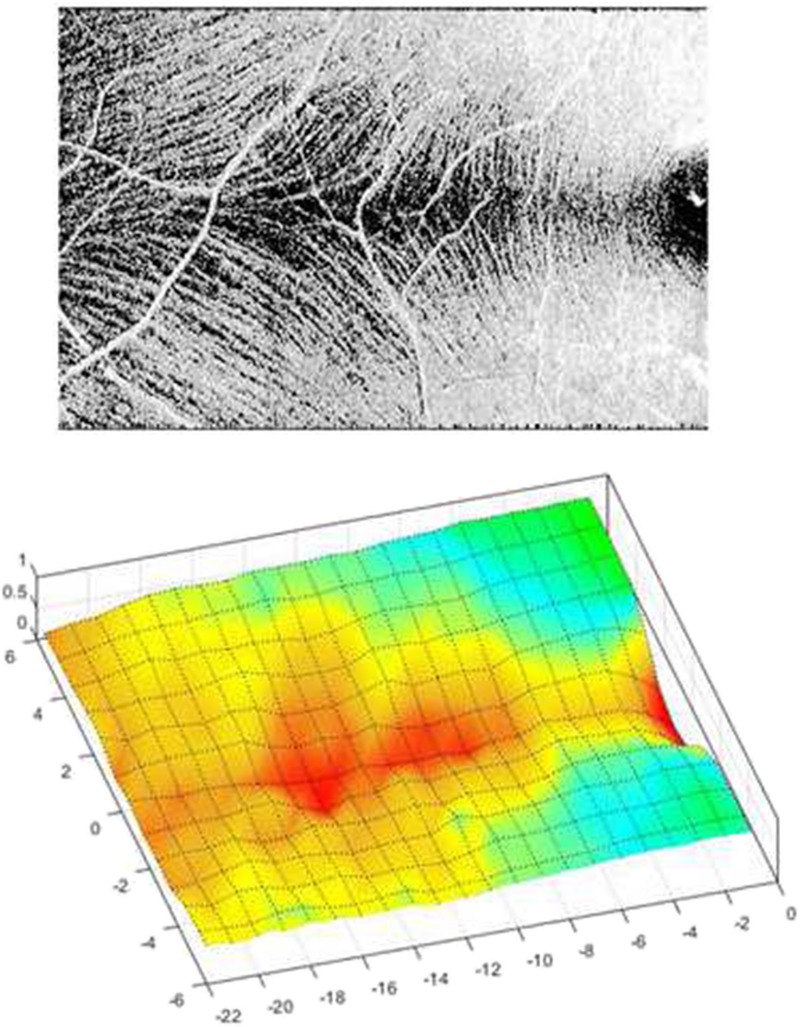
Visual field abnormalities in the nasal visual field correspond to abnormalities in the region of the retinal temporal raphe. The anatomical conformation of the retinal nerve fiber bundles in the temporal raphe explains the characteristic glaucomatous nasal visual field pattern in which the disease appears to respect the horizontal meridian and justifies the use of the glaucoma hemifield test (GHT) index as an indicator of glaucomatous degeneration.1–6 An understanding of the structure of the retinal temporal raphe therefore has the potential to enhance our understanding of the glaucomatous disease process and help refine current strategies for investigating the disease.
The raphe offers the unique opportunity to visualize the individual nerve fiber bundles. Additionally, almost all the axons forming the nerve fiber bundles in the raphe are contributed by the ganglion cells in the region, and it may be possible to predict the location of the ganglion cells whose axons are contributing to the nerve fiber bundles. These properties of the nerve fiber bundles in the raphe make the region a probable location where early changes in the nerve fiber layer can be readily recognized. A recent study by Huang et al. using an adaptive scanning laser ophthalmoscope (a laboratory-based equipment) to image the raphe showed that structural nerve fiber bundle abnormalities in the region could be detected even when perimetric abnormalities were only mild.4
Until recently, imaging the nerve fiber bundles in the raphe region using a clinical device has been challenging.5 Advances in clinical optical coherence tomography (OCT) imaging now make it possible to image the nerve fiber bundles in the raphe region by using the reflective properties of the nerve fiber bundles relative to the surrounding foot processes of the Muller cells.3–5,7,8 The reflectance of the nerve fiber layer has substantial contributions from the organization of the microtubules within the axons of individual bundles, and thus contains information about the integrity of the axons as well as the density of the nerve fiber bundles.9 Axonal degenerative disease processes that disrupt the cytoarchitecture of the microtubules or alter the density of nerve bundles therefore alter the reflectivity of the nerve fiber layer.10
In this study, we developed an imaging and analysis protocol for analyzing retinal nerve fiber bundle reflectance abnormalities in the region of the temporal raphe, using a clinically available testing device. Given the unique conformation of the temporal raphe, the ability to image and quantify structural abnormalities in the region using a clinically applicable protocol opens the possibility for evaluating the temporal raphe as a site for assessing glaucomatous abnormalities.
METHODS
The experiment was performed in three stages. Stage one: we developed and tested the imaging protocol and analysis technique for investigating the retinal temporal raphe in a group of younger controls. Stage two: we applied the protocol to a group of older controls to generate normative reference values for identifying regions of reflectance abnormality in patients with glaucoma. Stage three: we applied the protocol to a group of patients with glaucoma to identify regions of nerve fiber bundle reflectance abnormalities. We assessed the performance of the imaging and analysis protocol by comparing the reflectance findings to the results from perimetric testing in the patients with glaucoma. The reason for the three stages of the experiment was because the imaging and analysis protocol was novel and there were several analysis choices to be made. We developed the technique in the younger control group before applying it to the older control and patients with glaucoma group (whose data were ultimately used to evaluate the performance of the technique). In this way, we hope to have mitigated the potential of making analysis choices that were specific to our older control and patient cohorts, so that the findings of our study are likely to be reproducible in other cohorts.
Subjects
The younger control group (aged 22–30 years) was recruited from the students at Indiana University (IU) School of Optometry. The older control group (aged 49–75 years) and the patients with glaucoma group (ages 53–81 years) were recruited from subjects who visited the IU Bloomington optometry clinic for eye care services, and participated in previous research projects by our laboratory.
Inclusion and Exclusion Criteria
Inclusion criteria were best-corrected visual acuity of at least 20/40, refractive corrections between +3 and −6 D spherical equivalent and cylindrical correction within ±3.0 D, and clear ocular media. Control subjects had normal results from a comprehensive eye examination (not more than 2 years before the study) that included clinical evaluation of the disc and retinal nerve fiber layer (RNFL). Patients with glaucoma had normal retinal findings with the exception of disc, RNFL, and perimetric abnormalities associated with glaucoma. Perimetric results (from the Humphrey Field Analyzer) were considered as showing glaucomatous abnormality when the total deviation or pattern deviation showed reproducible defects at two or more contiguous points with P < .01, or three or more contiguous points with P < .05, in the presence of clinical glaucomatous optic neuropathy. The exclusion criteria were ocular or systemic disease other than glaucoma currently affecting visual function, and epiretinal membranes. Further details on the inclusion and exclusion criteria can be found elsewhere.11
Study Protocol
Written informed consent was obtained after explaining the nature and purpose of the study to the participant. The subject’s visual acuity and contrast sensitivity were checked, perimetric data were gathered, and then Spectralis OCT volumetric images were acquired. The study followed the tenets of the Declaration of Helsinki and was approved by the Indiana University Institutional Review Board.
OCT Imaging Protocol
Retinal images were acquired using the Spectralis OCT (Heidelberg Engineering GmbH, Heidelberg, Germany, software versions 5.7.5 and 6.4.7). Two images were acquired per eye in high-speed mode (with 11-μm spacing between A-scans). The first image (termed “preliminary image”) was a 20° by 25° horizontal rectangular box with 30 μm spacing between B-scans (Fig. 1A). The second image termed “refined image” was a 15° by 23° rectangular box with 11 μm spacing between B-scans (Fig. 1B). In the refined images, the rectangular box was customized for each individual based on the observed angle of the raphe estimated from the preliminary image (Fig. 1). This was to mitigate the impact of the between-subject variability of the angle of raphe on the analysis technique (Fig. 2). The raphe angle was defined as the angle between a horizontal line through the foveal reflex and a straight line from the foveal reflex to the point where the fibers in the triangular region2,3 of the temporal raphe first appear to meet (Fig. 2). In patients with glaucoma in whom the fibers in the triangular region of the raphe were not visible, the OCT box was rotated 2° upwards (the average raphe angle reported in the literature3) with reference to a horizontal dividing line through the fovea. One trained ophthalmic technician acquired all the images.
FIGURE 1.
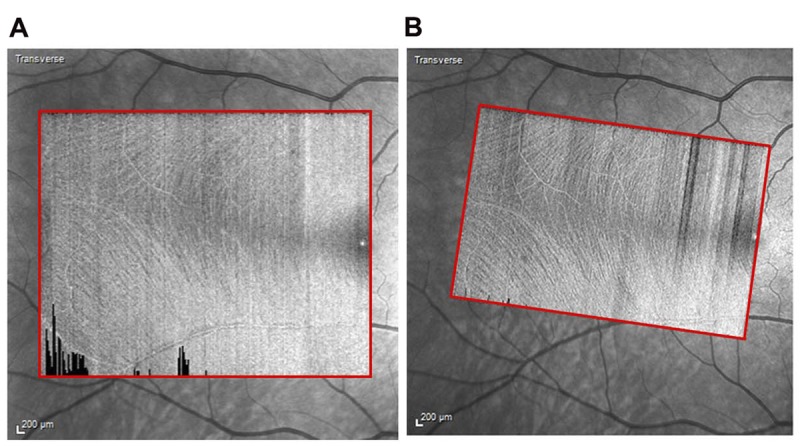
Imaging protocol. (A) “preliminary image” acquired to determine the angle of the temporal raphe. (B) “refined image” customized based on the angle of the raphe.
FIGURE 2.
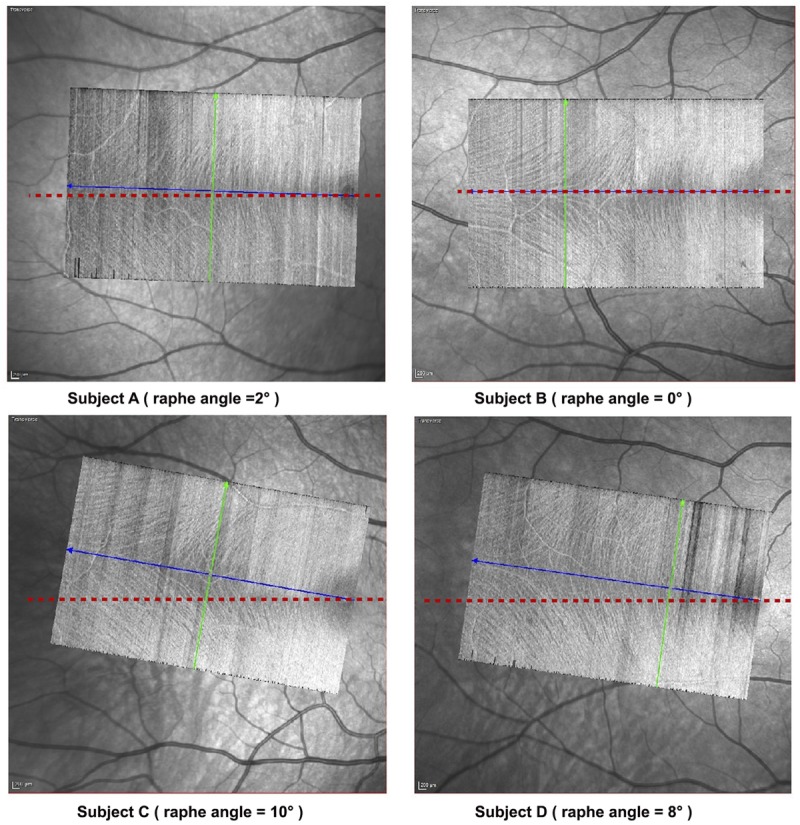
Between-subject variability in the angle of the raphe. The imaging protocol mitigates the impact of the between subject variability in the angle of raphe by adjusting the OCT box to align with the angle of the raphe. The blue line approximates a straight line between the foveal reflex and the point in the triangular region of the raphe where the fibers appear to first meet. The green line is the direction of the B-scan (orthogonal to the blue line). The raphe angle was identified as the angle between the blue line and a horizontal line (shown in red) through the foveal reflex.
Depending on the speed of image acquisition, one or both eyes were imaged in the controls. When only one eye was imaged, it was automatically selected for further analyses. However, when images from both eyes were acquired, the images from the left and right eyes were selected in an alternating manner for further analysis. In the patients with glaucoma, only the eye studied by our laboratory in previous studies was imaged and analyzed. In the absence of any comorbid factors, our laboratory selects the eye with the worse glaucomatous defect as the study eye.
Extracting OCT Enface Images
Eight-micron-thick enface images were extracted from the OCT volume scans. The enface images were sampled axially from 14 to 22 μm below the inner limiting membrane. From a preliminary survey, we determined that sampling at this depth yielded enface images that allowed adequate visualization of the nerve fiber bundle reflectance with minimal interruption from putative glial alteration reflections.12 On the enface images from two older controls and two patients with glaucoma, however, there were still appreciable amounts of putative glial alteration reflectances (obscuring the nerve fiber bundle reflectance) even at the 14–22 μm depth at which the enface images were sampled. These four subjects were excluded from the study.
The enface images were processed to compensate for variations in amount of light reaching the retina, such as low-signal B-scans appearing as dark stripes or shadows from floaters, using an attenuation coefficient technique proposed elsewhere.13,14 In brief, the technique assumes that light attenuation is due to light scattering rather than absorption, and that the amount of light reflected back to the detector is proportional to the amount of light scattered. Hence, the attenuation coefficient at a given depth in the retina is assumed to be proportional to the reflectance at that depth.
Quantifying the Retinal Nerve Fiber Bundle Reflectance
A thresholding technique was used to separate the probable nerve fiber bundles from the non-fiber component (Fig. 3). The approach used in this analysis transforms the pixel values to zero in regions of the image where the pixel values are lower than the threshold but maintains pixel values greater than the threshold.
FIGURE 3.

Image analysis. (A) 8-μm-thick enface slab image extracted from the OCT volume scan. (B) Enface slab image after processing to mitigate the impact of reflectance artifacts.
In each image, the value used for the thresholding was computed as the average pixel brightness value below the retinal nerve fiber layer in a zone (250 by 150 pixels) approximating the triangular region2,3 of the raphe, at 36 μm depth from the inner limiting membrane. The size of this region was large enough that the mean pixel brightness computed from the region was not artifactually high due to the contribution of highly reflective blood vessels but still small enough to approximate the triangular region of the raphe.
A grid of 1° by 1° boxes was superimposed on the threshold images. For any given image, the grid began at the foveal reflex (delineated by BSA across all subjects) and the 1° by 1° grid boxes were added vertically and horizontally until the boundary of the image was reached. Approximately 14 by 22 grid boxes covered the retinal region imaged in each subject. The pixel values within each box were averaged and scaled to a fraction index by dividing the average by the highest pixel value possible—255 in our case. The 1° by 1° grid boxes were small enough to detect wedge-shaped reflectance abnormalities and big enough not to be notably impacted by small caliber vasculature.
A lower normative reflectance reference value for each grid box (representing a specific retinal location) was computed at the 5th percentile from the reflectance findings obtained from the older controls. Nerve fiber bundle reflectance abnormalities were identified in the patients with glaucoma when the reflectance at a region on the enface image was below the lower normative reference value.
Perimetric Testing
To assess the performance of the imaging and analysis protocol, we compared the nerve fiber bundle reflectance findings in the patients with glaucoma to perimetric sensitivity findings. Humphrey Matrix (Model 800; Carl Zeiss Meditec, Inc.) perimetric testing was performed in the patients with glaucoma using the 24-2 testing protocol, with a 5° by 5° square sinusoidal grating.
We chose the Matrix stimulus over the Goldmann size III (G-III) stimulus because its size and shape allowed a more compatible comparison with the analysis approach adapted for the reflectance technique. For instance, due to the potential effects of microsaccades and cyclorotation during testing, there is likely a greater spatial correspondence in matching the 25 deg2 area tested by the Matrix stimulus to a 25 deg2 area on the enface image than matching a 0.15 deg2 area tested by the G-III stimulus to 0.15 deg2 area on the enface images. Furthermore, the square-shaped nature of the Matrix stimulus improved our ability to spatially match the reflectance findings with the perimetric findings, given that the sampling of our structural analysis was 1° by 1° square grid boxes.
Visual field testing results were regarded as reliable when false-positive, false-negative, and fixation errors were less than 20%, 16%, and 20%, respectively.15
Analysis
We initially assessed the impact of aging on the reflectance of the nerve fiber bundles. Because each subject’s enface image was covered by approximately 14 by 22 grid boxes (with each grid box representing the reflectance at a particular retinal location), we summarized the control groups’ data by computing the median reflectance at each grid-box location across the subjects in the control group under consideration. We also computed the variance in similar manner.
We assessed the effect of aging using two analyses. In one analysis, we used a t-statistic to compare the median reflectances in the younger and older controls. In addition, at each grid-box location, we computed the difference between the median reflectance findings for the younger and older controls. In step two, we used a t-statistic to compare the mean of variance findings in the younger controls to the older controls. We hypothesized that if aging substantially affects the nerve fiber bundle reflectance, then the mean of the variances in the younger controls should be smaller than that of the older controls given the more homogenous age range of the younger controls. We also computed the difference (at each grid-box location) between the variance of reflectance findings for the younger and older controls.
We assessed the performance of the reflectance technique by comparing its findings to the findings from perimetric testing in the patients with glaucoma. In a first analysis, we compared the total deviation (TD) at the perimetric testing locations to the fraction of corresponding enface locations showing reflectance abnormality. The retinal region tested by the imaging and analysis protocol approximately corresponded to six perimetric testing locations on the 24-2 perimetric protocol. In a second analysis, we compared the mean deviation (MD) of perimetric testing to the fraction of the entire enface image showing reflectance abnormality (at P < .05). The strengths of the relations were quantified using Spearman’s rho.
RESULTS
The signal strengths of OCT enface images analyzed were similar for all three groups (Table 1). Contour plots for the reflectance findings of the younger and older controls groups were similar (Fig. 4), and a t-statistic comparing the median reflectance findings for the two groups found slightly lower values (Fig. 5A) for the older group t(614) = −1.72, P = 0.04, Cohen’s d = 0.14. The plot in Fig. 5B shows the difference between the variance of the reflectance findings for the younger controls and the older controls. The median of the difference was zero and a t-statistic comparing the variances between the two groups found the variances to be similar—t(614) = 0.30, P = 0.38.
TABLE 1.
Age, Matrix perimetric mean deviation, and signal strengths of the OCT volume scans from which the enface images were extracted

FIGURE 4.

Contour plots of the median retinal nerve fiber bundle reflectance profiles for the temporal raphe for the younger and older controls. The numbers labeling the contours represent the median reflectance findings for the controls. The closer the color scale of the contour is to 1.0, the more reflective the region. Coordinate (0, 0) on the plot approximates the fovea.
FIGURE 5.
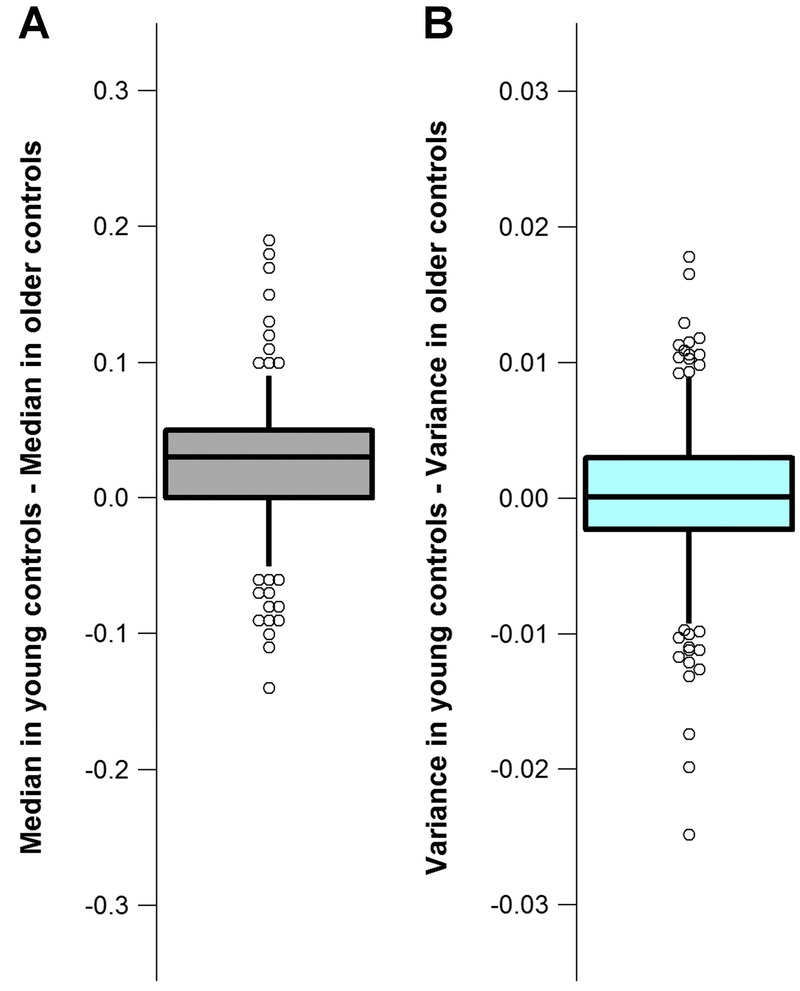
Reflectance findings in the younger controls compared to the reflectance findings in the older controls. The boxes show the 25th and 75th percentiles and the whiskers show the 5th and 95th percentiles. The circles show the upper and lower tails of the plots. The circles were displaced in the horizontal plane when they overlapped. (A) Difference in the median reflectance findings between the younger controls and the older controls at each grid-box location. (B) Difference between the variances of the reflectance findings for the younger controls and older controls at each grid box location.
An example of the reflectance findings in a patient with glaucoma that had good agreement with the perimetric finding is shown in Fig. 6. Fig. 7 shows the relation between the perimetric total deviation at the individual perimetric locations and the fraction of the corresponding enface area, which showed reflectance abnormality, for the patients with glaucoma. Spearman’s rho found a strong relation between the two findings—rs(174) = −0.72, P < .001. Fig. 8 shows agreement between the perimetric mean deviation and the fraction of the entire enface area studied showing reflectance abnormality. A Spearman’s rho found a strong relation between the two measures rs(29) = −0.71, P < .001.
FIGURE 6.
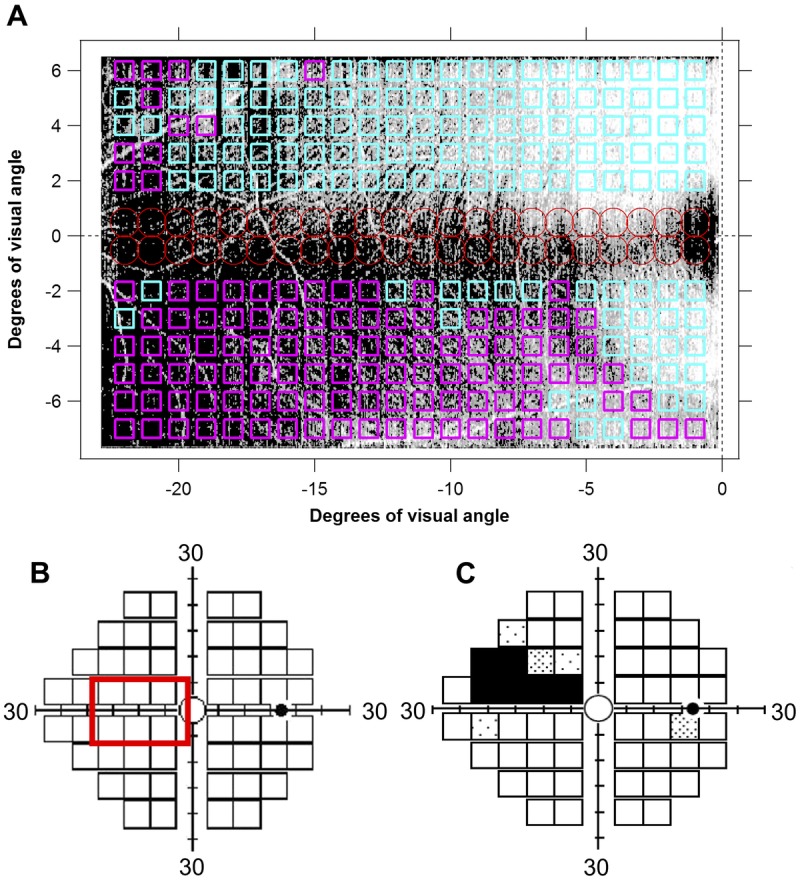
Findings of the reflectance technique and Matrix perimetric 24-2 testing, in a patient with glaucoma. (A) Retinal nerve fiber bundle (RNFB) reflectance findings superimposed on an enface image of the temporal raphe. Regions of RNFB reflectance anomalies (P < .05) are shown in magenta and regions within the normative reference range are shown in cyan. The red circles show regions on the enface image where the predictions of reflectance technique are not reliable due to high between-subject variability. (B) Enface image area superimposed on the 24-2 standard grid of perimetric testing. (C) Total deviation plot from perimetric testing.
FIGURE 7.
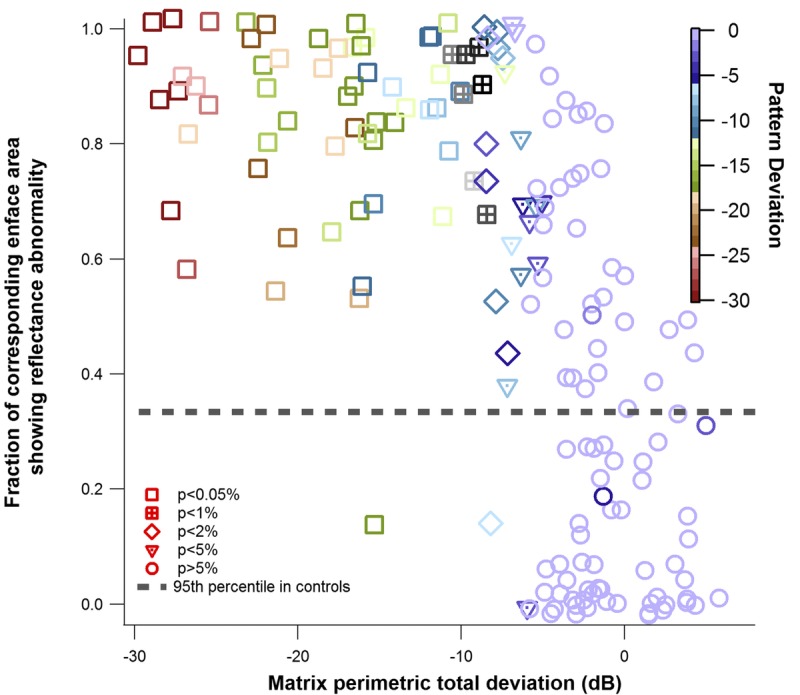
Local comparison of perimetric findings and reflectance findings, in the patients with glaucoma. Total deviation (TD) of Matrix perimetric testing plotted against the corresponding enface area showing reflectance abnormality. Small amounts of random noise were added to the x-axis and y-axis to differentiate identical points. The color of the marker indicates the pattern deviation (PD). The shape of the marker indicates the P value assigned to the total deviation measure, based on the perimetric machine norms.
FIGURE 8.

Global comparison of perimetric findings and reflectance findings in the patients with glaucoma. Mean deviation (MD) for Matrix perimetric testing plotted against the fraction of the enface image showing reflectance abnormality (at P < .05). The color of the marker indicates the pattern standard deviation (PSD). The short dashes show the 95th percentile of the reflectance abnormality quantified in the controls. The broken line shows the 5th percentile of the perimetric mean deviation estimated from the machine norms.
DISCUSSION
In this study, we describe a clinically applicable imaging and analysis protocol for identifying retinal nerve fiber bundle abnormalities in the region of the temporal raphe using the reflectance properties of the nerve fiber bundles. We evaluated the performance of the reflectance technique by comparing the nerve fiber bundle reflectance findings to Matrix perimetric findings and found a generally good agreement. In the patients with glaucoma, in almost all the perimetric locations where perimetric sensitivity was abnormal, the reflectance finding in the region was abnormal. However, it was not uncommon to find locations of substantial reflectance abnormality with mild to no perimetric abnormality.
The nerve fiber bundle reflectance patterns quantified in controls (Fig. 4) appear consistent with the overall patterns of the nerve fiber bundles.2,3,5 At any given point along the raphe line (y = 0), as the vertical distance from the raphe increases, the reflectance index increases, consistent with the adding-on of new fibers to the nerve fiber bundles as the bundles travel toward the disc.2 We concluded that the analysis approach captured the reflectance signature of the nerve fiber bundles and has promise for identifying regions of nerve fiber bundle reflectance abnormality in glaucomatous degeneration.
The reflectance findings in the younger controls were slightly higher than in the older controls (Fig. 5A), but the effect size was small. Consistent with the small aging effect, although the age range of the older controls was more heterogeneous than the age range of the younger controls, the variance of the reflectance findings within the two groups was similar (Fig. 5B). We deduce that in the absence of significant media opacities, age-adjusted models may not be needed in generating a normative database for analyzing nerve fiber layer reflectance abnormalities in OCT enface imaging.
Generally, there was a strong correlation between the fraction of enface image surface area showing reflectance abnormality and the perimetric findings (Fig. 7). This finding, together with the rarity of finding perimetric locations with substantial total deviation without a corresponding reflectance abnormality, provides a basis for the use of enface imaging for targeted perimetry.16 Thus, in the raphe, the chances of finding perimetric abnormality where the reflectance findings are within normative range is likely to be low.
The ability to resolve the individual nerve fiber bundles in the raphe makes it a potential site for evaluating early glaucomatous abnormality. Abnormality in the raphe can be quantified using changes in the overall reflectance of the nerve fibers bundle/layer (such as done in this study), changes in the width of the nerve bundles, or an increase in the potential gap between the superior and inferior raphe fibers reported elsewhere as “raphe gap”.4 These alternative ways of determining abnormality in the raphe make the region a potentially viable location for assessing abnormality when a diffuse nerve fiber bundle abnormality is suspected in a subject who otherwise has no localized wedge or arcuate defects in the peripapillary RNFL enface reflectance profile.17
As was reported in some previous studies,3,5,18,19 we also found a noticeable deviation of the raphe from the horizontal midline (Fig. 2) in some subjects. Clinically, this implies that it is possible for glaucomatous defects such as nasal steps to cross the horizontal midline, as the raphe does not always perfectly align with the horizontal midline.20 For studies investigating the impact of the retinal anatomical features on the trajectories of the nerve fiber bundles, it will be helpful to consider the impact of the raphe angle on the variability of the RNFB trajectories. The effects of cyclo-rotation may have artifactually impacted the angles shown in Fig. 2. Nonetheless, these angles provide a sense of the extent to which the raphe can deviate from the horizontal midline, and the variability that could exist between subjects during routine clinical testing.
In its current form, the nerve fiber bundle reflectance quantifying technique proposed in this study has some limitations. For example, the technique does not include a method for differentiating between non-retinal nerve fiber bundle reflectance sources such as putative glial alteration reflectances and retinal nerve fiber bundle reflectance.21,22 Further study will be needed to develop methods to mitigate the impact of non-bundle reflecting sources before the method can be widely used. Also, some previous studies have demonstrated the directional reflectivity property of the nerve fiber bundles. It will be useful to investigate how the directional reflectivity of the nerve fiber bundles affect OCT enface imaging of the temporal raphe.23
In conclusion, we developed a clinically applicable protocol for quantifying retinal nerve fiber bundle abnormality in the region of the retinal temporal raphe. The ability to quantify structural abnormality in the raphe, where the conformation of the bundles appears suitable for the early detection of glaucoma, opens the possibility of investigating the temporal raphe as a potential site for the early diagnosis of glaucoma.
Footnotes
Funding/Support: Supported by NIH R01EY024542 and P30EY019008.
Conflict of Interest Disclosure: WHS is a consultant for Carl Zeiss Meditec and Heidelberg Engineering. BSA, BJK, and VEM have no conflicts of interest.
Author Contributions and Acknowledgments: Conceptualization: BSA, BJK, WHS; Formal Analysis: BSA, WHS; Investigation: BSA; Methodology: BSA, BJK, VEM, WHS; Validation: BSA, WHS; Visualization: BSA, WHS, BJK, VEM; Writing – Original Draft: BSA; Writing – Review & Editing: BSA, BJK, VEM, WHS; Funding Acquisition: WHS; Resources: WHS; Software: WHS; Supervision: WHS.
The authors would like to thank Bobbi Dunderdale for coordinating the recruitment of subjects, consolidating the data, and commenting on the article. They would also like to thank Brittany Walker for recruiting and testing subjects for the study.
REFERENCES
- 1.Sakai T, Sano K, Tsuzuki K, et al. Temporal Raphe of the Retinal Nerve Fiber Layer Revealed by Medullated Fibers. Jpn J Ophthalmol 1987;31:655–8. [PubMed] [Google Scholar]
- 2.Vrabec F. The Temporal Raphe of the Human Retina. Am J Ophthalmol 1966;62:926–38. [DOI] [PubMed] [Google Scholar]
- 3.Huang G, Gast TJ, Burns SA. In Vivo Adaptive Optics Imaging of the Temporal Raphe and Its Relationship to the Optic Disc and Fovea in the Human Retina. Invest Ophthalmol Vis Sci 2014;55:5952–61. [DOI] [PMC free article] [PubMed] [Google Scholar]
- 4.Huang G, Luo T, Gast TJ, et al. Imaging Glaucomatous Damage Across the Temporal Raphe. Invest Ophthalmol Vis Sci 2015;56:3496–504. [DOI] [PMC free article] [PubMed] [Google Scholar]
- 5.Chauhan BC, Sharpe GP, Hutchison DM. Imaging of the Temporal Raphe with Optical Coherence Tomography. Ophthalmology 2014;121:2287–8. [DOI] [PubMed] [Google Scholar]
- 6.Asman P, Heijl A. Glaucoma Hemifield Test. Automated Visual Field Evaluation. Arch Ophthalmol 1992;110:812–9. [DOI] [PubMed] [Google Scholar]
- 7.Takayama K, Ooto S, Hangai M, et al. High-resolution Imaging of Retinal Nerve Fiber Bundles in Glaucoma Using Adaptive Optics Scanning Laser Ophthalmoscopy. Am J Ophthalmol 2013;155:870–81. [DOI] [PubMed] [Google Scholar]
- 8.Kocaoglu OP, Cense B, Jonnal RS, et al. Imaging Retinal Nerve Fiber Bundles Using Optical Coherence Tomography with Adaptive Optics. Vision Res 2011;51:1835–44. [DOI] [PMC free article] [PubMed] [Google Scholar]
- 9.Huang XR, Knighton RW, Cavuoto LN. Microtubule Contribution to the Reflectance of the Retinal Nerve Fiber Layer. Invest Ophthalmol Vis Sci 2006;47:5363–7. [DOI] [PubMed] [Google Scholar]
- 10.Huang X, Kong W, Zhou Y, et al. Distortion of Axonal Cytoskeleton: An Early Sign of Glaucomatous Damage. Invest Ophthalmol Vis Sci 2011;52:2879–88. [DOI] [PMC free article] [PubMed] [Google Scholar]
- 11.Swanson WH, Malinovsky VE, Dul MW, et al. Contrast Sensitivity Perimetry and Clinical Measures of Glaucomatous Damage. Optom Vis Sci 2014;91:1302–11. [DOI] [PMC free article] [PubMed] [Google Scholar]
- 12.Grieshaber MC, Orgul S, Schoetzau A, et al. Relationship Between Retinal Glial Cell Activation in Glaucoma and Vascular Dysregulation. J Glaucoma 2007;16:215–9. [DOI] [PubMed] [Google Scholar]
- 13.Girard MJ, Strouthidis NG, Ethier CR, et al. Shadow Removal and Contrast Enhancement in Optical Coherence Tomography Images of the Human Optic Nerve Head. Invest Ophthalmol Vis Sci 2011;52:7738–48. [DOI] [PubMed] [Google Scholar]
- 14.Vermeer KA, Mo J, Weda JJ, et al. Depth-resolved Model-based Reconstruction of Attenuation Coefficients in Optical Coherence Tomography. Biomed Opt Express 2013;5:322–37. [DOI] [PMC free article] [PubMed] [Google Scholar]
- 15.Horn FK, Scharch V, Mardin CY, et al. Comparison of Frequency Doubling and Flicker Defined Form Perimetry in Early Glaucoma. Graefes Arch Clin Exp Ophthalmol 2016;254:937–46. [DOI] [PubMed] [Google Scholar]
- 16.Schiefer U, Malsam A, Flad M, et al. Evaluation of Glaucomatous Visual Field Loss with Locally Condensed Grids Using Fundus-oriented Perimetry (FOP). Eur J Ophthalmol 2001;11(Suppl. 2):S57–62. [DOI] [PubMed] [Google Scholar]
- 17.Hood DC, Fortune B, Mavrommatis MA, et al. Details of Glaucomatous Damage are Better Seen on OCT En Face Images Than on OCT Retinal Nerve Fiber Layer Thickness Maps. Invest Ophthalmol Vis Sci 2015;56:6208–16. [DOI] [PMC free article] [PubMed] [Google Scholar]
- 18.Bedggood P, Nguyen B, Lakkis G, et al. Orientation of the Temporal Nerve Fiber Raphe in Healthy and in Glaucomatous Eyes. Invest Ophthalmol Vis Sci 2017;58:4211–7. [DOI] [PubMed] [Google Scholar]
- 19.Tanabe F, Matsumoto C, McKendrick AM, et al. The Interpretation of Results of 10-2 Visual Fields Should Consider Individual Variability in the Position of the Optic Disc and Temporal Raphe. Br J Ophthalmol 2018;102:323–8. [DOI] [PubMed] [Google Scholar]
- 20.McKendrick AM, Denniss J, Wang YX, et al. The Proportion of Individuals Likely to Benefit From Customized Optic Nerve Head Structure–Function Mapping. Ophthalmology 2017;124:554–61. [DOI] [PubMed] [Google Scholar]
- 21.Graf T, Flammer J, Prunte C, et al. Gliosis-like Retinal Alterations in Glaucoma Patients. J Glaucoma 1993;2:257–9. [PubMed] [Google Scholar]
- 22.Grieshaber MC, Moramarco F, Schoetzau A, et al. Detection of Retinal Glial Cell Activation in Glaucoma by Time Domain Optical Coherence Tomography. Klin Monbl Augenheilkd 2012;229:314–8. [DOI] [PubMed] [Google Scholar]
- 23.Huang XR, Knighton RW, Feuer WJ, et al. Retinal Nerve Fiber Layer Reflectometry Must Consider Directional Reflectance. Biomed Opt Express 2015;7:22–33. [DOI] [PMC free article] [PubMed] [Google Scholar]


