

Abstract
Tumor infiltrating leukocytes (TILs) are an integral component of the tumor microenvironment and have been found to correlate with prognosis and response to therapy. Methods to enumerate immune subsets such as immunohistochemistry or flow cytometry suffer from limitations in phenotypic markers and can be challenging to practically implement and standardize. An alternative approach is to acquire aggregative high dimensional data from cellular mixtures and to subsequently infer the cellular components computationally. We recently described CIBERSORT, a versatile computational method for quantifying cell fractions from bulk tissue gene expression profiles (GEPs). Combining support vector regression with prior knowledge of expression profiles from purified leukocyte subsets, CIBERSORT can accurately estimate the immune composition of a tumor biopsy. In this chapter, we provide a primer on the CIBERSORT method and illustrate its use for characterizing TILs in tumor samples profiled by microarray or RNA-Seq.
Keywords: Cancer immunology, Deconvolution, Support vector regression (SVR), Tumor infiltrating leukocytes, TILs, Tumor microenvironment, Tumor heterogeneity, Gene expression, Microarray, RNA-Seq, TCGA
1.1 Introduction
Neoplastic cells reside within a complex tumor microenvironment necessary for tumor growth and survival. Numerous non-neoplastic cell types including tumor-infiltrating leukocytes (TILs) comprise the tumor stroma. This immune infiltrate is often a heterogeneous mixture of immune cells that includes both innate and adaptive immune populations, and cell types associated with active (e.g. cytotoxic T lymphocytes) and suppressive (e.g. regulatory T cells, myeloid derived suppressor cells) immune functions. The significance of TILs varies by cancer histology, with the presence of certain immune subsets often exhibiting a beneficial prognostic effect in one malignancy but a detrimental effect in another cancer type [1,2]. The importance of TIL assessment continues to grow with the development of novel immunotherapeutic agents designed to target these cells. Recent studies have found that T lymphocyte subsets (e.g., CD8+) may predict response to existing and emerging immunotherapies, highlighting the importance of investigating tumor associated immune cells as potential predictive biomarkers [3–5].
Measurement of the tumor immune infiltrate has traditionally been evaluated by histology on tissue sections and immune subsets inferred by immunohistochemistry of individual markers. However, immunophenotyping typically requires multiple parameters to accurately subset populations, and thus immunohistochemistry is unable to identify many immune populations and performs poorly at capturing functional phenotypes (e.g. activated vs. resting lymphocytes). Flow cytometry is an alternative method of quantifying immune infiltrates that enables simultaneous measurement of multiple parameters. However, this method requires prompt and careful processing of samples as well as tissue disaggregation, which may result in the loss of fragile cell types and the distortion of gene expression profiles. While flow cytometry can assess multiple markers, this number is still limited, potentially excluding markers that may better discriminate closely related cell populations [6].
In contrast, gene expression profiling of bulk tissues does not depend on surface markers and does not suffer from artifacts related to cellular dissociation. Samples can be readily processed and stored in a standardized fashion, mitigating issues that may confound data collected at different times and from different locations. Although previous studies of bulk tumor samples revealed a number of immune-enriched gene signatures with prognostic significance [7,8], linking these signatures to specific TIL phenotypes has been challenging [9–13]. Methods for mathematically separating the bulk tumor gene expression profiles (GEP) into its component cell types can overcome this issue.
Several computational tools, including linear least-square regression (LLSR) [6], microarray microdissection with analysis of differences (MMAD) [14] and digital sorting algorithm (DSA) [15], have been applied to the deconvolution of complex GEP mixtures to infer cellular composition. Although these approaches are effective for enumerating highly distinct cell types in mixtures with minimal unknown content (e.g., lymphocytes, monocytes, and neutrophils in whole blood), they are sensitive to experimental noise, high unknown mixture content, and closely related cell types, limiting their utility for TIL assessment [16,17].
CIBERSORT, a computational approach developed by our group, aims to address these challenges (See Figure 1) [16]. Like other methods, CIBERSORT requires a specialized knowledgebase of gene expression signatures, termed a “signature matrix,” for the deconvolution of cell types of interest. However, in contrast to previous efforts, CIBERSORT implements a machine learning approach, called support vector regression (SVR), that improves deconvolution performance through a combination of feature selection and robust mathematical optimization techniques (for details, see section 1.2). In benchmarking experiments, CIBERSORT was more accurate than other methods in resolving closely related cell subsets and in mixtures with unknown cell types (e.g., solid tissues) [16]. Thus, CIBERSORT is a useful approach for high throughput characterization of diverse cell types, such as TILs, from complex tissues. Here, we provide users with a practical roadmap for dissecting leukocyte content in tumor gene expression datasets with CIBERSORT.
Figure 1.
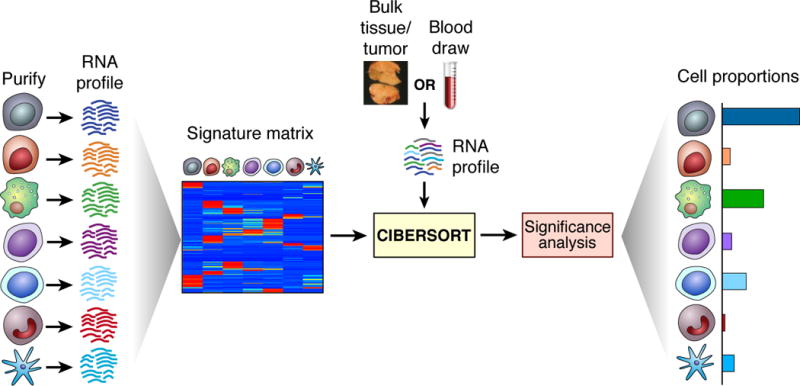
Overview of CIBERSORT. As input, CIBERSORT requires a “signature matrix” comprised of barcode genes that are enriched in each cell type of interest. Once a suitable knowledgebase is created and validated, CIBERSORT can be applied to characterize cell type proportions in bulk tissue expression profiles. Although originally validated using a signature matrix containing 22 functionally defined human immune subsets (LM22) profiled by microarrays, CIBERSORT is a general framework that can be applied to diverse cell phenotypes and genomic data types, including RNA-Seq. To quantitatively capture deconvolution confidence, CIBERSORT calculates several quality control metrics, including a deconvolution p-value.
1.2 CIBERSORT model
The objective of most gene expression deconvolution algorithms, including CIBERSORT, is to solve the following system of linear equations for f:
m: a vector consisting of a mixture GEP (input requirement).
f: a vector consisting of the fraction of each cell type in the signature matrix (unknown).
B: a “signature matrix” containing signature genes for cell subsets of interest (input requirement).
CIBERSORT differs from previous deconvolution methods in its application of a machine learning technique, ν-support vector regression (ν-SVR), to solve for f [18]. Briefly, SVR defines a hyperplane that captures as many data points as possible given defined constraints, and reduces overfitting by only penalizing data points outside a certain error radius (termed support vectors) using a linear “epsilon-insensitive” loss function. The orientation of the hyperplane determines f. In the original description of CIBERSORT, the support vectors were genes selected from a signature matrix, however the CIBERSORT algorithm is completely generalizable and can be applied to various genomic features [19]. The parameter ν determines the lower bound of support vectors and the upper bound of training errors. CIBERSORT uses a set of ν values (0.25, 0.5, 0.75) and chooses the value producing the best performance (i.e. the lowest root mean square between m and the deconvolution result f × B). In addition, ν-SVR incorporates L2-norm regularization, which minimizes the variance in the weights assigned to highly correlated cell types, thereby mitigating issues owing to multicollinearity.
CIBERSORT also allows users to create a custom signature matrix with a method that identifies features with maximal discriminatory power. Differentially expressed genes between cell types of interest are identified by a two-sided unequal variance t-test corrected for multiple hypothesis testing. A feature selection step is then performed to minimize the condition number, a matrix property that captures how well the linear system tolerates input variation and noise. For signature matrices comprised exclusively of immune cell types, there is an option to filter non-hematopoietic and cancer specific genes to reduce the influence of non-immune cells on deconvolution results. By choosing features that minimize the condition number, CIBERSORT improves the stability of the signature matrix and further reduces the impact of multicollinearity. Additional details of the CIBERSORT method can be found in the original publication [16].
2 Materials
The general workflow for analyzing RNA admixtures with CIBERSORT consists of two key input files (see Figure 1):
1) The “mixture file” is a single tab-delimited text file containing 1 or more GEPs of biological mixture samples (See Table 1). The first column contains gene names and should have “Name” (or similar) as a column header (i.e., in the space occupying column 1, row 1). Multiple samples may be analyzed in parallel, with the remaining columns (2, 3, etc.) dedicated to mixture GEPs, where each row represents the expression value for a given gene and the column header is the name of the mixture sample. Note that the mixture file and the signature matrix must share the same naming scheme for gene identifiers.
2) The “signature matrix” is a tab-delimited text file consisting of sets of “barcode genes” whose expression values collectively define unique gene expression signatures for each cell subset of interest. The file format is similar to the mixture file, with gene names in column 1, however the remaining columns consist of signature GEPs from individual cell subsets. A validated leukocyte gene signature matrix (LM22) is available for the deconvolution of 22 functionally defined human hematopoietic subsets. LM22 was generated using Affymetrix HGU133A microarray data [16] and has been rigorously tested on Affymetrix HGU133 and Illumina Beadchip platforms. For the application of LM22 to RNA-Seq data, see section 5.1.
Table 1.
Format of input mixture files (tab separated plain text)
| Gene_symbole (required) | Mixture 1 | Mixture 2 | … |
|---|---|---|---|
| Gene1 | |||
| Gene2 | |||
| … |
Importantly, all expression data should be non-negative, devoid of missing values, and represented in non-log linear space. For Affymetrix microarrays, a custom chip definition file (CDF) is recommended (see section 3.2.2) and should be normalized with MAS5 or RMA. Illumina Beadchip and single color Agilent arrays should be processed as described in the limma package. Standard RNA-Seq expression quantification metrics, such as fragments per kilobase per million (FPKM) and transcripts per kilobase million (TPM), are suitable for use with CIBERSORT.
In the sections below, we illustrate how CIBERSORT can be used to analyze complex tissues, whether profiled by microarray (section 3.2) or RNA-Seq (sections 3.3 and 4). We also provide instructions for custom signature matrix creation (section 3.3). Although this protocol focuses on the deconvolution of gene expression data, CIBERSORT can be applied to other genomic data types, such as ATAC-Seq, provided that data from purified components are available on the same platform. Public genomic data repositories include the NIH Gene Expression Omnibus database (GEO, http://www.ncbi.nlm.nih.gov/geo/) and the NIH Genomic Data Commons (https://gdc.cancer.gov/). See sections 3.3 and 5.1 for more details. All files necessary for this protocol can be downloaded through the links or from the CIBERSORT website.
3 Methods
3.1 Installation
CIBERSORT can be run online (http://cibersort.stanford.edu/) or downloaded for local use, and is freely available for academic non-profit research. R and Java implementations are available for download. While the current R script can be used to run the CIBERSORT deconvolution engine, users wishing to create a custom signature matrix will need to use the website or the Java executable.
The CIBERSORT R and Java implementations have several dependencies, including R version v3.0 or later (both versions), java (Java version only), and the following R packages. The ‘affy’, ‘annotate’ and ‘org.Hs.eg.db’ packages are required only if using the R script from the CIBERSORT website to process HGU133 Affymetrix CEL files as previously described.
Within R:
> install.packages(‘e1071’) #R and Java versions
> source(“http://bioconductor.org/biocLite.R„)
> biocLite(‘preprocessCore’) #R and Java versions
> biocLite(‘Rserve’) #Java version only
> biocLite(‘colorRamps’) #Java version only
> biocLite(‘affy’) # required to convert Affymetrix CEL files to CIBERSORT format
> biocLite(‘annotate’) # required to convert Affymetrix CEL files to CIBERSORT format
> biocLite(‘org.Hs.eg.db’) # required convert Affymetrix CEL files to CIBERSORT format
3.2 Enumerating TIL subsets with LM22
LM22 is a signature matrix file consisting of 547 genes that accurately distinguish 22 mature human hematopoietic populations isolated from peripheral blood or in vitro culture conditions, including seven T cell types, naïve and memory B cells, plasma cells, NK cells, and myeloid subsets. LM22 was designed and extensively validated on gene expression microarray data, but is also applicable to RNA-Seq data for hypothesis generation (section 5.1). Here, we illustrate how to prepare Affymetrix microarray data for use with LM22, and how to run CIBERSORT with LM22 to characterize the leukocyte composition of prostate biopsies obtained from patients with prostate cancer and from healthy subjects. To follow the examples in this section, download GSE55945 CEL files from GEO (https://www.ncbi.nlm.nih.gov/geo/download/?acc=GSE55945&format=file). Processed data for GSE55945 can be downloaded from the CIBERSORT website.
3.2.1 General tips for mixture file preparation
Gene expression data must be preprocessed as specified in Materials and in section 3.2.2 below. Because LM22 uses HUGO gene symbols (e.g. CD8A, MS4A1, CTLA4, etc.), all mixture files need to possess matching HUGO identifiers. Importantly, all expression values should be in non-log (i.e. linear) space with positive numerical values and no missing data. Not all signature matrix genes need to be present in the mixture expression data, but performance will improve with the presence of more signature genes.
3.2.2 Preparation of Affymetrix CEL files
The CIBERSORT website provides an R script to convert Affymetrix CEL files, the raw data format for Affymetrix microarray experiments, into a tabular format that is ready for analysis with CIBERSORT (Menu>Download). All packages specified in the Installation section will need to be downloaded, along with a custom CDF from BrainArray (http://brainarray.mbni.med.umich.edu/Brainarray/Database/CustomCDF/20.0.0/entrezg.asp). The custom CDF must be compatible with the microarray platform used to profile the mixtures (e.g., for HGU133 Plus 2.0, download hgu133plus2hsentrezgcdf_20.0.0.tar.gz); the latest entrezg version is always recommended. Download the custom CDF and run the following terminal command to install the R library:
sudo R CMD INSTALL downloaded_customCDF_filename.tar.gz
The user is advised to run this step on a machine with root access or a self-contained R environment like RGui. Next, navigate to the directory containing raw Affymetrix CEL files (GSE55945 in this example) and run CEL_to_mixture.R, an R script that should be placed in the same folder as the CEL files. The script will output a correctly formatted CIBERSORT mixture file named NormalizedExpressionArray.customCDF.txt. For this example, rename to ‘prostate_cancer.txt’.
3.2.3 Running CIBERSORT
Before running CIBERSORT, all mixture files need to be uploaded (Menu > ‘Upload Files’). The user needs to select ‘Mixture’ when uploading mixture files. After uploading the correctly formatted mixture file (e.g., prostate_cancer.txt) to the website, go to ‘Run CIBERSORT’ under Menu (See Figure 2). Select ‘LM22 (22 immune cell types)’ for ‘Signature gene file’. When clicking ‘Mixture file’, the uploaded mixture file will be one of the options. Select ‘Run’ after choosing both the mixture file of interest and a permutation number. At least 100 permutations are recommended to achieve statistical rigor.
Figure 2.
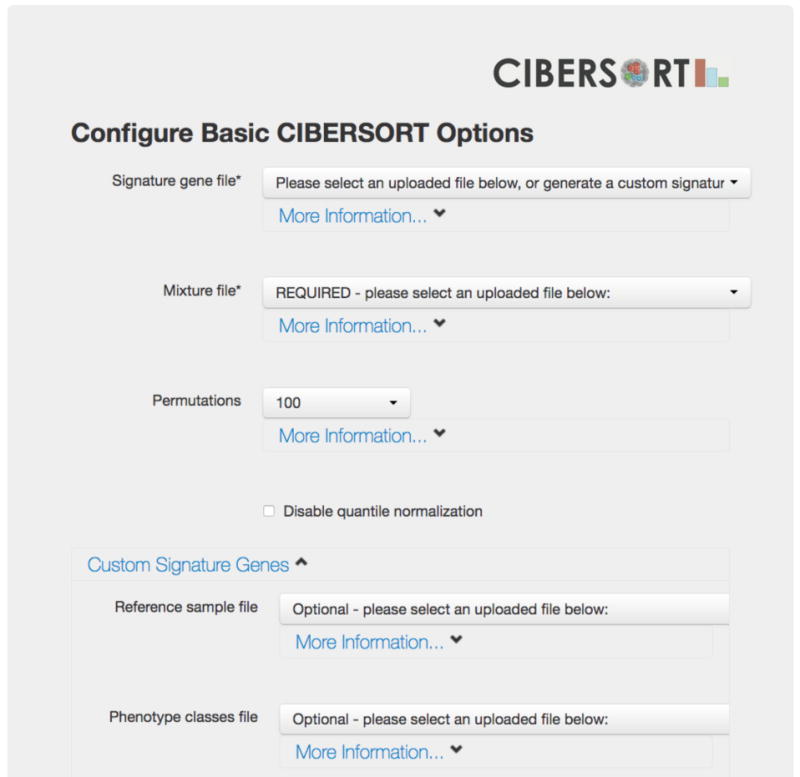
CIBERSORT web interface. All files except the LM22 gene signature need to be uploaded to the CIBERSORT website before proceeding to this page. When using LM22, the user will need to select their uploaded mixture file and specify “LM22 (22 immune cell types)” for the signature gene file. When creating custom gene signatures, a reference sample file and a phenotype classes file are required, and need to be uploaded to the webserver. For CIBERSORT to generate a meaningful p-value, we recommend at least 100 permutations, however this parameter can be significantly lower (or even set to 1) for exploratory analyses.
To run CIBERSORT locally in R, navigate to the directory containing the CIBERSORT.R script, and run the following commands within the R terminal:
> source(‘CIBERSORT.R’)
> results <- CIBERSORT(‘sig_matrix_file.txt’, ‘mixture_file.txt’, perm=100, QN=TRUE)
Deconvolution output will be saved to a results object in R and written to disk as CIBERSORT-results.txt in the same directory.
In this example, sig_matrix_file.txt should be ‘LM22.txt’ (obtain under Menu>Download); mixture_file.txt should be ‘prostate_cancer.txt’; perm is an integer number for the number of permutations; and QN is a boolean value (TRUE or FALSE) for performing quantile normalization. QN is set to TRUE by default and recommended when the gene signature matrix is derived from several different studies or sample batches.
3.2.4 Interpretation of results
Once the online analysis is complete, the website will output a stacked bar plot (See Figure 3) and a heat map (See Figure 4). The output includes a p-value for the global deconvolution of each sample. A p-value threshold <0.05 is recommended. By default, deconvolution results are expressed as relative fractions normalized to 1 (e.g., fractions of total leukocyte content). Researchers interested in studying absolute levels of immune cells should refer to Section 5.2.
Figure 3.

Inferred composition of 22 immune cell subsets in malignant and healthy prostate biopsies (related to section 3.2). The results were generated using CIBERSORT and the built-in LM22 immune cell gene signature, and the stacked bar plot figure was automatically generated by the CIBERSORT webserver.
Figure 4.
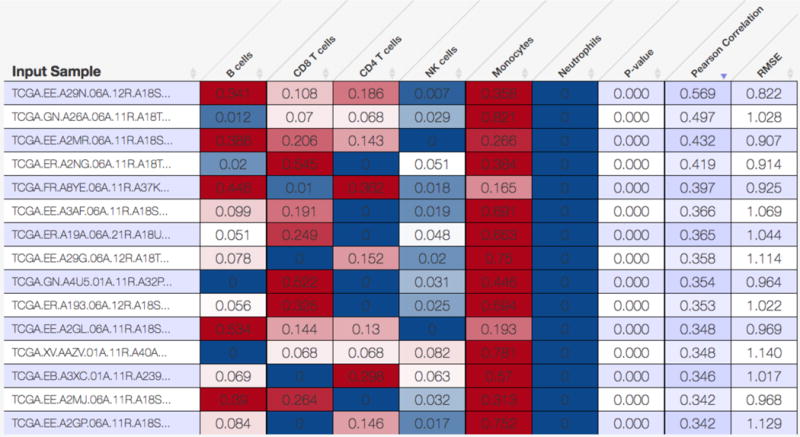
Estimated proportions of six major leukocyte subsets (B cells, CD8 T cells, CD4 T cells, NK cells, monocytes/macrophages, neutrophils) in skin cutaneous melanoma tumor biopsies profiled by The Cancer Genome Atlas (TCGA). The results were determined using a custom RNA-Seq leukocyte signature matrix (‘LM6’, section 3.3.3), and the heat map figure was generated by the CIBERSORT webserver.
3.3 TIL characterization with a custom signature matrix
3.3.1 Generation of expression profiles for custom gene signature matrix creation
A custom signature matrix can be created using data from purified cell populations. While the process to generate a custom matrix from expression profiles is straightforward, the performance of a custom matrix will depend on the quality of the data used to generate it. Immunophenotyping of leukocytes is a dynamic field with new immune populations continuing to be identified. Care should be taken in determining which immune “cell types” should be included in the signature matrix and which canonical markers should be used to isolate these populations. For example, it is clear that the population of “CD4-expressing T lymphocytes” encompasses heterogeneous populations with diverse functional phenotypes including naïve, memory, Th1, Th2, Th17, T-regulatory cells and T follicular helper cells. Replicates for each purified immune cell type are required to gauge variance in the expression profile (see 5.4 for further details). The platform and methods used to generate data for the signature matrix ideally should be identical to that applied to analysis of the mixture samples. While SVR is robust to unknown cell populations, performance can be adversely affected by genes that are highly expressed in a relevant unknown cell population (e.g., in the malignant cells) but not by any immune components present in the signature matrix. A simple option implemented in CIBERSORT to limit this effect is to remove genes highly expressed in non-hematopoietic cells or tumor cells. If expression data is available from purified tumor cells for the malignancy to be studied, this can be used as a guideline to filter other confounding genes from the signature matrix.
3.3.2 Input data preparation
The mixture input data format for custom signature gene matrix option is identical to the analysis with the LM22 signature gene matrix (section 3.2.1). To generate the custom signature gene matrix, the user needs to provide a reference sample file containing the GEPs for each purified immune population of interest, and a phenotype class file assigning the profiles to each phenotypic type of immune cell to be included in the signature matrix. The expression data in the reference sample file should be in non-log (i.e., linear) space with genes listed in the rows and reference populations listed in columns. The phenotype class file lists the desired cell populations in the signature matrix listed in rows and the purified reference samples contained in the reference sample file listed in columns (refer to the CIBSERORT website manual for more details). These must be listed in the exact same order as the reference sample file. The cells are used to assign phenotypic classes to each purified reference sample. Importantly, all cell types should be represented by at least two replicates in order to identify genes with significant differential expression (see Section 5.5).
For ease of use, we have created an R script to generate both intermediate files (the script is available from the CIBERSORT website). Gene expression data for each purified sample should be formatted similarly to the mixture input data (See Table 2) and each replicate of the same cell type must be labeled with the identical phenotypic class name. To run the script, execute the following command:
Rscript generate_ref_and_class.R your_input_mixture_file.txt
Table 2.
Format of input files to generate reference files and class files necessary for custom gene signatures (tab separated plain text)
| Gene_symbole (required) | Cell Type Name1 |
Cell Type Name1 |
Cell Type Name1 |
Cell Type Name2 |
Cell Type Name2 |
Cell Type Name2 |
… |
|---|---|---|---|---|---|---|---|
| Gene1 | |||||||
| Gene2 | |||||||
| … |
The script will produce two output files, both of which are required to build a signature matrix: class_file.input.txt (i.e., phenotype class file) and reference_file.input.txt (i.e., reference sample file).
3.3.3 Creating the signature matrix
In the following two sections, we describe how to create a custom leukocyte signature matrix and apply it to study cellular heterogeneity and TIL survival associations in melanoma tumors profiled by The Cancer Genome Atlas (TCGA). Readers can follow along by creating ‘LM6’, a leukocyte RNA-Seq signature matrix comprised of six peripheral blood immune subsets (B cells, CD8 T cells, CD4 T cells, NK cells, monocytes/macrophages, neutrophils; GSE60424 [20]). Key input files are provided on the CIBERSORT website (‘Menu>Download’).
A custom signature file can be created by uploading the Reference sample file and the Phenotype classes file (section 3.3.2) to the online CIBERSORT application (See Figure 2) or can be created using the downloadable Java package. To build a custom gene signature matrix with the latter, the user should download the Java package from the CIBERSORT website and place all relevant files under the package folder. To link Java with R, run the following in R:
Within R:
> library(Rserve)
> Rserve(args=“–no-save”)
Command line:
> java -Xmx3g -Xms3g -jar CIBERSORT.jar -M Mixture_file -P Reference_sample_file -c phenotype_class_file -f
The last argument (-f) will eliminate non-hematopoietic genes from the signature matrix and is generally recommended for signature matrices tailored to leukocyte deconvolution. The user can also run this step on the website by choosing the corresponding reference sample file and phenotype class file (see Figure 2). The CIBERSORT website will generate a gene signature matrix located under ‘Uploaded Files’ for future download.
Following signature matrix creation, quality control measures should be taken to ensure robust performance (see ‘Calibration of in silico TIL profiling methods’ in Newman et al.) [17]. Factors that can adversely affect signature matrix performance include poor input data quality, significant deviations in gene expression between cell types that reside in different tissue compartments (e.g., blood versus tissue), and cell populations with statistically indistinguishable expression patterns. Manual filtering of poorly performing genes in the signature matrix (e.g., genes expressed highly in the tumor of interest) may improve performance.
To benchmark our custom leukocyte matrix (LM6), we compared it to LM22 using a set of TCGA lung squamous cell carcinoma tumors profiled by RNA-Seq and microarray (n = 130 pairs). Deconvolution results were significantly correlated for all cell subsets shared between the two signature matrices (P < 0.0001). Notably, since LM6 was derived from leukocytes isolated from peripheral blood [20,21], we restricted the CD4 T cell comparison to naïve and resting memory CD4 T cells in LM22. Once validation is complete, a CIBERSORT signature matrix can be broadly applied to mixture samples as described in section 3.3 (e.g., See Figure 4).
4 Correlating TIL levels with clinical outcomes
Associations with clinical indices and outcomes are commonly assessed using a log-rank test for binary variables and Cox proportional hazards regression for continuous variables. There are a number of freely available tools for such analyses. We typically use the R ‘survival’ package or the python ‘lifelines’ package. To illustrate TIL survival analysis in primary tumor samples, we applied LM6 (section 3.3.3) to 473 TCGA skin cutaneous melanoma tumor samples profiled by RNA-Seq (See Figure 4). We then analyzed the influence of estimated CD8 T cell levels on overall survival. Higher levels of CD8 T lymphocytes were associated with favorable overall survival in both dichotomous (Figure 5) and continuous models (P = 0.013, Cox regression), consistent with previous studies [22].
Figure 5.

Association between inferred tumor-infiltrating CD8 T cell content and overall survival in patients with skin cutaneous melanoma profiled by TCGA (related to section 4). Estimated CD8 T cell levels were stratified by a median split, and the separation between survival curves was evaluated using a log-rank test. Only patients with available survival data and with a significant CIBERSORT p-value (<0.05) were considered for this analysis (n = 364). HR, hazard ratio. 95% confidence intervals for the hazard ratio are shown in brackets.
5 Notes
5.1 Application of LM22 to RNA-Seq
CIBERSORT is platform agnostic and can be applied to any genomic admixture that satisfies its mathematical model (section 1.2), including mixtures profiled by RNA-Seq. Although LM22 was derived and originally validated using microarray data, we have observed significant correlations for most of LM22 populations on paired microarray/RNA-Seq TCGA datasets, suggesting it is reasonable to apply LM22 to RNA-Seq data for hypothesis generation. Nevertheless, if significant subsets of genes within LM22 are not present in the RNA-Seq summarization, the deconvolution of the corresponding cell types may be adversely affected. To avoid such potential degradation of deconvolution, we strongly recommend including as many genes as possible within LM22 (e.g., components of BCR and TCR genes). Separately, it has been noted that RNA-Seq mixture samples analyzed by the LM22 matrix will have a higher frequency of samples with p-values above 0.05. This is largely due to the differing dynamic range of RNA-Seq and microarray data, and may not accurately reflect the quality of the deconvolution results. Users should therefore exercise caution in interpreting cross-platform p-values. An RNA-Seq derived signature matrix analogous to LM22 is currently being developed with an expanded set of immune populations by the authors.
5.2 Use of CIBERSORT to infer absolute TIL levels
By default, CIBERSORT estimates the relative fraction of each cell type in the signature matrix, such that the sum of all fractions is equal to 1 for a given mixture sample. CIBERSORT can also be used to produce a score that quantitatively measures the overall abundance of each cell type (as described in ‘Analysis of deconvolution consistency’ in Newman et al.) [16]. Briefly, the absolute immune fraction score is estimated by the median expression level of all genes in the signature matrix divided by the median expression level of all genes in the mixture. Using this metric coupled with LM22, we have found that CIBERSORT effectively captures overall immune content in RNA-Seq and microarray datasets when benchmarked against other methods. These include H&E staining and computational inference by ESTIMATE [23], a previously published method for determining overall immune content in tumor expression profiles.
Absolute results can be easily accessed from the CIBERSORT website by toggling the output between relative and absolute modes in the Results page (see online manual for details). When using the R script (section 3.2.3), the user should download the latest version of the script and set ‘absolute=TRUE’. For example:
results <- CIBERSORT(‘sig_matrix_file.txt’, ‘mixture_file.txt’, perm=100, absolute=TRUE)
5.3 Use of identifiers other than HUGO gene symbols
HUGO gene symbols are required as input when the LM22 signature matrix is used. However, CIBERSORT is not restricted to HUGO gene symbols, and users working with custom gene signatures can employ any set of unique alphanumeric identifiers, provided they are consistent between the signature matrix and the mixture file. When a user is not using HUGO gene symbols, the non-hematopoietic gene filtering functions will not work since these lists are represented in HUGO format.
5.4 Use of CIBERSORT for non-human data
Applying the LM22 matrix to a murine tumor may be unreliable due to cross-species differences in immune biology. A user working with murine data should consider building a custom signature matrix with either publicly available data (e.g., ImmGen; https://www.immgen.org/) or in-house data.
5.5 Use of replicates for building a custom gene signature matrix
The CIBERSORT model builds a gene signature matrix by minimizing gene expression variance within the same cell type and by maximizing variance between cell types; it is therefore important to use data replicates. Cell types should be isolated from the same tissue type or culture conditions, and biological replicates are recommended to help the model capture donor-to-donor variations. To increase statistical power, we recommend using three or more replicates for each cell subset.
6 Conclusion
CIBERSORT is an in silico approach for characterizing cell subsets of interest in high-dimensional genomic data derived from bulk tissue samples. Given a validated signature matrix, CIBERSORT can profile compositional differences in a standardized manner, facilitating robust and reproducible analyses of cellular heterogeneity in both new and archived genomic datasets, fresh/frozen tissue biopsies, and fixed clinical specimens. Since CIBERSORT is platform agnostic, it can be applied to diverse genomic data types other than mRNA, including DNA methylation, microRNA, proteomic, and chromatin accessibility profiles. CIBERSORT is therefore a versatile framework for tissue characterization, with applications for identifying predictive and prognostic cellular biomarkers, and novel therapeutic targets.
Acknowledgments
We would like to thank David Steiner, MD, PhD for his assistance in generating the RNA-Seq derived signature matrix. This work is supported by grants from the Doris Duke Charitable Foundation (A.A.A.), the Damon Runyon Cancer Research Foundation (A.A.A.), the B&J Cardan Oncology Research Fund (A.A.A.), the Ludwig Institute for Cancer Research (A.A.A.), NIH grant U01CA194389 (A.A.A.), NIH grant 1K99CA187192-01A1 (A.M.N.), NIH grant PHS NRSA 5T32 CA09302-35 (A.M.N.), US Department of Defense grant W81XWH-12-1-0498 (A.M.N.), a grant from the Siebel Stem Cell Institute and the Thomas and Stacey Siebel Foundation (A.M.N.), an NIH/Stanford MSTP training grant (B.C.), and a PD Soros Fellowship (B.C.).
References
- 1.Fridman WH, Pagès F, Sautès-Fridman C, Galon J. The immune contexture in human tumours: impact on clinical outcome. Nat Rev Cancer. 2012;12(4):298–306. doi: 10.1038/nrc3245. [DOI] [PubMed] [Google Scholar]
- 2.Gentles AJ, Newman AM, Liu CL, Bratman SV, Feng W, Kim D, Nair VS, Xu Y, Khuong A, Hoang CD, Diehn M, West RB, Plevritis SK, Alizadeh AA. The prognostic landscape of genes and infiltrating immune cells across human cancers. Nature medicine. 2015;21(8):938–945. doi: 10.1038/nm.3909. [DOI] [PMC free article] [PubMed] [Google Scholar]
- 3.Tumeh PC, Harview CL, Yearley JH, Shintaku IP, Taylor EJ, Robert L, Chmielowski B, Spasic M, Henry G, Ciobanu V, West AN, Carmona M, Kivork C, Seja E, Cherry G, Gutierrez AJ, Grogan TR, Mateus C, Tomasic G, Glaspy JA, Emerson RO, Robins H, Pierce RH, Elashoff DA, Robert C, Ribas A. PD-1 blockade induces responses by inhibiting adaptive immune resistance. Nature. 2014;515(7528):568–571. doi: 10.1038/nature13954. [DOI] [PMC free article] [PubMed] [Google Scholar]
- 4.Herbst RS, Soria JC, Kowanetz M, Fine GD, Hamid O, Gordon MS, Sosman JA, McDermott DF, Powderly JD, Gettinger SN, Kohrt HE, Horn L, Lawrence DP, Rost S, Leabman M, Xiao Y, Mokatrin A, Koeppen H, Hegde PS, Mellman I, Chen DS, Hodi FS. Predictive correlates of response to the anti-PD-L1 antibody MPDL3280A in cancer patients. Nature. 2014;515(7528):563–567. doi: 10.1038/nature14011. [DOI] [PMC free article] [PubMed] [Google Scholar]
- 5.Ji RR, Chasalow SD, Wang L, Hamid O, Schmidt H, Cogswell J, Alaparthy S, Berman D, Jure-Kunkel M, Siemers NO, Jackson JR, Shahabi V. An immune-active tumor microenvironment favors clinical response to ipilimumab. Cancer Immunol Immunother. 2012;61(7):1019–1031. doi: 10.1007/s00262-011-1172-6. [DOI] [PMC free article] [PubMed] [Google Scholar]
- 6.Abbas AR, Wolslegel K, Seshasayee D, Modrusan Z, Clark HF. Deconvolution of blood microarray data identifies cellular activation patterns in systemic lupus erythematosus. PloS one. 2009;4(7):e6098. doi: 10.1371/journal.pone.0006098. [DOI] [PMC free article] [PubMed] [Google Scholar]
- 7.Curtis C, Shah SP, Chin SF, Turashvili G, Rueda OM, Dunning MJ, Speed D, Lynch AG, Samarajiwa S, Yuan Y, Gräf S, Ha G, Haffari G, Bashashati A, Russell R, McKinney S, Langerød A, Green A, Provenzano E, Wishart G, Pinder S, Watson P, Markowetz F, Murphy L, Ellis I, Purushotham A, Børresen-Dale AL, Brenton JD, Tavaré S, Caldas C, Aparicio S, Group M The genomic and transcriptomic architecture of 2,000 breast tumours reveals novel subgroups. Nature. 2012;486(7403):346–352. doi: 10.1038/nature10983. [DOI] [PMC free article] [PubMed] [Google Scholar]
- 8.Ascierto ML, Kmieciak M, Idowu MO, Manjili R, Zhao Y, Grimes M, Dumur C, Wang E, Ramakrishnan V, Wang XY, Bear HD, Marincola FM, Manjili MH. A signature of immune function genes associated with recurrence-free survival in breast cancer patients. Breast Cancer Res Treat. 2012;131(3):871–880. doi: 10.1007/s10549-011-1470-x. [DOI] [PMC free article] [PubMed] [Google Scholar]
- 9.Mann GJ, Pupo GM, Campain AE, Carter CD, Schramm SJ, Pianova S, Gerega SK, De Silva C, Lai K, Wilmott JS, Synnott M, Hersey P, Kefford RF, Thompson JF, Yang YH, Scolyer RA. BRAF mutation, NRAS mutation, and the absence of an immune-related expressed gene profile predict poor outcome in patients with stage III melanoma. J Invest Dermatol. 2013;133(2):509–517. doi: 10.1038/jid.2012.283. [DOI] [PubMed] [Google Scholar]
- 10.Galon J, Angell HK, Bedognetti D, Marincola FM. The continuum of cancer immunosurveillance: prognostic, predictive, and mechanistic signatures. Immunity. 2013;39(1):11–26. doi: 10.1016/j.immuni.2013.07.008. [DOI] [PubMed] [Google Scholar]
- 11.Galon J, Costes A, Sanchez-Cabo F, Kirilovsky A, Mlecnik B, Lagorce-Pagès C, Tosolini M, Camus M, Berger A, Wind P, Zinzindohoué F, Bruneval P, Cugnenc PH, Trajanoski Z, Fridman WH, Pagès F. Type, density, and location of immune cells within human colorectal tumors predict clinical outcome. Science. 2006;313(5795):1960–1964. doi: 10.1126/science.1129139. [DOI] [PubMed] [Google Scholar]
- 12.Tosolini M, Kirilovsky A, Mlecnik B, Fredriksen T, Mauger S, Bindea G, Berger A, Bruneval P, Fridman WH, Pagès F, Galon J. Clinical impact of different classes of infiltrating T cytotoxic and helper cells (Th1, th2, treg, th17) in patients with colorectal cancer. Cancer Res. 2011;71(4):1263–1271. doi: 10.1158/0008-5472.can-10-2907. [DOI] [PubMed] [Google Scholar]
- 13.Verhaak RG, Tamayo P, Yang JY, Hubbard D, Zhang H, Creighton CJ, Fereday S, Lawrence M, Carter SL, Mermel CH, Kostic AD, Etemadmoghadam D, Saksena G, Cibulskis K, Duraisamy S, Levanon K, Sougnez C, Tsherniak A, Gomez S, Onofrio R, Gabriel S, Chin L, Zhang N, Spellman PT, Zhang Y, Akbani R, Hoadley KA, Kahn A, Köbel M, Huntsman D, Soslow RA, Defazio A, Birrer MJ, Gray JW, Weinstein JN, Bowtell DD, Drapkin R, Mesirov JP, Getz G, Levine DA, Meyerson M, Network CGAR Prognostically relevant gene signatures of high-grade serous ovarian carcinoma. J Clin Invest. 2013;123(1):517–525. doi: 10.1172/jci65833. [DOI] [PMC free article] [PubMed] [Google Scholar]
- 14.Liebner DA, Huang K, Parvin JD. MMAD: microarray microdissection with analysis of differences is a computational tool for deconvoluting cell type-specific contributions from tissue samples. Bioinformatics. 2014;30(5):682–689. doi: 10.1093/bioinformatics/btt566. [DOI] [PMC free article] [PubMed] [Google Scholar]
- 15.Zhong Y, Wan YW, Pang K, Chow LM, Liu Z. Digital sorting of complex tissues for cell type-specific gene expression profiles. BMC bioinformatics. 2013;14:89. doi: 10.1186/1471-2105-14-89. [DOI] [PMC free article] [PubMed] [Google Scholar]
- 16.Newman AM, Liu CL, Green MR, Gentles AJ, Feng W, Xu Y, Hoang CD, Diehn M, Alizadeh AA. Robust enumeration of cell subsets from tissue expression profiles. Nature methods. 2015;12(5):453–457. doi: 10.1038/nmeth.3337. [DOI] [PMC free article] [PubMed] [Google Scholar]
- 17.Newman AM, Alizadeh AA. High-throughput genomic profiling of tumor-infiltrating leukocytes. Curr Opin Immunol. 2016;41:77–84. doi: 10.1016/j.coi.2016.06.006. [DOI] [PMC free article] [PubMed] [Google Scholar]
- 18.Scholkopf B, Smola AJ, Williamson RC, Bartlett PL. New support vector algorithms. Neural computation. 2000;12(5):1207–1245. doi: 10.1162/089976600300015565. [DOI] [PubMed] [Google Scholar]
- 19.Corces MR, Buenrostro JD, Wu BJ, Greenside PG, Chan SM, Koenig JL, Snyder MP, Pritchard JK, Kundaje A, Gkeenleaf WJ, Majeti R, Chang HY. Lineage-specific and single-cell chromatin accessibility charts human hematopoiesis and leukemia evolution. Nat Genet. 2016;48(10):1193–1203. doi: 10.1038/ng.3646. [DOI] [PMC free article] [PubMed] [Google Scholar]
- 20.Linsley PS, Speake C, Whalen E, Chaussabel D. Copy Number Loss of the Interferon Gene Cluster in Melanomas Is Linked to Reduced T Cell Infiltrate and Poor Patient Prognosis. PloS one. 2014;9(10) doi: 10.1371/journal.pone.0109760. doi:Artn E10976010.1371/Journal.Pone.0109760. [DOI] [PMC free article] [PubMed] [Google Scholar]
- 21.Sleasman JW, Leon BH, Aleixo LF, Rojas M, Goodenow MM. Immunomagnetic selection of purified monocyte and lymphocyte populations from peripheral blood mononuclear cells following cryopreservation. Clinical and diagnostic laboratory immunology. 1997;4(6):653–658. doi: 10.1128/cdli.4.6.653-658.1997. [DOI] [PMC free article] [PubMed] [Google Scholar]
- 22.Fridman WH, Pages F, Sautes-Fridman C, Galon J. The immune contexture in human tumours: impact on clinical outcome. Nature Reviews Cancer. 2012;12(4):298–306. doi: 10.1038/nrc3245. [DOI] [PubMed] [Google Scholar]
- 23.Yoshihara K, Shahmoradgoli M, Martinez E, Vegesna R, Kim H, Torres-Garcia W, Trevino V, Shen H, Laird PW, Levine DA, Carter SL, Getz G, Stemke-Hale K, Mills GB, Verhaak RGW. Inferring tumour purity and stromal and immune cell admixture from expression data. Nat Commun. 2013;4 doi: 10.1038/ncomms3612. doi:Artn 2612 10.1038/Ncomms3612. [DOI] [PMC free article] [PubMed] [Google Scholar]