Abstract
Background:
Solitary pulmonary nodules (SPNs) are common imaging findings. Many studies have indicated that 18F-fluorodeoxyglucose positron emission tomography/computed tomography (18F-FDG-PET/CT) is an accurate test for distinguishing benign and malignant SPNs. The aim of this study was to investigate the value of 18F-FDG-PET/CT in the diagnosis of malignant SPNs.
Methods:
We systematically searched the PubMed and Embase databases up to March 2017, and published data on sensitivity, specificity, and other measures of diagnostic accuracy of 18F-FDG-PET/CT in the diagnosis of malignant SPNs were meta-analyzed. Statistical analyses were undertaken using Meta-DiSc 1.4 software and Stata version 12.0. The measures of accuracy of 18F-FDG-PET/CT in the diagnosis of malignant SPNs were pooled using random-effects models.
Results:
A total of 20 publications reporting 21 studies were identified. Pooled results indicated that 18F-FDG-PET/CT showed a diagnostic sensitivity of 0.89 (95% confidence interval [CI], 0.87–0.91) and a specificity of 0.70 (95% CI, 0.66–0.73). The positive likelihood ratio was 3.33 (95% CI, 2.35–4.71) and the negative likelihood ratio was 0.18 (95% CI, 0.13–0.25). The diagnostic odds ratio was 22.43 (95% CI, 12.55–40.07).
Conclusions:
18F-FDG-PET/CT showed insufficient sensitivity and specificity for diagnosing malignant SPNs; it cannot replace the “gold standard” pathology by resection or percutaneous biopsy. Larger studies are required for further evaluation.
Keywords: diagnosis, fluorodeoxyglucose, meta-analysis, PET/CT, solitary pulmonary nodules
1. Introduction
A solitary pulmonary nodule (SPN) is defined as a round or oval opacity lung lesion <3 cm in diameter and completely surrounded by pulmonary parenchyma, with no associated lymphadenopathy, atelectasis, or pneumonia.[1–3] SPNs are found approximately 0.2% to 2% in chest radiographs and approximately 10% to 40% in computed tomography (CT) scans,[4–7] and cancerous SPN has a reported incidence of 5% to 70%.[1,8] Thus, the early diagnosis of malignant SPNs is key for successful treatment. But the diagnosis of SPNs is a challenge to both clinicians and radiologists, due to the absence of symptoms, nonspecific morphology, and unknown probability of malignancy.[9] For suspicious malignant SPNs, transbronchial needle aspiration biopsy, percutaneous transthoracic biopsy, or video-assisted thoracoscopic surgery can provide “gold standard” histological information, but these are invasive and skill-dependent procedures.[10–12] Recently, 18F-fluorodeoxyglucose positron emission tomography/computed tomography (18F-FDG-PET/CT), a hybrid imaging combining CT and PET, has proved to be an accurate noninvasive imaging test for distinguishing benign and malignant SPNs.[2,13,14] Some studies have reported that 18F-FDG-PET/CT in SPN provides high diagnostic sensitivity (100%) and specificity (96%).[15] Other studies, however, have reported much lower corresponding values of 62% and 25%.[16,17] As the results are inconclusive, we meta-analyzed the available literature to examine the comprehensive status of the diagnostic utility of 18F-FDG-PET/CT in SPN. To the authors’ knowledge, this is the first meta-analysis to investigate the diagnostic usefulness of 18F-FDG-PET/CT in SPNs.
2. Materials and methods
2.1. Study selection
Two reviewers searched PubMed and Embase for meta-analyses related to the diagnostic accuracy of 18F-FDG-PET/CT in SPN, but no articles were found. Then, we identified eligible studies up to May 31, 2017. The following search terms were used: “PET/CT” OR “FDG-PET/CT” OR “18F-FDG-PET/CT” AND “SPN” OR “solitary pulmonary nodules” OR “lung lesion” AND “sensitivity” AND “specificity” AND “diagnosis.”
The included studies met the following criteria: patients with SPN were from outpatient or inpatient department; 18F-FDG-PET/CT imaging was performed in all patients; the number of patients and information about the sensitivity and specificity of 18F-FDG-PET/CT for the diagnosis of SPN was complete; there were clear diagnostic criteria and sizes of the nodule were provided; and the articles were written in English. Exclusion criteria included unpublished data, case reports, letters to the editor, abstracts, and review articles. All analyses were based on previously published studies; thus, no ethical approval and patient consent are required.
2.2. Data extraction and quality assessment
Two reviewers independently assessed study eligibility in accordance with the inclusion/exclusion criteria. In cases of disagreement, they consulted for resolution. The standard procedure was performed to extract data from the studies. The following information was collected: first author, country, year of publication, numbers of cases, sensitivity and specificity data, true positives, false positives, true negatives, false negatives, standard uptake value (SUVmax), nodule size, diagnosis standard, and the final histological diagnoses of the nodules. The methodological quality of the studies included in our meta-analysis was assessed using the Quality Assessment of Diagnostic Accuracy Studies (QUADAS-2) checklist, which is more detailed and rigorous than QUADAS, and the maximum score was 11.[18]
2.3. Statistical analyses
Standard recommended methods were used for the meta-analyses of the diagnostic test evaluations.[19] The data analyses were performed using Meta-DiSc software and STATA version 12.0. The following measures of test accuracy were computed to assess the accuracy of 18F-FDG-PET/CT for the diagnosis of SPN: sensitivity, specificity, positive likelihood ratio (PLR), negative likelihood ratio (NLR), and diagnostic odds ratio (DOR). The SROC curves were pooled to evaluate the overall diagnostic performance.[19,20] Random-effect modeling was performed to meta-analyze the diagnostic measures.[21,22] Heterogeneity of studies was evaluated using I2 and Fisher exact tests. A meta-regression analysis was conducted if significant heterogeneity existed among the included studies, and the following variables were used: SUVmax (2.5 vs −2.5), SPNs diagnosis standard (histology vs histology and follow-up), publication year (before 2010 vs after 2010), and methodological quality (≤9 vs >9). Deeks’ funnel plots were used to test for the potential presence of publication bias.[23]
3. Results
3.1. Study characteristics
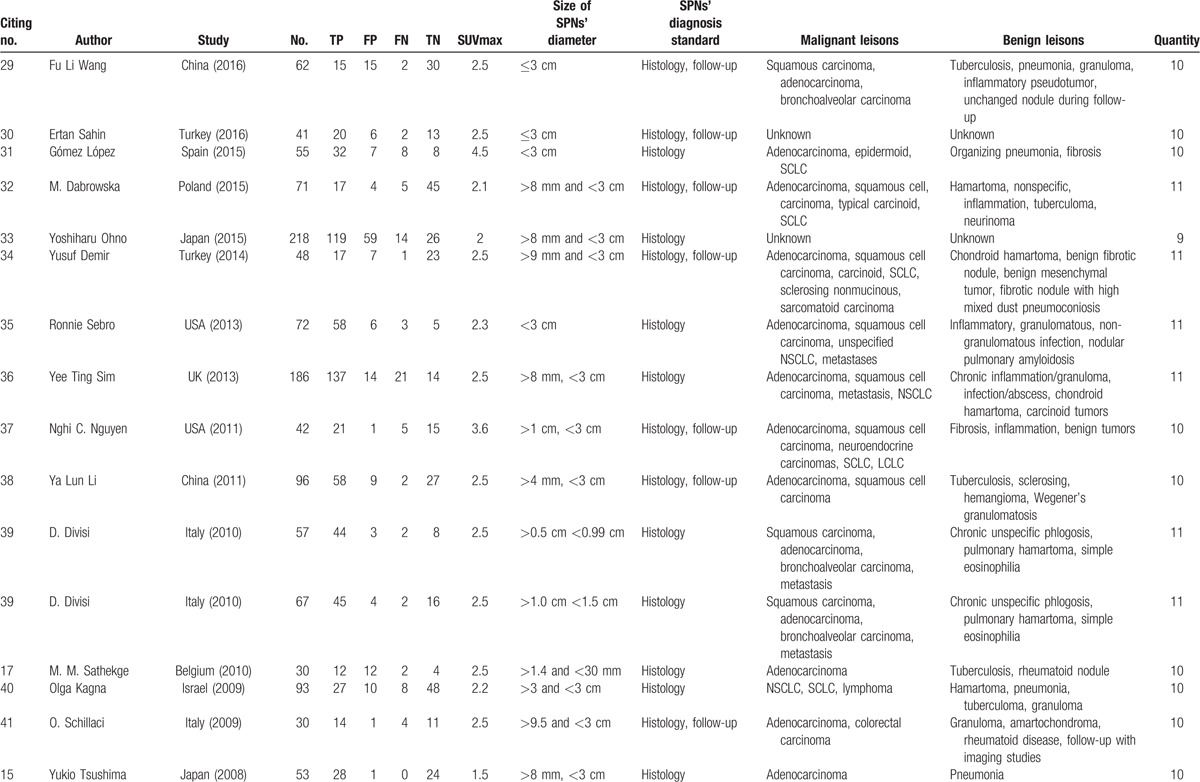
The initial literature searches and title review found 52 publications relevant to the search strategy; 27 were excluded based on abstract review. The remaining 25 articles were read in full, and 5 were excluded after the full text was read as they did not display sufficient data on nodule size.[24–28] Thus, 20 publications assessing the diagnostic performance of 18F-FDG-PET/CT in SPNs were included.[15–17,29–45] One study involved 2 study groups [39]; sufficient data were reported for each that they were treated as 2 independent studies. Finally, 21 studies from 20 publications were included. Characteristics of the selected studies are summarized in Table 1 . There were 1557 patients with SPNs, 918 malignant and 639 benign. SPNs were diagnosed based on histology in 12 studies[15–17,31,33,35,36,39,40,43–45]; in the remaining 9 studies, diagnosis was based on histology or follow-up. All the SPNs were <3 cm. The SUVmax was not exactly the same.
Table 1.
Characteristics of studies included in the meta-analysisa.
3.2. Meta-analysis results
Sensitivity for 18F-FDG-PET/CT in SPN diagnosis ranged from 0.62 to 1 in the 21 studies, and meta-analysis of sensitivity indicated a pooled sensitivity of 0.89 (95% confidence interval [CI], 0.87–0.91) (Fig. 1). Specificity ranged from 0.25 to 0.96, and pooled specificity was 0.70 (95% CI, 0.66–0.73) (Fig. 2). The PLR was 3.33 (95% CI, 2.35–4.71) (Fig. 3) and the NLR was 0.18 (95% CI, 0.13–0.25) (Fig. 4). The DOR was 22.42 (95% CI, 12.55–40.07) (Fig. 5).
Figure 1.
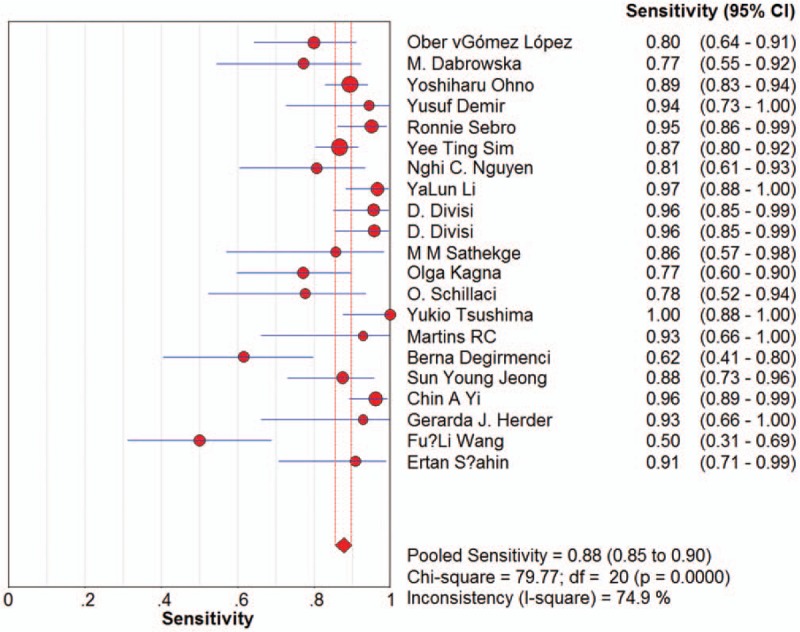
Forest plot of estimates of sensitivity for 18F-FDG-PET/CT in the diagnosis of malignant SPNs. Point estimates of sensitivity from each study are shown as solid circles, the size of which reflects the total number of cases and controls. Error bars show 95% confidence intervals. Numbers indicate the reference numbers of the studies.
Figure 2.
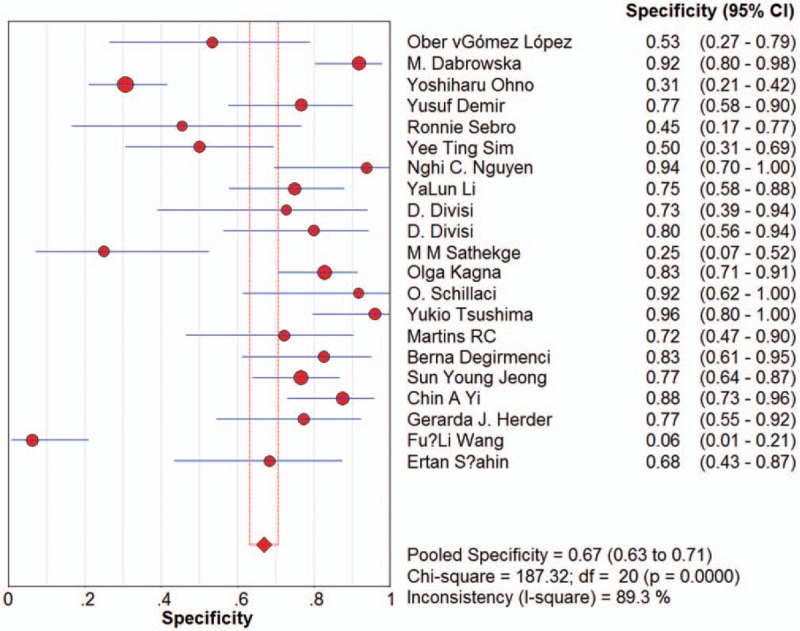
Forest plot of estimates of specificity for 18F-FDG-PET/CT in the diagnosis of malignant SPNs. Point estimates of specificity from each study are shown as solid circles, the size of which reflects the total number of cases and controls. Error bars show 95% confidence intervals. Numbers indicate the reference numbers of the studies.
Figure 3.
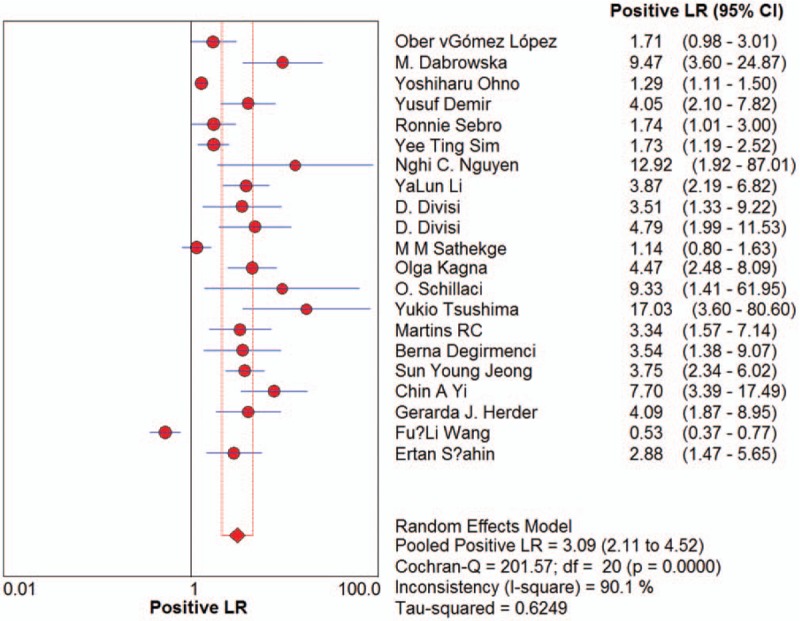
Forest plot of estimates of positive likelihood ratios for 18F-FDG-PET/CT in the diagnosis of malignant SPNs. Point estimates of the positive likelihood ratios from each study are shown as solid circles, the size of which reflects the total number of cases and controls. Error bars show 95% confidence intervals. Numbers indicate the reference numbers of studies.
Figure 4.
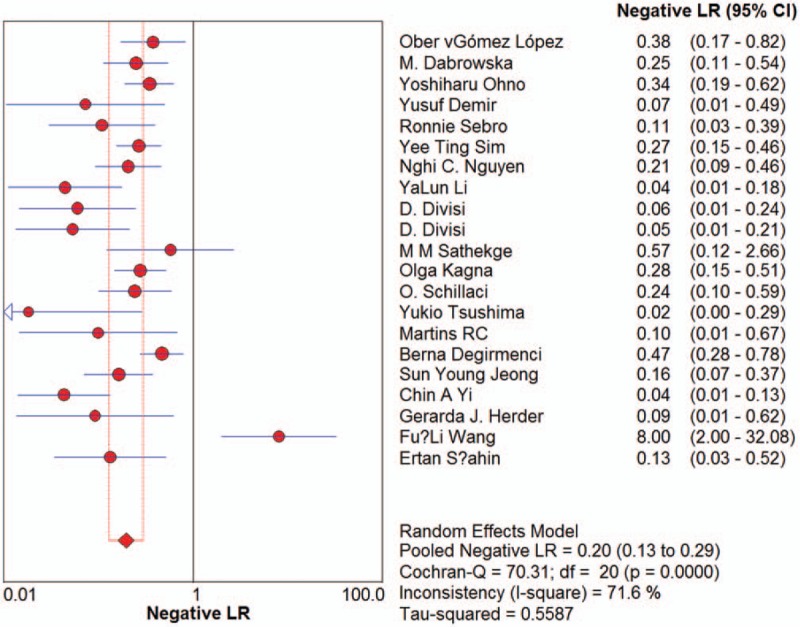
Forest plot of estimates of the negative likelihood ratios for 18F-FDG-PET/CT in the diagnosis of malignant SPNs. Point estimates of negative likelihood ratios from each study are shown as solid circles, the size of which reflects the total number of cases and controls. Error bars show 95% confidence intervals. Numbers indicate the reference numbers of the studies.
Figure 5.
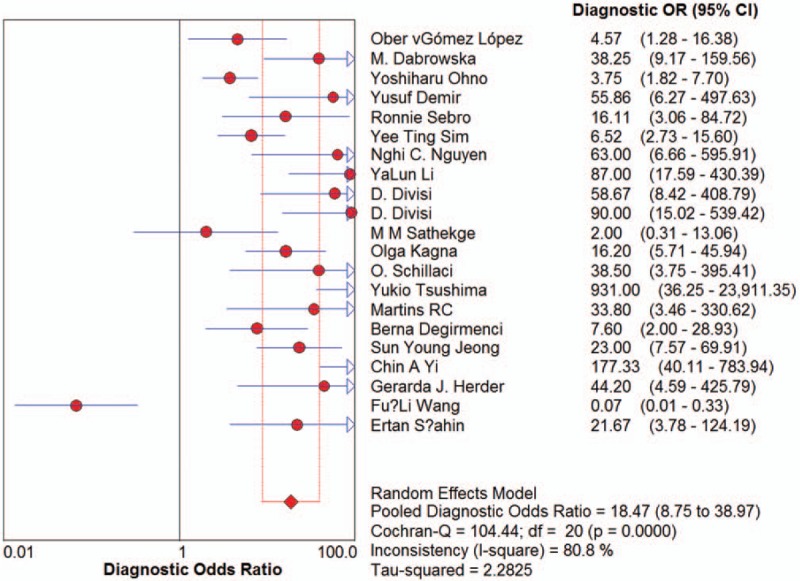
Forest plot of estimates of diagnostic odds ratios for 18F-FDG-PET/CT in the diagnosis of malignant SPNs. Point estimates of diagnostic odds ratios from each study are shown as solid circles, the size of which reflects the total number of cases and controls. Error bars show 95% confidence intervals. Numbers indicate the reference numbers of the studies.
Summary receiver-operating characteristic (SROC) curves were generated by plotting sensitivity against 1 specificity for individual studies. The maximum joint sensitivity and specificity was 0.89, with an area under the curve (AUC) of 0.9084 (SEM 0.0254) (Fig. 6).
Figure 6.
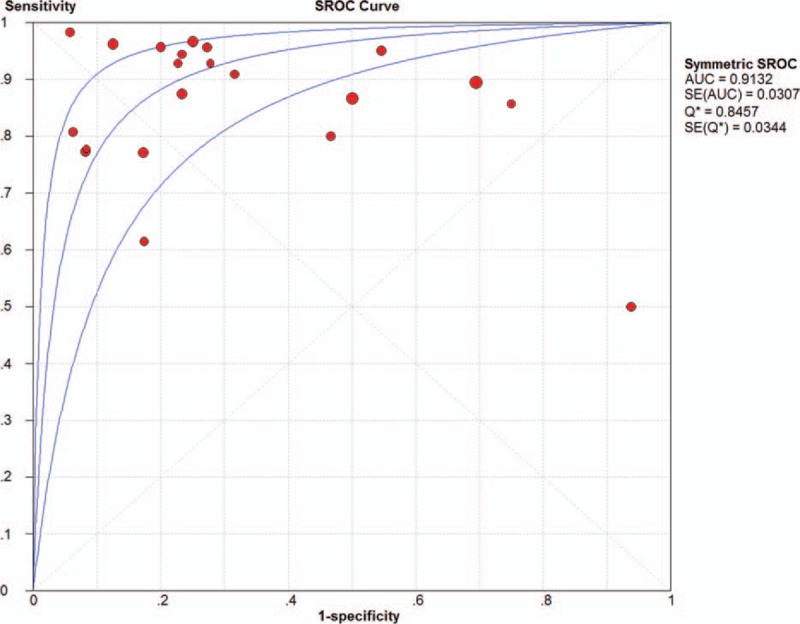
Summary receiver operating characteristic curves for 18F-FDG-PET/CT. Each study is depicted as a solid circle, the size of which reflects the total number of cases and controls.
3.3. Meta-regression analysis
I2 values for the pooled diagnostic performance parameters were high: 62.3% for sensitivity, 84.8% for specificity, 87.4% for PLR, 60.0% for NLR, and 67.4% for DOR (all P < .05), indicating significant heterogeneity. To identify possible reasons for this heterogeneity, we conducted a meta-regression to assess the effect of the study quality on the relative DOR (RDOR) of 18F-FDG-PET/CT for SPNs. The characteristics of the covariates are shown in Table 1 . Diagnostic accuracy was not significantly affected by the SUVmax value (P = .3399), SPN diagnosis standard (P = .2605), methodological quality (P = .3578), or publication year (P = .3707). The meta-regression results are shown in detail in Table 2.
Table 1 (Continued).
Characteristics of studies included in the meta-analysisa.

Table 2.
Meta-regression of the diagnostic accuracy of 18F-FDG-PET/CT.

3.4. Publication bias
Deeks test gave a P value of .26, suggesting that our analysis had no significant risk of publication bias (Fig. 7).
Figure 7.
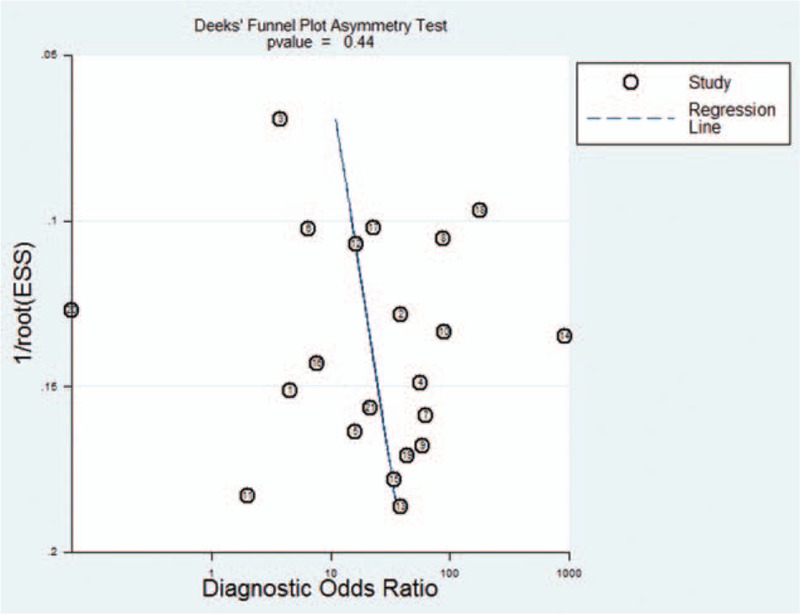
Funnel plot for evaluating publication bias among the 18 studies included in the meta-analysis. The log of the DOR is plotted against the standard error of the log DOR; the latter serves as an indicator of the sample size. Each article is shown as a solid circle, and the regression line is shown.
4. Discussion
SPNs are a common clinical problem. The histologies of SPNs can be benign tumors, infectious lesions, and lung cancer. The prevalence of lung cancer in SPNs is high, and the early identification of malignant nodules can help improve the chance of successful treatment. Transbronchial needle aspiration biopsy, percutaneous transthoracic biopsy, or video-assisted thoracoscopic surgery can provide histological information. But because these are invasive procedures depending on nodule diameter and position, and are skill-dependent, they have variable accuracy in lung cancer diagnosis. PET/CT with 18F-FDG is widely used in the diagnosis of SPNs. 18F-FDG-PET/CT can detect the presence of metabolically active tissue by quantifying the rate of cell glucose metabolism. Malignant nodules always have increased expression of the glucose transporter and elevated metabolic activity evidenced by a high FDG uptake.[46] But sometimes benign lesions also have increased metabolic activity such as infections, tuberculosis, and granulomatous disease.[1,47,48]
Our analysis suggests that 18F-FDG-PET/CT measurements alone are not sufficiently sensitive (0.89) and specific (0.70) to diagnose SPNs. Meta-analysis of the 21 included studies indicated a pooled DOR of 22.43 for 18F-FDG-PET/CT. The DOR is the ratio of the odds of 18F-FDG-PET/CT being positive in malignant SPNs relative to the odds of it being positive in benign SPNs. The SROC curve and the area underneath it present a trade-off between sensitivity and specificity.[49] Meta-analysis showed that the area under the SROC curve was 0.9084. These results indicate a relatively high accuracy. DOR and SROC curve analyses are difficult to interpret and use in clinical practice,[50] as the likelihood ratios are more clinically meaningful for measuring diagnostic accuracy.[50,51] The PLR value of 3.33 suggests that malignant SPNs have approximately 3-fold higher chance of being 18F-FDG-PET/CT positive compared with benign SPNs; this is insufficient to serve as the sole basis for diagnosing malignant SPNs. Concomitantly, the NLR was 0.18, meaning it had an 18% probability that the SPNs were malignant if the 18F-FDG-PET/CT was negative. There were both false positives and false negatives. The increased false positives were due to findings in areas with a high prevalence of tuberculosis and granulomatous disease, while false negatives occurred in small nodules, hyperglycemia, and tumors with low metabolic activity.[52] This also indicates that such a measurement is inadequate for ruling out malignant nodules on its own.
Heterogeneity among the included studies determined the reliability of meta-analyses; we found significant heterogeneity among the studies of our meta-analysis, so the results should be interpreted with caution. We checked the 21 studies carefully to find the possible factors that caused this heterogeneity. The analysis suggested SUVmax value differences and SPN diagnosis standards. The definite nature of the nodule was determined on the histologic findings and/or radiological follow-up. Concomitantly, the methodological quality and publication years varied among the included studies, but the meta-regression suggested that they did not affect the diagnostic performance of 18F-FDG-PET/CT. Therefore, the basis for the heterogeneity in our meta-analysis is unclear.
The pathologic analysis classified SPNs as malignant or benign. Among the malignant SPNs, the most prevalent histologies were adenocarcinoma, squamous cell carcinoma, and small cell lung cancer. Other histologies were found, such as lymphoma, non-Hodgkin's lymphoma, and epidermoid. In the benign SPNs, the most prevalent histologies were tuberculosis, pneumonia, and granuloma. The differences in histologies were significant, and they had obviously different 18F-fluorodeoxyglucose uptake. The studies varied in subject age and in stages of malignant SPNs. Benign SPNs in the control groups also were not at the same stage. These factors may have affected the diagnostic accuracy.
The meta-analysis had several limitations. First, only studies identified in a few databases were included, possibly leading to the exclusion of high-quality non-English research. Second, the SUVmax and size of the nodules in the studies were not exactly the same, leading to increased heterogeneity. Third, the pathological diagnoses of malignant nodules in the 19 studies did not the same type, for example, some malignant nodules were squamous carcinoma, some were adenocarcinoma or bronchoalveolar carcinoma, those would possibly leading to significant heterogeneity. In addition, other important factors contributed to the pooled result, such as past history and environmental exposure; these issues could not be precisely explained due to insufficient information.
Although PET-CT is and will continue to be a valuable noninvasive imaging tool for the diagnosis of SPNs, there remain many pitfalls in false-positive and false-negative lesions; it cannot replace the “gold standard” pathology of resection or percutaneous biopsy.
5. Author contributions
Conceptualization: Y.-L. Huang, Y. Huang, Y. Wang.
Data curation: Z.-Z. Li, Y.-L. Huang, H. Song.
Formal analysis: Z.-Z. Li, H. Song.
Funding acquisition: Y. Wang.
Investigation: Z.-Z. Li, Y. Huang.
Methodology: Z.-Z. Li, Y.-L. Huang, H. Song.
Project administration: Y. Huang, Y. Wang.
Resources: H. Song.
Software: H. Song.
Supervision: Y. Huang, Y. Wang.
Validation: Y. Wang.
Visualization: Y. Wang.
Writing – original draft: Z.-Z. Li.
Writing – review & editing: Y. Huang, Y. Wang.
Footnotes
Abbreviations: 18F-FDG-PET/CT = 18F-fluorodeoxyglucose positron emission tomography/computed tomography, AUC = area under the curve, DOR = diagnostic odds ratio, NLR = likelihood ratio, PLR = positive likelihood ratio, QUADAS = Quality Assessment of Diagnostic Accuracy Studies, SPNs = solitary pulmonary nodules, SROC = summary receiver operating characteristic, SUV = standard uptake value.
This study was supported by the Science and Technology Department of Sichuan Province (No. 2011SZ0198) and the National Key R&D Program of China (No. 2017YFC0907504).
The authors have no conflicts of interest to disclose.
References
- [1].Ost D, Fein AM, Feinsilver SH. Clinical practice. The solitary pulmonary nodule. N Eng J Med 2003;348:2535–42. [DOI] [PubMed] [Google Scholar]
- [2].Winer-Muram HT. The solitary pulmonary nodule. Radiology 2006;239:34–49. [DOI] [PubMed] [Google Scholar]
- [3].Leef JL, 3rd, Klein JS. The solitary pulmonary nodule. Radiol Clin North Am 2002;40:123–43. ix. [DOI] [PubMed] [Google Scholar]
- [4].Ost DE, Gould MK. Decision making in patients with pulmonary nodules. Am J Respir Crit Care Med 2012;185:363–72. [DOI] [PMC free article] [PubMed] [Google Scholar]
- [5].Dabrowska M, Kolasa A, Zukowska M, et al. [Analysis of solitary pulmonary nodules found in chest radiograms]. Pneumonol Alergol Pol 2009;77:37–42. [PubMed] [Google Scholar]
- [6].Aberle DR, DeMello S, Berg CD, et al. Results of the two incidence screenings in the National Lung Screening Trial. N Engl J Med 2013;369:920–31. [DOI] [PMC free article] [PubMed] [Google Scholar]
- [7].Midthun DE. Screening for lung cancer. Clin Chest Med 2011;32:659–68. [DOI] [PubMed] [Google Scholar]
- [8].Tang AW, Moss HA, Robertson RJ. The solitary pulmonary nodule. Eur J Radiol 2003;45:69–77. [DOI] [PubMed] [Google Scholar]
- [9].Pretreatment evaluation of non-small-cell lung cancer. The American Thoracic Society and The European Respiratory Society. Am J Respir Crit Care Med 1997;156:320–32. [DOI] [PubMed] [Google Scholar]
- [10].Wahidi MM, Govert JA, Goudar RK, et al. Evidence for the treatment of patients with pulmonary nodules: when is it lung cancer?: ACCP evidence-based clinical practice guidelines (2nd edition). Chest 2007;132:94S–107S. [DOI] [PubMed] [Google Scholar]
- [11].Bogot NR, Shaham D. Semi-invasive and invasive procedures for the diagnosis and staging of lung cancer. II. Bronchoscopic and surgical procedures. Radiol Clin North Am 2000;38:535–44. [DOI] [PubMed] [Google Scholar]
- [12].Gould MK, Donington J, Lynch WR, et al. Evaluation of individuals with pulmonary nodules: when is it lung cancer? Diagnosis and management of lung cancer, 3rd ed: American College of Chest Physicians evidence-based clinical practice guidelines. Chest 2013;143:e93S–120S. [DOI] [PMC free article] [PubMed] [Google Scholar]
- [13].Lillington GA. Management of solitary pulmonary nodules. Dis Mon 1991;37:271–318. [DOI] [PubMed] [Google Scholar]
- [14].Gould MK, Maclean CC, Kuschner WG, et al. Accuracy of positron emission tomography for diagnosis of pulmonary nodules and mass lesions: a meta-analysis. JAMA 2001;285:914–24. [DOI] [PubMed] [Google Scholar]
- [15].Tsushima Y, Tateishi U, Uno H, et al. Diagnostic performance of PET/CT in differentiation of malignant and benign non-solid solitary pulmonary nodules. Ann Nucl Med 2008;22:571–7. [DOI] [PubMed] [Google Scholar]
- [16].Degirmenci B, Wilson D, Laymon CM, et al. Standardized uptake value-based evaluations of solitary pulmonary nodules using F-18 fluorodeoxyglucose-PET/computed tomography. Nucl Med Commun 2008;29:614–22. [DOI] [PubMed] [Google Scholar]
- [17].Sathekge MM, Maes A, Pottel H, et al. Dual time-point FDG PET-CT for differentiating benign from malignant solitary pulmonary nodules in a TB endemic area. S Afr Med J 2010;100:598–601. [DOI] [PubMed] [Google Scholar]
- [18].Meads CA, Davenport CF. Quality assessment of diagnostic before-after studies: development of methodology in the context of a systematic review. BMC Med Res Methodol 2009;9:3. [DOI] [PMC free article] [PubMed] [Google Scholar]
- [19].Deville WL, Buntinx F, Bouter LM, et al. Conducting systematic reviews of diagnostic studies: didactic guidelines. BMC Med Res Methodol 2002;2:9. [DOI] [PMC free article] [PubMed] [Google Scholar]
- [20].Moses LE, Shapiro D, Littenberg B. Combining independent studies of a diagnostic test into a summary ROC curve: data-analytic approaches and some additional considerations. Stat Med 1993;12:1293–316. [DOI] [PubMed] [Google Scholar]
- [21].Irwig L, Tosteson AN, Gatsonis C, et al. Guidelines for meta-analyses evaluating diagnostic tests. Ann Intern Med 1994;120:667–76. [DOI] [PubMed] [Google Scholar]
- [22].Vamvakas EC. Meta-analyses of studies of the diagnostic accuracy of laboratory tests: a review of the concepts and methods. Arch Pathol Lab Med 1998;122:675–86. [PubMed] [Google Scholar]
- [23].Deeks JJ, Macaskill P, Irwig L. The performance of tests of publication bias and other sample size effects in systematic reviews of diagnostic test accuracy was assessed. J Clin Epidemiol 2005;58:882–93. [DOI] [PubMed] [Google Scholar]
- [24].Zhang J, Cui LB, Tang X, et al. DW MRI at 3.0 T versus FDG PET/CT for detection of malignant pulmonary tumors. Int J Cancer 2014;134:606–11. [DOI] [PubMed] [Google Scholar]
- [25].Evangelista L, Panunzio A, Polverosi R, et al. Indeterminate lung nodules in cancer patients: pretest probability of malignancy and the role of 18F-FDG PET/CT. AJR Am J Roentgenol 2014;202:507–14. [DOI] [PubMed] [Google Scholar]
- [26].Yang P, Xu XY, Liu XJ, et al. The value of delayed (18)F FDG-PET imaging in diagnosis of solitary pulmonary nodules: a preliminary study on 28 patients. Quant Imaging Med Surg 2011;1:31–4. [DOI] [PMC free article] [PubMed] [Google Scholar]
- [27].Li S, Zhao B, Wang X, et al. Overestimated value of (18)F-FDG PET/CT to diagnose pulmonary nodules: analysis of 298 patients. Clin Radiol 2014;69:e352–7. [DOI] [PubMed] [Google Scholar]
- [28].Chang CY, Tzao C, Lee SC, et al. Incremental value of integrated FDG-PET/CT in evaluating indeterminate solitary pulmonary nodule for malignancy. Mol Imaging Biol 2010;12:204–9. [DOI] [PubMed] [Google Scholar]
- [29].Wang F-L, Tan Y-Y, Gu X-M, et al. Comparison of Positron Emission Tomography Using 2-[18F]-fluoro-2-deoxy-D-glucose and 3-deoxy-3-[18 F]-fluorothymidine in Lung Cancer Imaging. Chin Med J 2016;129:2926–35. [DOI] [PMC free article] [PubMed] [Google Scholar]
- [30].Şahin E, Kara A, Elboğa U. Contribution of nonattenuation-corrected images on FDG-PET/CT in the assessment of solitary pulmonary nodules. Radiol Med 2016;121:944–9. [DOI] [PubMed] [Google Scholar]
- [31].van Gomez Lopez O, Garcia Vicente AM, Honguero Martinez AF, et al. (18)F-FDG-PET/CT in the assessment of pulmonary solitary nodules: comparison of different analysis methods and risk variables in the prediction of malignancy. Transl Lung Cancer Res 2015;4:228–35. [DOI] [PMC free article] [PubMed] [Google Scholar]
- [32].Dabrowska M, Krenke R, Korczynski P, et al. Diagnostic accuracy of contrast-enhanced computed tomography and positron emission tomography with 18-FDG in identifying malignant solitary pulmonary nodules. Medicine (Baltimore) 2015;94:e666. [DOI] [PMC free article] [PubMed] [Google Scholar]
- [33].Ohno Y, Nishio M, Koyama H, et al. Solitary pulmonary nodules: comparison of dynamic first-pass contrast-enhanced perfusion area-detector CT, dynamic first-pass contrast-enhanced MR imaging, and FDG PET/CT. Radiology 2015;274:563–75. [DOI] [PubMed] [Google Scholar]
- [34].Demir Y, Polack BD, Karaman C, et al. The diagnostic role of dual-phase (18)F-FDG PET/CT in the characterization of solitary pulmonary nodules. Nucl Med Commun 2014;35:260–7. [DOI] [PubMed] [Google Scholar]
- [35].Sebro R, Aparici CM, Hernandez-Pampaloni M, et al. evaluation of pathologically proven pulmonary lesions in an area of high endemic granulomatous disease. Ann Nucl Med 2013;27:400–5. [DOI] [PMC free article] [PubMed] [Google Scholar]
- [36].Sim YT, Goh YG, Dempsey MF, et al. PET-CT evaluation of solitary pulmonary nodules: correlation with maximum standardized uptake value and pathology. Lung 2013;191:625–32. [DOI] [PubMed] [Google Scholar]
- [37].Nguyen NC, Kaushik A, Wolverson MK, et al. Is there a common SUV threshold in oncological FDG PET/CT, at least for some common indications? A retrospective study. Acta Oncol 2011;50:670–7. [DOI] [PubMed] [Google Scholar]
- [38].Li Y, Su M, Li F, et al. The value of (18)F-FDG-PET/CT in the differential diagnosis of solitary pulmonary nodules in areas with a high incidence of tuberculosis. Ann Nucl Med 2011;25:804–11. [DOI] [PubMed] [Google Scholar]
- [39].Divisi D, Di Tommaso S, Di Leonardo G, et al. 18-fluorine fluorodeoxyglucose positron emission tomography with computerized tomography versus computerized tomography alone for the management of solitary lung nodules with diameters inferior to 1.5 cm. Thorac Cardiovasc Surg 2010;58:422–6. [DOI] [PubMed] [Google Scholar]
- [40].Kagna O, Solomonov A, Keidar Z, et al. The value of FDG-PET/CT in assessing single pulmonary nodules in patients at high risk of lung cancer. Eur J Nucl Med Mol Imaging 2009;36:997–1004. [DOI] [PubMed] [Google Scholar]
- [41].Schillaci O, Travascio L, Bolacchi F, et al. Accuracy of early and delayed FDG PET-CT and of contrast-enhanced CT in the evaluation of lung nodules: a preliminary study on 30 patients. Radiol Med 2009;114:890–906. [DOI] [PubMed] [Google Scholar]
- [42].Martins Rde C, Almeida SA, Siciliano AA, et al. [Value of [18F]-FDG-PET/CT as a predictor of cancer in solitary pulmonary nodule]. J Bras Pneumol 2008;34:473–80. [DOI] [PubMed] [Google Scholar]
- [43].Jeong SY, Lee KS, Shin KM, et al. Efficacy of PET/CT in the characterization of solid or partly solid solitary pulmonary nodules. Lung Cancer 2008;61:186–94. [DOI] [PubMed] [Google Scholar]
- [44].Yi CA, Lee KS, Kim BT, et al. Tissue characterization of solitary pulmonary nodule: comparative study between helical dynamic CT and integrated PET/CT. J Nucl Med 2006;47:443–50. [PubMed] [Google Scholar]
- [45].Herder GJ, Golding RP, Hoekstra OS, et al. The performance of(18)F-fluorodeoxyglucose positron emission tomography in small solitary pulmonary nodules. Eur J Nucl Med Mol Imaging 2004;31:1231–6. [DOI] [PubMed] [Google Scholar]
- [46].Mochizuki T, Tsukamoto E, Kuge Y, et al. FDG uptake and glucose transporter subtype expressions in experimental tumor and inflammation models. J Nucl Med 2001;42:1551–5. [PubMed] [Google Scholar]
- [47].Chen CJ, Lee BF, Yao WJ, et al. Dual-phase 18F-FDG PET in the diagnosis of pulmonary nodules with an initial standard uptake value less than 2.5. AJR Am J Roentgenol 2008;191:475–9. [DOI] [PubMed] [Google Scholar]
- [48].Huang YE, Lu HI, Liu FY, et al. Solitary pulmonary nodules differentiated by dynamic F-18 FDG PET in a region with high prevalence of granulomatous disease. J Radiat Res 2012;53:306–12. [DOI] [PubMed] [Google Scholar]
- [49].Liang QL, Shi HZ, Wang K, et al. Diagnostic accuracy of adenosine deaminase in tuberculous pleurisy: a meta-analysis. Respir Med 2008;102:744–54. [DOI] [PubMed] [Google Scholar]
- [50].Deeks JJ. Systematic reviews in health care: systematic reviews of evaluations of diagnostic and screening tests. BMJ 2001;323:157–62. [DOI] [PMC free article] [PubMed] [Google Scholar]
- [51].Hess EP, Thiruganasambandamoorthy V, Wells GA, et al. Diagnostic accuracy of clinical prediction rules to exclude acute coronary syndrome in the emergency department setting: a systematic review. CJEM 2008;10:373–82. [DOI] [PubMed] [Google Scholar]
- [52].Bar-Shalom R, Valdivia AY, Blaufox MD. PET imaging in oncology. Semin Nucl Med 2000;30:150–85. [DOI] [PubMed] [Google Scholar]


