Abstract
This study aimed to compare the efficacy of thromboelastography (TEG) and conventional coagulation methods in predicting hemorrhage risk in patients with leukemia.
A total of 226 patients diagnosed with leukemia were included and divided into bleeding and nonbleeding groups. All patients had their blood samples taken for TEG test to measure the reaction time (R time), alpha (α angle), and maximum amplitude (MA) as well as measure platelet count (PLT), prothrombin time, and activated partial thromboplastin time. Patients were followed up for bleeding episodes.
The multivariate analysis showed that PLT [odds ratio (OR) = 0.993] and MA (OR = 0.921) have better association with bleeding risk. Receiver operating characteristic (ROC) analysis showed that the combination of PLT and MA (AUC = 0.824) was better for hemorrhage risk prediction than PLT [area under the curve (AUC) = 0.730] and MA (AUC = 0.819) alone.
The combination of TEG and conventional coagulation methods could help in assessing the risk of hemorrhage in patients with leukemia.
Keywords: bleeding risk, leukemia, PLT, thromboelastography
1. Introduction
The presenting symptoms of leukemia include bruising or bleeding due to thrombocytopenia, pallor and fatigue from anemia, and infection caused by neutropenia. The profound symptom of coagulation changes, such as bleeding and thrombotic, remains a difficult clinical issue that prevent patients from surviving even in treatable leukemia.[1] Thus, patients should be monitored for signs and symptoms to prevent the occurrence of life-threatening bleeding. Therefore, to reduce the risk of bleeding episodes, physicians performed prophylactic platelet transfusions mainly based on the patients’ platelet count (PLT). However, there are still debates regarding the use of PLT as a criterion in making clinical decisions on bleeding in patients with leukemia. Several clinical trials have shown inconsistencies between PLC and bleeding episodes in patients.[2–8]
These studies all raised the question whether PLT is indeed the best indicator of platelet hemostatic function and if there are other accurate measures that clinicians can use to make decisions regarding prophylactic platelet transfusions. Conventional coagulation tests such as full platelet count (PLT), prothrombin time (PT), activated partial thromboplastin time (aPTT), and fibrinogen have been more evident that still have limitations. These tests are all based on a static end-point, reflecting coagulation indirectly, and were not designed for assessment of hemostatic integrity in the preoperative period and lacked accuracy sometimes.[9,10] Thromboelastography (TEG) provides integrated information on the balance between the 2 components of coagulation, thrombosis, and lysis, measuring the dynamic coagulation process from initial clotting cascade to clot strength.[11–13] This study aimed to assess the association between TEG and conventional coagulation tests. Here, we prospectively analyzed the association of TEG and conventional coagulation tests between 226 leukemia patients before and after chemotherapy and 328 healthy controls. In addition, we analyzed the association between TEG and conventional coagulation tests in the prediction of hemorrhage risk.
2. Materials and methods
This prospective observational pilot study was approved by the Ethics Committee of Zhejiang Provincial People's Hospital. A total of 226 patients admitted at Zhejiang Provincial People's Hospital and Zhejiang Provincial Hospital of TCM who were diagnosed with leukemia from January 2012 to January 2017 were enrolled in this study. All of them were inpatients in the hematology department. This study included 173 men and 53 women, with a median age of 44 years (range, 12–72 years). Patients with no clear diagnosis at the end of the study were excluded.
Moreover, patients with pre-existing bleeding tendencies, who were receiving anticoagulants or currently taking medication known to affect hemostasis, and/or who had active bleeding at the time of recruitment were excluded. All eligible patients had their blood samples taken for TEG test to measure the reaction time (R time), alpha (α angle), and maximum amplitude (MA) as well as measure PLT, PT, and aPTT. Patients were followed up for bleeding episodes. Bleeding was assessed by clinical physicians independent to the study.
Patients were divided into bleeding and nonbleeding groups based on the clinical signs and symptoms. The bleeding group consists of patients with a bleeding score of >0 according to the World Health Organization bleeding scale.[14]
2.1. Blood count and coagulation tests
All patients agreed to provide samples to conduct TEG assays, PLT, and coagulation tests. All samples were collected at the appropriate time and analyzed within 2 hours after collection. The citrated blood samples were tested and assayed using Sysmex XE5000 analyzer (Sysmex, Tokyo, Japan). Heparin-anticoagulated samples underwent chemistry tests and assayed using COBAS INTEGRA 800 biochemical analyzer (Roche, Basel, Switzerland). aPTTs and PTs were performed using the Sysmex CS2100i coagulometer with Innovin (Sysmex Europe GmbH, Norderstedt, Germany).
2.2. Thromboelastography
TEG was performed by trained biomedical scientists. Testing was performed on a citrate-treated blood samples and analyzed using a TEG 5000 thrombelastograph hemostasis system (Hemodyne, USA) within 5 minutes after blood collection. Briefly, 1 mL of citrated blood was added to a kaolin vial and mixed. A 340-μL aliquot of this mixture was then transferred to a 37° TEG cup with 20-μL 0.2 mol/L calcium chloride. The normal reference ranges of R, K, α-angle, and MA were 5 to 10 minutes, 1 to 3 minutes, 53° to 72°, and 50 to 70 mm, respectively.[15]
2.3. Statistics
A statistical analysis was performed for all biochemistry data. Student t test and χ2 test were used to assess intergroup differences. The Fisher exact test was used to assess categorical parameters. Two-sided P values of <.05 were considered statistically significant. A logistic regression model was used to predict associations. Receiver operating characteristic (ROC) curves were constructed to assess sensitivity and specificity according to the area under the curve (AUC) and 95% confidence intervals (95% CIs). All analyses were performed using SPSS for Windows, Version 19.0 (SPSS, USA).
3. Results
Among the 226 patients who were diagnosed with leukemia, 92 had acute lymphoblastic leukemia (ALL), 69 had acute myeloid leukemia (AML), 42 had chronic lymphocytic leukemia (CLL), and 23 had chronic myeloid leukemia (CML).
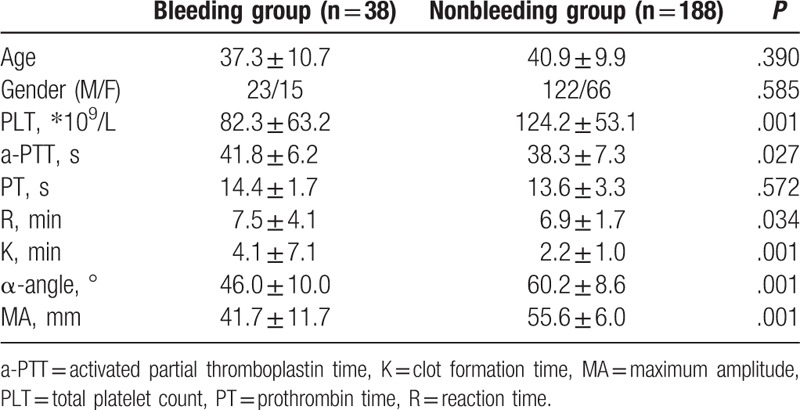
Among the 226 patients, 44 had clinical bleeding episodes; 38 had WHO grade 1 bleeding, including skin petechiae and ecchymosis (n = 33) and slight vaginal bleeding (n = 5); and 6 had WHO grade 2 bleeding, including epistaxis (n = 3), hemafecia (n = 1), hematuria (n = 1), and venipuncture bleeding (n = 1). All patients with bleeding episodes did not require transfusion of red blood cells. Here, we found the patients with bleeding to have lower PLT, α-angle, and MA values and higher reaction time and aPTT (P < .05) (Table 1), suggesting an underlying association with coagulation parameters.
Table 1.
Summary of platelet count, thromboelastography (TEG) parameters, and routine laboratory coagulation measures in leukemia patients with or without bleeding.
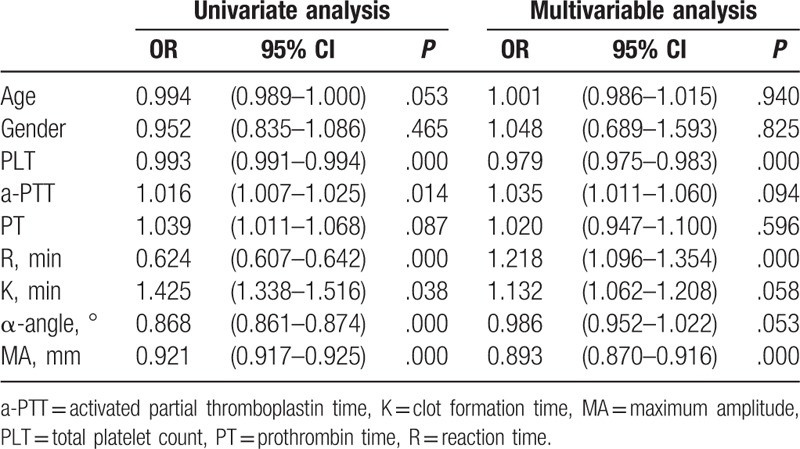
To identify the association between coagulation parameters and bleeding episodes, among the 3 parameters of conventional coagulation tests and 4 parameters of TEG tests, univariate and multivariate analyses were carried out to evaluate the association of bleeding risk among the 226 patients in this study. We found that PLT, aPTT, reaction time, K time, α-angle, and MA were all significantly associated with bleeding risks according to the results of the univariate analysis. However, only PLT, reaction time, and MA showed an association with bleeding risks according to the results of the multivariate analysis (Table 2).
Table 2.
Results of univariate and multivariable analysis of the influence factor on the bleeding risk in leukemia patients.
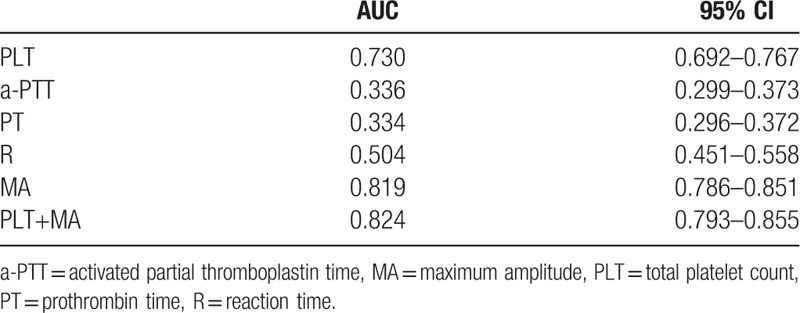
To identify the sensitivity and specificity of parameters in predicting bleeding risk, ROC curves were generated. For PLT and MA, the ROC curve showed an AUC of 0.730 (95% CI, 0.692–0.767) and 0.819 (95% CI, 0.786–0.851), respectively. For aPTT, PT, and reaction time, the ROC curve showed an AUC of 0.336 (95% CI, 0.299–0.373), 0.334 (95% CI, 0.296–0.372), and 0.504 (95% CI, 0.451–0.558), respectively. For accurate prediction, we combined PLT and MA, and the ROC curve showed a higher AUC of 0.824 (95% CI, 0.793–0.855) (Fig. 1, Table 3).
Figure 1.
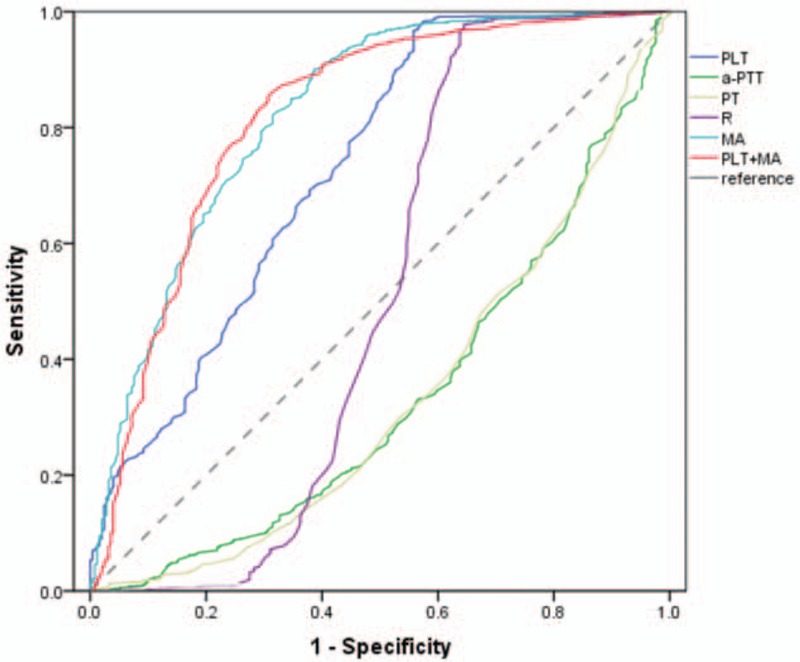
The predictive value of PLT, aPTT, PT, R, MA, and PLT+MA for bleeding risk assessed by ROC curve analysis in patients with leukemia. aPTT = activated partial thromboplastin time, MA = maximum amplitude, PLT = total platelet count, PT = prothrombin time, R = reaction time.
Table 3.
The predictive value of PLT, a-PTT, PT, R, MA, PLT+MA for bleeding risk assessed by ROC curve analysis in leukemia patients with leukemia.
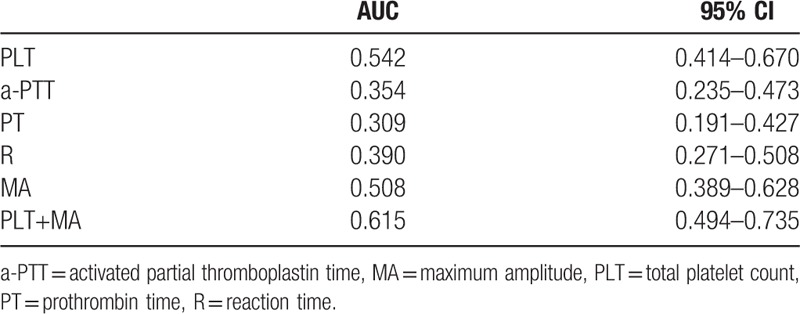
Approximately 30 of the 226 patients had a low PLT count (PLT < 20 ∗ 109/L). To identify the predictive value of bleeding episodes in patients with leukemia with low PLT count, the ROC curve was used for this subgroup. For PLT and MA, the ROC curve showed an AUC of 0.542 (95% CI, 0.414–0.670) and 0.508 (95% CI, 0.389–0.628), respectively. When PLT and MA were combined, ROC curve showed a slightly higher AUC of 0.615 (95% CI, 0.494–0.735) (Fig. 2, Table 4).
Figure 2.
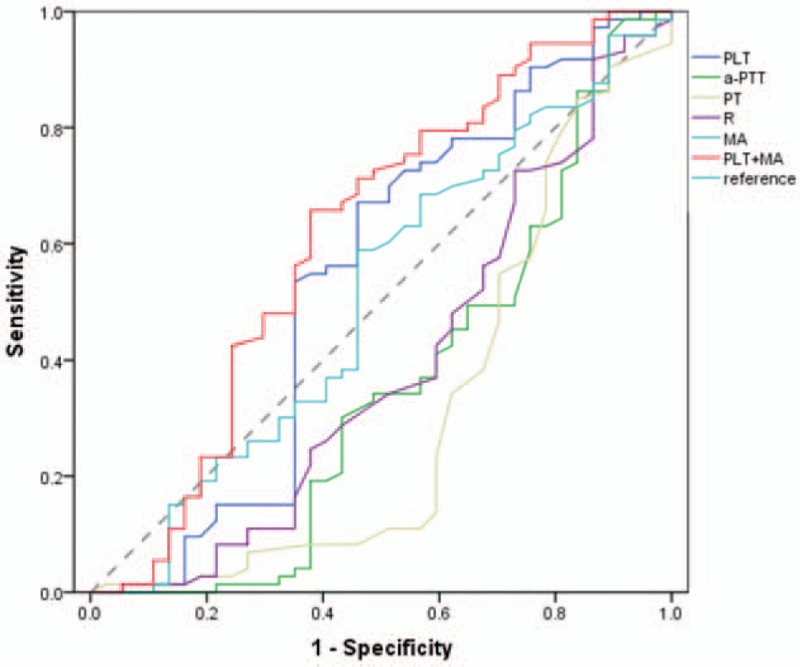
The predictive value of PLT, aPTT, PT, R, MA, and PLT+MA for bleeding risk assessed by ROC curve analysis in leukemia patients with platelet counts below 20 × 109/L. aPTT = activated partial thromboplastin time, MA = maximum amplitude, PLT = total platelet count, PT = prothrombin time, R = reaction time.
Table 4.
The predictive value of PLT, a-PTT, PT, R, MA, PLT+MA for bleeding risk assessed by ROC curve analysis in leukemia patients with platelet counts below 20∗109/L.
4. Discussion
This study aimed to evaluate the efficacy of TEG parameters against conventional hemostatic testing in predicting the clinical hemorrhage risks in patients with leukemia.
Severe bleeding is a predominant complication in patients with leukemia. The 5-year survival rate of patients with leukemia with abnormal coagulation function was lower than that of patients with normal coagulation function. The causes of bleeding include thrombocytopenia, platelet dysfunction, decreased coagulation factor, leukemia cell infiltration, and vascular injury.
Thrombocytopenia-related bleeding is a predominant cause of death in most patients with leukemia. Significant efforts were made to investigate the prognostic markers that can help identify the vulnerable patients, thus improving the treatment strategies. The univariate analysis showed that most of the parameters both in conventional hemostatic testing and TEG were significantly associated with bleeding risk (P < .05). However, the multivariate analysis showed that PLT and MA seemed to be the best parameters for bleeding risk prediction in patients with leukemia.
The cascade model of hemostasis is the base of conventional coagulation tests, which could only show a static evaluation of thrombus formation. TEG is based on the cell-based theory of hemostasis, which considers thrombus formation is a successive step, including initiation, amplification, propagation, and termination [10,13,16] Therefore, TEG has become an ideal monitoring tool for blood transfusion management in severe surgery, trauma, leukemia, and hemophilia. TEG parameters provide a rapid and accurate assessment of hemostatic function and prompt correction of coagulopathy. For example, MA refers to maximum clot strength, which is significantly associated with platelet function and fibrinogen.[17,18] In this study, we showed the strong correlation between PLT and MA, and both are good indicators for hemorrhage.
Early in 1962, a landmark study has shown the quantitative relation between platelet count and hemorrhage in patients with acute leukemia.[19] An analysis of 90 patients with acute promyelocytic leukemia also showed that low PLT count is correlated with death from bleeding.[2,20] For better guide prophylactic or therapeutic platelet components transfusion, many countries have published national guidelines to prevent bleeding or to stop active bleeding.[21,22] It has been in agreement that a threshold of total amount of platelet above 10 × 109/L in patients without other risk factors such as fever or coagulopathy is safe and accepted.[23] (British Committee for Standards in Haematology, Blood transfusion Task Force, 2003). However, the exact correlation of clinical bleeding and PLT count remains controversial. In addition, there is still lack of the study of the cutoff value of PLT number for bleeding risk prediction, especially considering the impact of platelet function. Here, we focused on the predication effects of TEG parameters in leukemia patients with lower platelet counts, which is below 20 × 109/L. Among the 14 patients with PLT ≤20 × 109/L, 12 (85.71%) had an elevated MA. Compared with all the patients (AUC = 0.819), MA had a lower correlation in predicting bleeding risks in patients with lower PLT (below 20 × 109/L) (AUC = 0.508). It was reported that MA had a high specificity but low sensitivity in predicting bleeding episodes in hematological patients with lower PLT.[15] However, the combination of PLT and MA had a synergistic effect on the prediction of bleeding risk, in low PLT count subgroup (AUC = 0.615), but not significantly in all the patients group (AUC = 0.824). These results indicated that TEG parameters, besides PLT, could reflect not only platelet number but also platelet function. Therefore, TEG parameters could be efficient guidelines in predicting hemorrhage and administering prophylactic platelet transfusions. With carefully monitoring TEG parameters, physicians could evaluate the severity of the bleeding risk, reduce the platelet transfusion demand, and reduce the risks associated with platelet transfusions in turn such as platelet refractoriness.
We believe that the new strategy that combines TEG and conventional coagulation tests can better evaluate hemostatic function and can guide the administration of platelet transfusions. Some limitations of this study were noted, including lacking fibrinogen and D-dimer levels. Therefore, further studies regarding prophylactic or therapeutic platelet transfusions based on conventional coagulation tests and TEG parameters are needed.
Author contributions
Investigation: H-X. Bao, J. Du.
Writing – review & editing: B-Y. Chen, Y. Wang.
Footnotes
Abbreviations: ALL = acute lymphoblastic leukemia, AML = acute myeloid leukemia, aPTT = activated partial thromboplastin time, CIs = confidence intervals, CLL = chronic lymphocytic leukemia, CML = chronic myeloid leukemia, MA = maximum amplitude, PLT = platelet, PT = prothrombin time, R time = reaction time, ROC = receiver operating characteristic, TEG = thromboelastography.
BYC and YW contributed equally to the work.
Funding/support: This study was supported by the Natural Science Foundation of Zhejiang Province (LY18C090004); the Science and Technology Planning Project of Zhejiang Province, China (2017C33197, LGF18H090009); and the National Natural Science Foundation (81371350, 31671071, 81570198, and 81571190); Medical and Health Science and Technology Project of Zhejiang Province (2018257543, 2018271239).
The authors report no conflicts of interest.
References
- [1].Colombo R, Gallipoli P, Castelli R. Thrombosis and hemostatic abnormalities in hematological malignancies. Clin Lymphoma Myeloma Leuk 2014;14:441–50. [DOI] [PubMed] [Google Scholar]
- [2].Slichter SJ, Kaufman RM, Assmann SF, et al. Dose of prophylactic platelet transfusions and prevention of hemorrhage. N Engl J Med 2010;362:600–13. [DOI] [PMC free article] [PubMed] [Google Scholar]
- [3].Bernstein SH, Nademanee AP, Vose JM, et al. A multicenter study of platelet recovery and utilization in patients after myeloablative therapy and hematopoietic stem cell transplantation. Blood 1998;91:3509–17. [PubMed] [Google Scholar]
- [4].Heckman KD, Weiner GJ, Davis CS, et al. Randomized study of prophylactic platelet transfusion threshold during induction therapy for adult acute leukemia: 10,000/microL versus 20,000/microL. J Clin Oncol 1997;15:1143–9. [DOI] [PubMed] [Google Scholar]
- [5].Rebulla P, Finazzi G, Marangoni F, et al. The threshold for prophylactic platelet transfusions in adults with acute myeloid leukemia. Gruppo Italiano Malattie Ematologiche Maligne dell’Adulto. N Engl J Med 1997;337:1870–5. [DOI] [PubMed] [Google Scholar]
- [6].Zumberg MS, del Rosario ML, Nejame CF, et al. A prospective randomized trial of prophylactic platelet transfusion and bleeding incidence in hematopoietic stem cell transplant recipients: 10,000/L versus 20,000/microL trigger. Biol Blood Marrow Transplant 2002;8:569–76. [DOI] [PubMed] [Google Scholar]
- [7].Diedrich B, Remberger M, Shanwell A, et al. A prospective randomized trial of a prophylactic platelet transfusion trigger of 10 x 10(9) per L versus 30 x 10(9) per L in allogeneic hematopoietic progenitor cell transplant recipients. Transfusion 2005;45:1064–72. [DOI] [PubMed] [Google Scholar]
- [8].Callow CR, Swindell R, Randall W, et al. The frequency of bleeding complications in patients with haematological malignancy following the introduction of a stringent prophylactic platelet transfusion policy. Br J Haematol 2002;118:677–82. [DOI] [PubMed] [Google Scholar]
- [9].Toulon P, Ozier Y, Ankri A, et al. Point-of-care versus central laboratory coagulation testing during haemorrhagic surgery. A multicenter study. Thromb Haemost 2009;101:394–401. [PubMed] [Google Scholar]
- [10].Holcomb JB, Minei KM, Scerbo ML, et al. Admission rapid thrombelastography can replace conventional coagulation tests in the emergency department: experience with 1974 consecutive trauma patients. Ann Surg 2012;256:476–86. [DOI] [PubMed] [Google Scholar]
- [11].Mallett SV, Cox DJ. Thrombelastography. Br J Anaesth 1992;69:307–13. [DOI] [PubMed] [Google Scholar]
- [12].Hurwich M, Zimmer D, Guerra E, et al. A case of successful thromboelastographic guided resuscitation after postpartum hemorrhage and cardiac arrest. J Extra Corpor Technol 2016;48:194–7. [PMC free article] [PubMed] [Google Scholar]
- [13].Walsh M, Fritz S, Hake D, et al. Targeted thromboelastographic (TEG) blood component and pharmacologic hemostatic therapy in traumatic and acquired coagulopathy. Curr Drug Targets 2016;17:954–70. [DOI] [PMC free article] [PubMed] [Google Scholar]
- [14].Slichter SJ. Evidence-based platelet transfusion guidelines. Hematology Am Soc Hematol Educ Program 2007;172–8. [DOI] [PubMed] [Google Scholar]
- [15].Xin X, Liu Z, Jian C, et al. The role of thromboelastography in predicting bleeding risk and guiding the administration of platelet transfusions in hematological patients: a cohort study. Ann Hematol 2016;95:1163–8. [DOI] [PubMed] [Google Scholar]
- [16].Hoffman M, Monroe DM. Coagulation 2006: a modern view of hemostasis. Hematol Oncol Clin North Am 2007;21:1–1. [DOI] [PubMed] [Google Scholar]
- [17].Sivula M, Pettila V, Niemi TT, et al. Thromboelastometry in patients with severe sepsis and disseminated intravascular coagulation. Blood Coagul Fibrinolysis 2009;20:419–26. [DOI] [PubMed] [Google Scholar]
- [18].Bowbrick VA, Mikhailidis DP, Stansby G. Influence of platelet count and activity on thromboelastography parameters. Platelets 2003;14:219–24. [DOI] [PubMed] [Google Scholar]
- [19].Gaydos LA, Freireich EJ, Mantel N. The quantitative relation between platelet count and hemorrhage in patients with acute leukemia. N Engl J Med 1962;266:905–9. [DOI] [PubMed] [Google Scholar]
- [20].Kim DY, Lee JH, Kim SD, et al. Significance of fibrinogen, D-dimer, and LDH levels in predicting the risk of bleeding in patients with acute promyelocytic leukemia. Leuk Res 2011;35:152–8. [DOI] [PubMed] [Google Scholar]
- [21].Liumbruno G, Bennardello F, Lattanzio A, et al. Recommendations for the transfusion of plasma and platelets. Blood Transfus 2009;7:132–50. [DOI] [PMC free article] [PubMed] [Google Scholar]
- [22].Slichter SJ. Platelet transfusion therapy. Hematol Oncol Clin North Am 2007;21:697–729. vii. [DOI] [PubMed] [Google Scholar]
- [23].Contreras M. Consensus conference on platelet transfusion: 27 and 28 November 1997: final statement. Leukemia 1998;12:1330–1. [DOI] [PubMed] [Google Scholar]


