Abstract
Hepatocytes are replenished gradually during homeostasis and robustly after liver injury1,2. In adults, new hepatocytes originate from the existing hepatocyte pool3-8, but the cellular source of renewing hepatocytes remains incompletely understood. Telomerase is expressed in many stem cell populations, and telomerase pathway gene mutations are linked to liver diseases9-11. Here, we identify a subset of hepatocytes that expresses high levels of telomerase and show that this hepatocyte subset repopulates the liver during homeostasis and injury. Using lineage tracing from the telomerase reverse transcriptase (Tert) locus in mice, we demonstrate that rare hepatocytes with high telomerase expression are distributed throughout the liver lobule. During homeostasis, these cells regenerate hepatocytes in all lobular zones, and both self-renew and differentiate to yield expanding hepatocyte clones that eventually dominate the liver. In injury responses, the repopulating activity of TERTHigh hepatocytes is accelerated and their progeny cross zonal boundaries. RNA-seq reveals that metabolic genes are down regulated in TERTHigh hepatocytes, indicating that metabolic activity and repopulating activity may be segregated within the hepatocyte lineage. Genetic ablation of TERTHigh hepatocytes combined with chemical injury causes a marked increase in stellate cell activation and fibrosis. These results provide support for a ‘distributed model’ of hepatocyte renewal in which a subset of hepatocytes dispersed throughout the lobule clonally expands to maintain liver mass.
He patocytes execute metabolic activities of the liver and exhibit functional heterogeneity along the axis within the lobule defined from the portal vein to the central vein12. At the extreme ends of this axis, pericentral Axin2+ hepatocytes repopulated the liver during normal homeostasis13, whereas periportal hepatocytes marked by Sox9 expression were inactive during homeostasis, but expanded with chronic chemical damage14. Observations indicating that proliferating hepatocytes are located throughout the lobule15,16 suggest additional sources of repopulating hepatocytes. Telomerase synthesizes telomere repeats, and has been linked to long-term renewal in stem cells and in cancers17. Germline inactivating mutations in telomerase genes predispose to cirrhosis in people9,10 and in mice11, while activating mutations in the TERT promoter represent the most recurrent mutations in hepatocellular carcinoma18. Given the important roles of telomerase in liver disease, and observations that telomerase is found in stem cell compartments in multiple adult tissues19-22, we hypothesized that telomerase may be expressed in liver cells with unique properties.
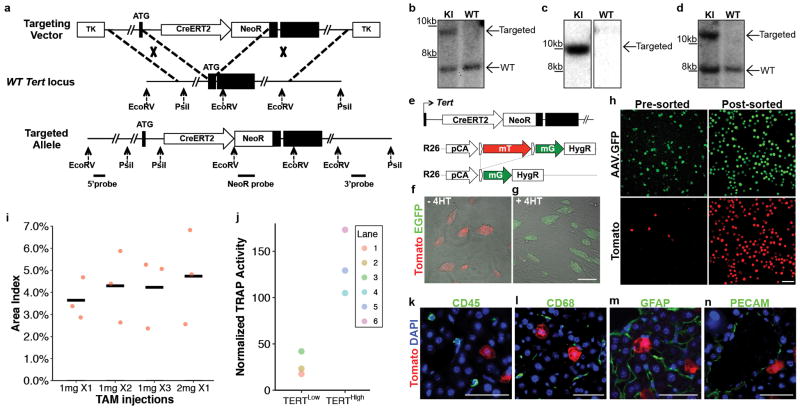
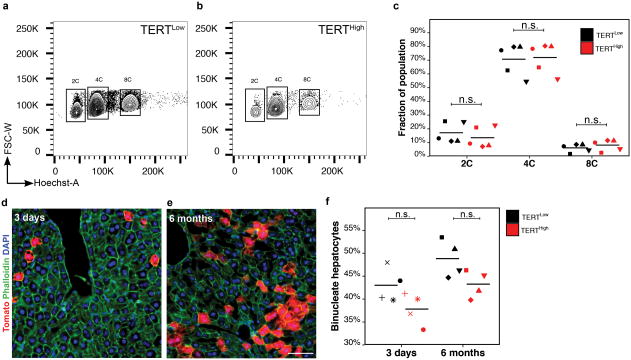
To reveal telomerase-expressing cells in vivo, we engineered a mouse strain expressing the inducible CreERT2 recombinase from the endogenous Tert locus (Extended Data Fig. 1a-d). Treatment of TertCreERT2/+ knock-in mouse ES cells in culture with 4-hydroxy tamoxifen resulted in efficient recombination of a fluorescent reporter (Extended Data Fig.1e-g). To study the adult liver, we intercrossedTertCreERT2/+ mice and a Rosa26LSL-Tomato/+ reporter strain that enables permanent cell labelling by deletion of a transcriptional stop element flanked by loxP sites and concomitant expression of fluorescent Tomato protein. TertCreERT2/+; Rosa26LSL-Tomato/+ mice were injected with a near-saturating dose of tamoxifen (1mg/10g body weight)(Extended Data Fig.1i), and analyzed three days later (Fig. 1a). We found that a subset of cells throughout the liver expressed Tomato and the hepatocyte marker HNF4A (Fig. 1b). Tomato expression in other liver cell types was not detected (Extended Data Fig. 1k-n). To isolate these TERTHigh hepatocytes by fluorescence-activated cell sorting (FACS) (Gating strategy, Supplementary Information), we labeled all hepatocytes with an adeno-associated virus expressing hepatocyte-specific GFP (AAV.GFP)23 (Figure 1c and Extended Data Fig. 1h). We found that all Tomato+ cells were also GFP+, typically representing 3-5% of all hepatocytes from 2-month old mice (Fig. 1d). Telomeric repeat amplification protocol (TRAP) showed a 5-fold increase of telomerase activity in the TERTHigh population (GFP+Tomato+) compared with the TERTLow population (GFP+Tomato-) (Fig. 1e and Extended Data Fig. 1j; gel source, Supplementary Figure 1). Quantitative reverse transcription PCR showed 12.9-fold more Tert mRNA in the TERTHigh population than in the bulk TERTLow hepatocyte population (Fig. 1f, g). Both populations were comprised of a similar distribution of diploid and polyploid cells (Extended Data Fig. 2). These data show that Tert mRNA and telomerase activity are elevated in TERTHigh hepatocytes.
Figure 1. Identification of a hepatocyte subpopulation with elevated Tert and telomerase activity.
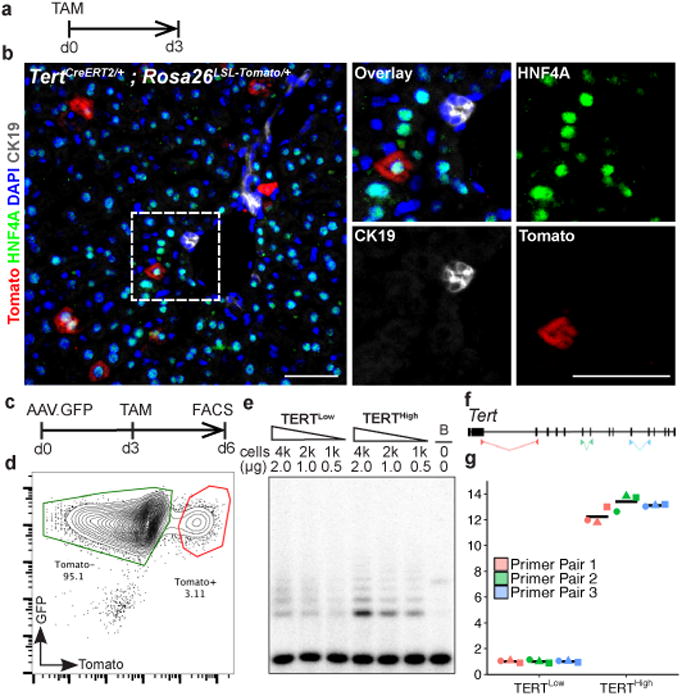
a-b, Immunofluorescence (IF) analysis on TertCreERT2/+; Rosa26LSL-Tomato/+ liverstreated with single-dose of tamoxifen and analysed 3 days post injection. Tomato (red), HNF4A (green), CK19 (white), and DAPI (blue) shown. c-g, Analysis of telomerase expression in FACS-sorted hepatocytes. Representative FACS plot (d), TRAP assay (e, B: Buffer only) and quantitative reverse-transcription PCR(f, position of primer pairs) (g, fold-changes.n = 3 mice, each indicated by unique dot shapes; cross-bar: mean) shown. Experiments repeated three times for b, more than five times for d, and twice for e and g. Scale bars, 50 μm.
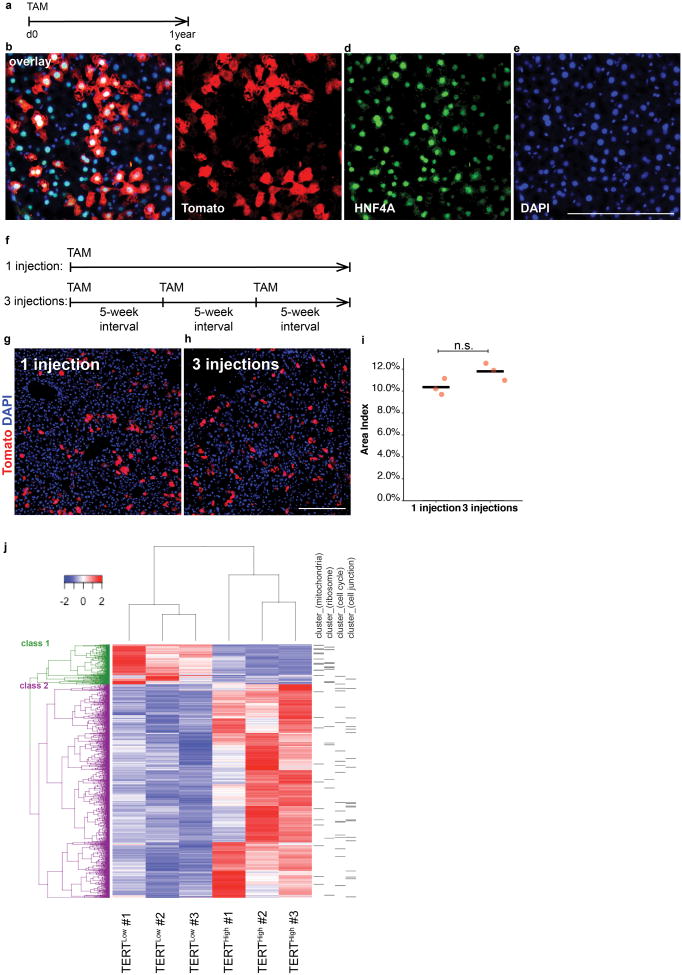
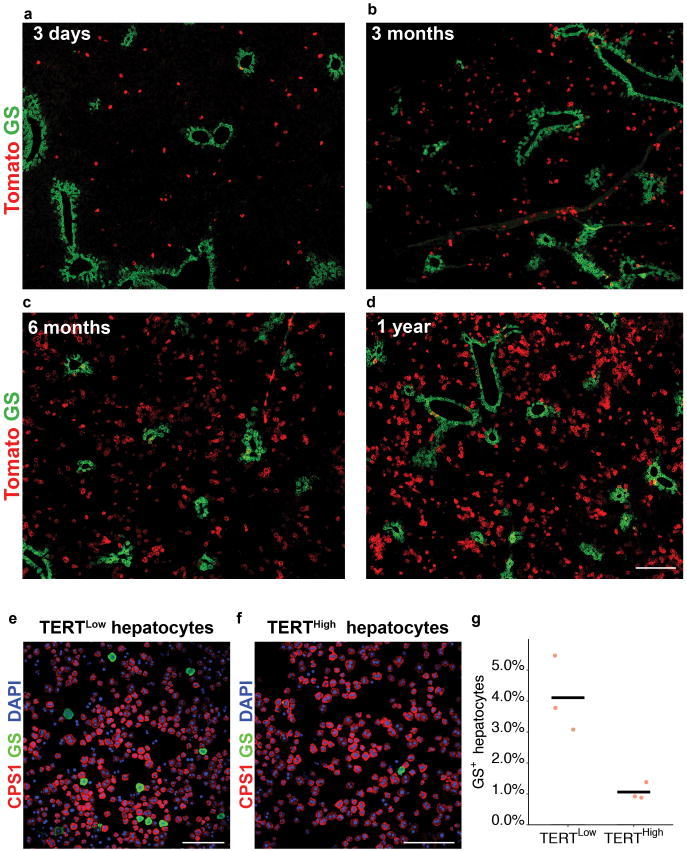
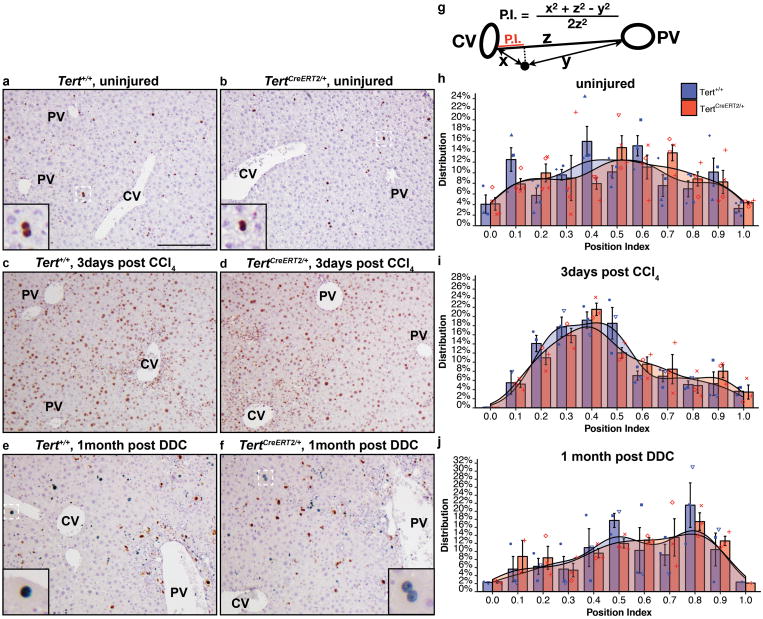
To determine whether TERTHigh hepatocytes repopulate the liver during homeostasis, we performed lineage tracing by injecting two-month old TertCreERT2/+; Rosa26LSL-Tomato/+ mice with a single dose of tamoxifen (1 mg/10 g) and aged these animals for up to one year (Fig. 2a). TERTHigh hepatocytes represented 2.8±0.4% three days after tamoxifen, but the Tomato+ progeny of these cells increased progressively during the tracing period to comprise 29.9±2.4% of liver area at one year (Fig. 2b-h). All Tomato+ cells remained HNF4A+ hepatocytes after tracing for one-year (Extended Data Fig. 3a-e) and Tomato+ cells were undetected in mice treated with oil vehicle (Fig. 2i). A single tamoxifen injection generated a similar number of Tomato+ hepatocytes as three injections administered at 5-week intervals over the same tracing period (Extended Data Fig. 3f-i), indicating that elevated Tert promoter activity is an intrinsic feature of cell identity. Co-staining sections from this lineage tracing time course series for Tomato and the pericentral zone marker glutamine synthetase (GS)12 showed that TERTHigh hepatocytes were distributed throughout all lobular zones. The vast majority of TERTHigh hepatocytes were located in the periportal and midlobular zones (3-day trace), and the progeny from these cells expanded markedly to replenish hepatocytes in these zones. Within the pericentralzone, the TERTHigh lineage comprised 1.8±0.3% at three days (Fig. 2j), but increased overtime (8.2±0.5% at 6 months, and 12.7±0.9% at 1 year, Fig. 2k-m and Extended Data Fig.4). Analysis of proliferating hepatocyte position by Ki-67 immunostaining revealed that Ki-67+ hepatocytes were dispersed throughout all lobular zones in both wild-type and TertCreERT2/+ mice, matching the distributed pattern of TERTHigh hepatocytes (Extended Data Fig. 5a, b, h). These data show that rare TERTHigh hepatocytes drive a marked and progressive repopulation of the hepatocyte lineage throughout the lobule during normal homeostasis.
Figure 2. TERTHigh hepatocytes repopulate the liver in homeostasis and show downregulation of metabolic genes.
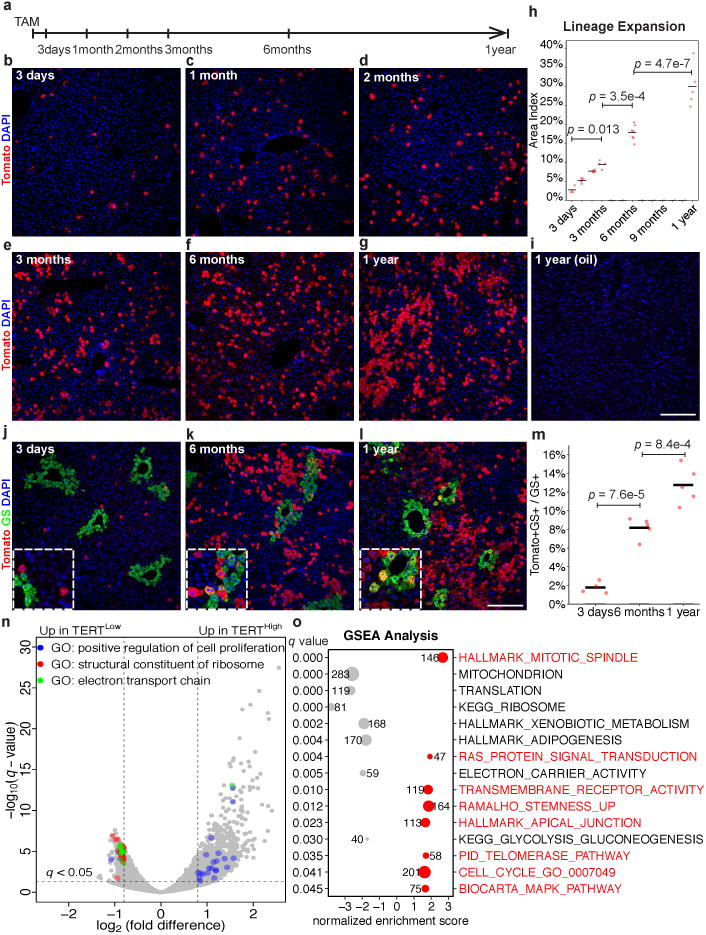
a-i, Lineage tracing in TertCreERT2/+; Rosa26LSL-Tomato/+ micetreated with single-dose tamoxifen (b-g) or oil vehicle (i) and analysed at indicated tracing periods by IF for Tomato. Quantification of Tomato+hepatocyte area (h, n = 4, 5, 4, 4, 7, 5 mice for each time-point;cross-bar: mean). j-m, Co-IF for Tomato and GS inTertCreERT2/+; Rosa26LSL-Tomato/+ micetraced for 3 days, 6 months or one year.Quantification of Tomato+GS+ fraction of GS+ hepatocytes (m, n = 4, 5, 5 mice for each time-point; cross-bars, mean). n-o, RNA-seq results on FACS-purified TERTHigh (Tomato+) or TERTLow (Tomato-) hepatocytes (n = 3 mice for each group). Volcano plot for enriched genes and GO terms (n,cut-offs:q< 0.05, |log2(fold difference)|> 0.8). GSEA analysis for enriched gene-sets (o, number of genes shown for each gene set). Experiments repeated twice for time-points in b,f,g,j-l. Scale bars, 100 μm.
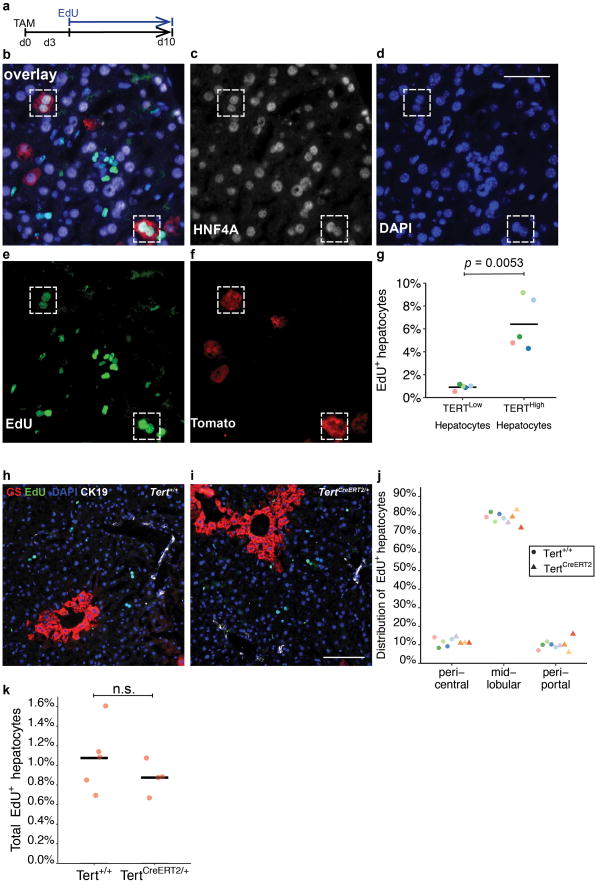
To understand how TERTHigh cells differ from bulk hepatocytes, we performed RNA-seq on TERTHigh and TERTLow hepatocytes isolated by FACS from three TertCreERT2/+; Rosa26LSL-Tomato/+ mice three days after tamoxifen treatment. RNA-seq showed 3,172 genes differentially expressed between the two populations (q<0.05, Fig. 2n)(Extended Data Fig. 3j). Gene ontology (GO) analysis (Fig. 2n) and Database for Annotation, Visualization and Integrated Discovery (DAVID, Extended Data Fig. 3j) showed that cell cycle genes were upregulated in the TERTHigh population, while ribosomal genes and mitochondrial genes were upregulated in the TERTLow population. Gene Set Enrichment Analysis (GSEA) revealed increased representation of gene sets associated with cell division and receptor tyrosine kinase activity in the TERTHigh population (Fig. 2o, red), and decreased representation of gene sets associated with ribosome components, mitochondrial proteins, electron transport chain genes and hepatocyte metabolic activities (Fig. 2o, grey). Proliferation inTERTHigh hepatocytes was elevated compared with TERTLow hepatocytes (6.4±1.0% vs. 0.9±0.1%) by 5-ethynyl-2′-deoxyuridine (EdU) incorporation (7-day drinking water, Extended Data Fig. 6). Together, these data suggest that TERTHigh hepatocytes are less invested in the metabolic and synthetic functions of bulk hepatocytes, and more dedicated to proliferation and homeostatic renewal.
To characterize the behaviour of single TERTHigh hepatocytes and their progeny through clonal analysis and sparse labelling, we injected TertCreERT2/+; Rosa26LSL-Tomato/+ mice with a lower dose of tamoxifen (0.08mg Tam/10g body weight), and traced for 3 days, 3 months and 6 months (Fig. 3a). Confocal microscopy was performed on thick tissue sections followed by three-dimensional reconstruction (Fig. 3b). The average clone size increased progressively from single-cells at 3-days, to 2.1±0.2 cells at 3-months, and 4.2±0.4 cells at 6-months (Fig. 3c). Average clonal density did not change, indicating no significant loss of TERTHigh hepatocyte clones over the 6-month trace (Fig. 3d). The irregular shape of these clones matches the anatomical organization of hepatocytes within hepatic cords24. Co-staining 6-month trace samples with antibodies to GS revealed that the vast majority of clones resided outside the GS+ zone (Fig. 3e and red bars in Fig. 3h), and a subset of these bordered the GS+ pericentral zone (Fig. 3f and green bars in Fig. 3h). We also found occasional clones comprised of a mixture of GS+ and GS- cells (Fig. 3g and blue bars in Fig. 3h). The “cross-zone” clones derive from TERTHigh hepatocytes but are comprised of cells with two distinct zonal fates. These clonal studies matched the findings on homeostatic expansion of the TERTHigh lineage (Fig. 2), and further supported the function of TERTHigh hepatocytes as a key source of hepatocyte renewal.
Figure 3. TERTHigh hepatocytes drive clonal expansion by a self-renewal mechanism.
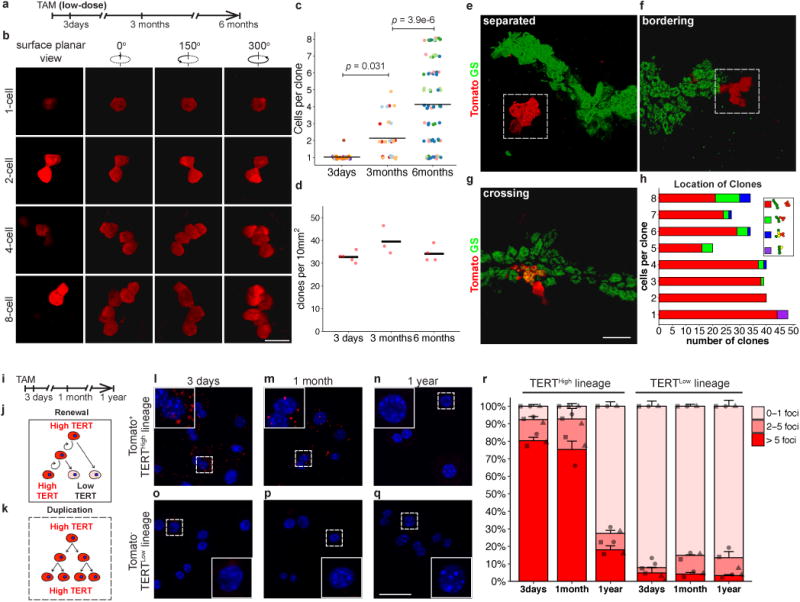
a-h, 3D analysis of sparse-labelled hepatocyte clones in TertCreERT2/+; Rosa26LSL-Tomato/+ mice treated with low-dose tamoxifen, traced for 3 days, 3 months or 6 months. Clone-sizes (b,c) and clone-number per volume (d) (n = 5, 3, and 4 mice, respectively; each mouse represented by unique dot-colour in c; cross-bar: mean). Co-IF for Tomato and GS to assess clone-location in 6-month trace samples (e-h). Quantification of clone size and position relative to GS+ cells (h).i-r, Single-molecule RNA FISH on FACS-purified TERTHigh derived (l-n) and TERTLow derived (o-q) hepatocytes. Quantification by foci counts (r, n = 3 mice per time-point, each mouse indicated by unique dot-shapes. Bars and error-bars are mean+SEM. For cells with >5 foci, p1month-3days = 0.56, p1year-3days = 2.7e-5, p1year-1month = 4.3e-5). Experiments repeated twice. Scale bars, 50 μm.
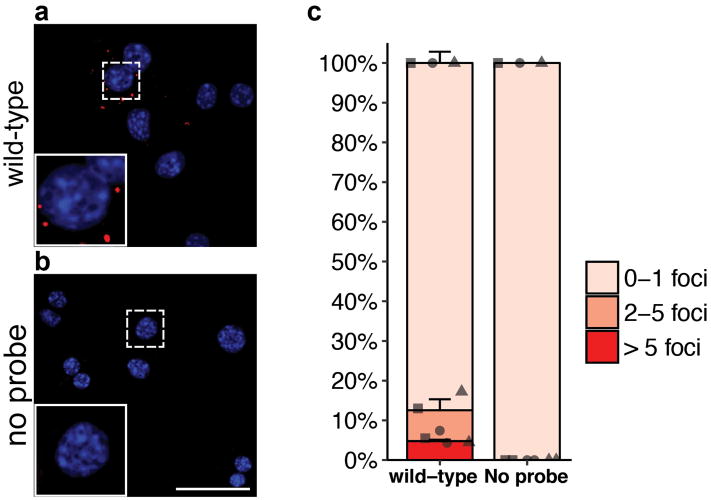
TERTHigh hepatocytes could generate clones either by a self-renewal mechanism, in which the initial cell remains TERTHigh and the progeny are TERTLow (Fig. 3j), or a simple duplication mechanism, in which all daughter cells remain TERTHigh (Fig. 3k). To distinguish these mechanisms, we examined Tert mRNA with single-molecule RNA FISH on sorted Tomato+ and Tomato- hepatocytes from different tracing periods (Fig. 3i,l-r), as well as wild-type hepatocytes (Extended Data Fig. 7). We found that the percentage of Tomato+ cells with high Tert mRNA (>5 mRNA foci) was comparable at three days and one month (80.3±2.0% vs. 75.3±4.8%), but decreased to 18.0±2.2% after one year. Tomato- cells remained TERTLow, regardless of the tracing periods. The presence of rare cells in this fraction with high Tert mRNA likely indicates incomplete recombination with CreERT2. These studies indicate that the TERTHigh subpopulation both self-renews to replenish the TERTHigh cells, and differentiates to yield TERTLow daughter cells.
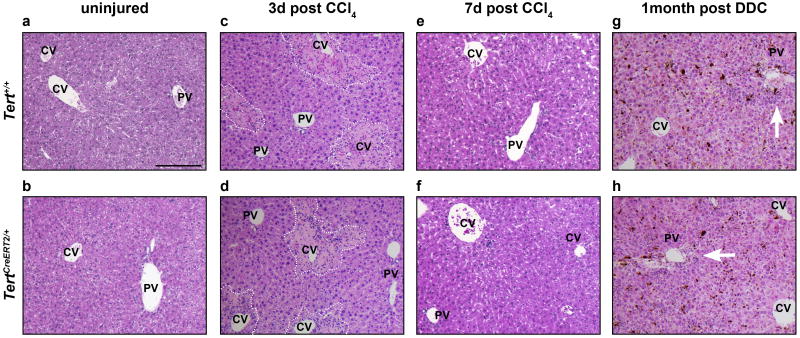
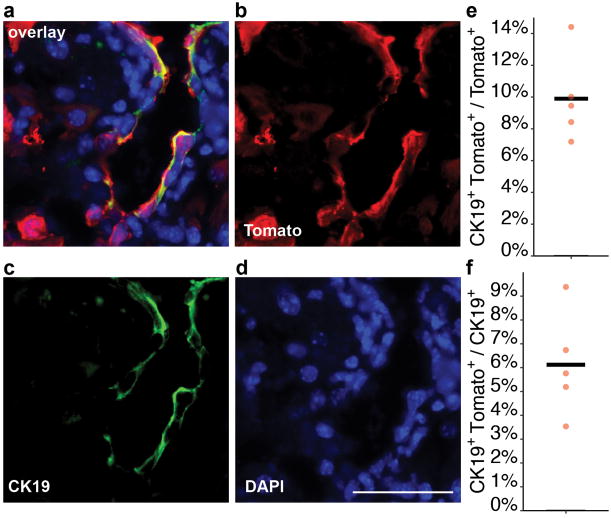
To understand the ability of TERTHigh hepatocytes to replenish cells damaged in the pericentral zone, we eliminated pericentral hepatocytes by single-dose carbon tetrachloride (CCl4) injection25 (Extended Data Fig. 8c-f). Although TERTHigh hepatocytes are rare within the GS+ pericentral zone, there was a marked increase in the number of GS+ Tomato+ cells at seven days after injury (Fig. 4a-f). These data indicate that injury to pericentral hepatocytes activates nearby TERTHigh hepatocytes, and that their progeny assumes a new zonal identity in healing pericentral wounds. To understand whether TERTHigh hepatocytes contribute to hepatocyte regeneration after global injury, we challenged the livers with 0.1% 3,5-diethoxycarbonyl-1,4-dihydrocollidine (DDC) diet (Fig. 4g and Extended Data Fig. 8g, h). We found a significant expansion of Tomato+ hepatocytes after one month DDC-diet (38.0±3.2% vs. 5.6±0.3% in control livers) (Fig. 4g-j). Some progeny of TERTHigh cells adopted a ductal fate (Extended Data Fig. 9), consistent with known hepatocyte plasticity in DDC injury26. These findings reveal that TERTHigh hepatocytes repopulate hepatocytes at an accelerated rate in the setting of chemical injury.
Figure 4. TERTHigh hepatocytes are critical in liver regeneration.
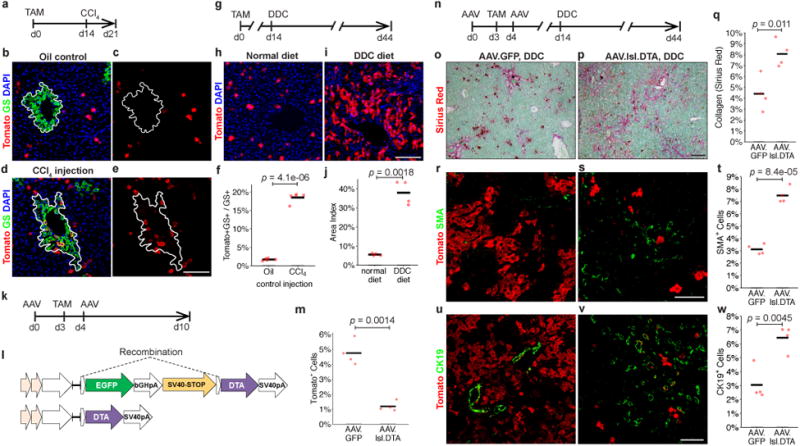
a-f, Single-dose CCl4 liver injury. TertCreERT2/+; Rosa26LSL-Tomato/+ mice treated with oil vehicle (b,c) or CCl4 (d,e) analysed by IF for Tomato and GS at day 7 post-treatment. IF Quantification (f); white lines, GS+ pericentral zone(n = 5 mice). g-j, DDC diet-induced injury in TertCreERT2/+; Rosa26LSL-Tomato/+ mice. IF of liver for Tomato after 30 days treatment with normal diet (h) or DDC diet (i). IF quantification (j) (n = 4 mice). k-m, Ablation of TERTHigh hepatocytes via AAV.lsl.dtA injection to TertCreERT2/+; Rosa26LSL-Tomato/+ mice (n = 4 mice), quantification of Tomato+ cells (m). n-v, Genetic ablation followed by DDC injury in TertCreERT2/+; Rosa26LSL-Tomato/+ mice. Livers analysed by Sirius Red for collagen (o-q), SMA for activated stellate cells (r-t), and CK19+ cells (u-w) (n = 4 mice). AAV.GFP injected control animals (o, r, t) and AAV.lsl. DTA injected animals (p, s, u).Cross-bars: mean.Experiments repeated at least twice. Scale bars, 100 μm.
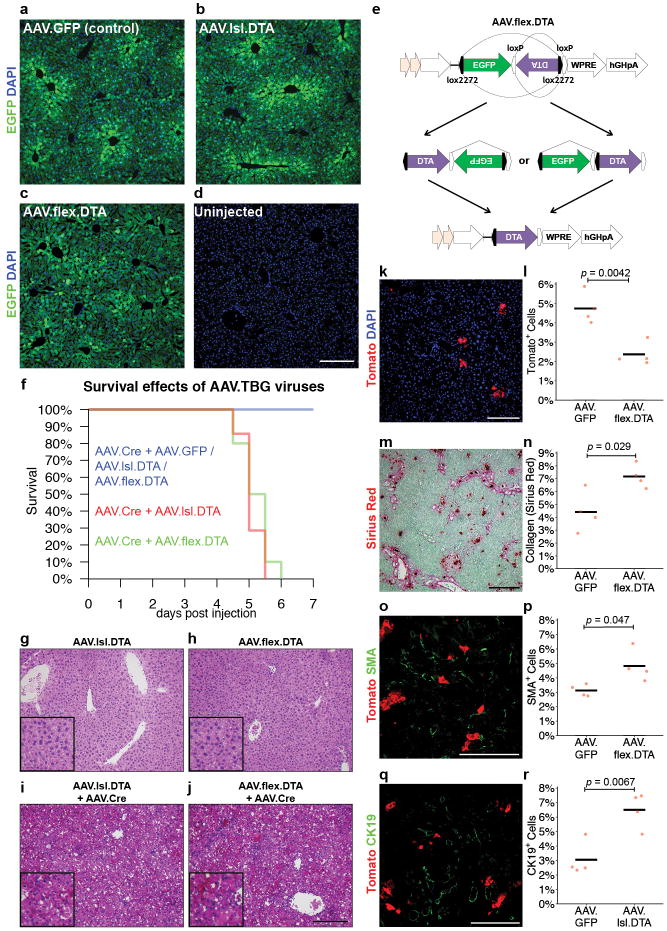
To determine whether TERTHigh hepatocytes are required for normal injury responses, we ablated Tert-expressing hepatocytes using a diphtheria toxin (DTA)-based AAV system, in which hepatocyte-specific expression of DTA is induced upon Cre-mediated deletion of a loxP-EGFP-Stop-loxP element(Fig. 4k-m). Intravenous coinfection of wild-type mice with AAV.lsl.DTA together with AAV.Cre resulted in massive hepatocyte necrosis and death within six days, whereas infection with AAV.lsl.DTA alone was well tolerated for up to two months and did not induce liver damage (Extended Data Fig. 10f-j). Employing this system in TertCreERT2/+; Rosa26LSL-Tomato/+ mice, the abundance of TERTHigh (Tomato+) cells was reduced by 75.1% in mice treated with AAV.lsl.DTA compared with AAV.GFP(Fig. 4m). After ablating TERTHigh cells, we induced liver injury with DDC diet for 30 days (Fig. 4n). Expansion of the TERTHigh cell lineage (Tomato+) was significantly suppressed in mice treated with AAV.lsl.DTA compared with those treated with AAV.GFP (Fig. 4s,v). DDC treatment following TERTHigh hepatocyte ablation led to a marked increase in liver fibrosis, evident by an increase in collagen deposition(Fig. 4o-q) and a significant increase in the number of activated stellate cells (Fig. 4r-t). There was a concomitant increase in CK19+ cells (Fig. 4u-w), indicating that with suppression of hepatocyte renewal the ductal reaction characteristic of DDC treatment is enhanced. Finally, we replicated these results using an independently constructed AAV that allows induction of DTA through Cre-mediated inversion and deletion steps (AAV.flex.DTA) (Extended Data Fig. 10). Taken together, these data show that TERTHigh hepatocytes are critical for normal liver regeneration in the setting of DDC injury and that regeneration in their absence results in elevated stellate cell activation and fibrosis.
Based on the dispersed location of TERTHigh hepatocytes and their clonal behaviour during regeneration, we propose a ‘distributed model’ to explain hepatocyte renewal. According to this ‘distributed model’, rare TERTHigh hepatocytes located throughout the lobule form enlarging clones during homeostasis in response to hepatocyte loss and this response is accelerated during liver injury (Fig. 5). These findings provide a framework to explain several longstanding observations in hepatocyte renewal including: the ability of the liver to recover from injuries in any lobular zone; a general lack of evidence for long-range migration of hepatocytes; and the presence of rare proliferating hepatocytes throughout the lobule. Our RNA-seq data suggest that repopulating activity and metabolism may be segregated within the hepatocyte population. Telomerase activity is critical for preserving long-term cell division and chromosomal stability. Maintaining the liver using a subset of hepatocytes with elevated telomerase and reduced metabolic activity may be important for long-term tissue maintenance, for preventing the accrual of damaged DNA caused by reactive oxygen species and for suppressing hepatocellular carcinoma. We speculate that depletion or dysfunction of an analogous subset of repopulating hepatocytes in humans may underlie the pathophysiology of cirrhosis. Strategies to mitigate this cellular depletion may prove useful in treating cirrhosis of diverse etiologies.
Figure 5. A distributed modelto explain hepatocyte renewal.
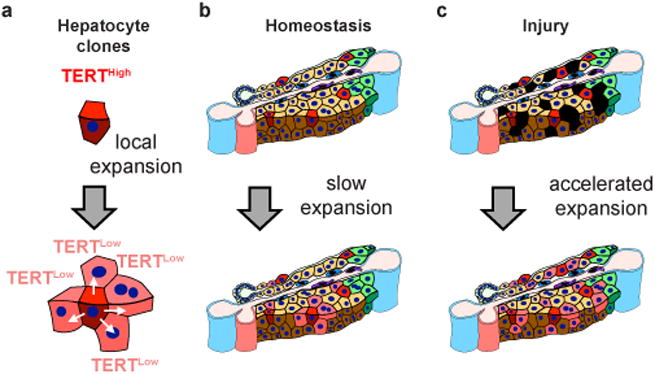
a, TERTHigh hepatocytes generate expanding clones comprised of both TERTHigh and TERTLow hepatocytes. b, Rare TERTHigh hepatocytes distributed throughout the lobule form enlarging clones during homeostasis in response to local hepatocyte loss. c, Repopulation of injured liver by clonal expansion ofTERTHigh hepatocytes is accelerated during injury. Blue vessels, portal and central veins; pink vessel, hepatic artery; small green cells, cholangiocytes; large green cells, pericentral hepatocytes; red cells, TERTHigh hepatocytes; black cells, damaged hepatocytes.
Methods
Generation of the TertCreERT2 knock-in line
The targeting vector was generated by serial recombineering and gate-way cloning. Homology arms (mm10 chr13: 73,621,344 - 73,631,102) were cloned from the BAC (RP24-342O18) via recombineering. A codon-optimized intron-CreERT2-NeoR cassette27 was inserted in the endogenous translational start site of Tert (mm10 chr13: 73,627,032 – 73,627,033) via recombineering. The final targeting vector was created via gate-way cloning to the pWS-TK2 vector with thymidine kinase cassettes at both ends of the homology arms, as previously described28. The targeting vector was linearized and electroporated into JM8/F6 mouse ES cells. Correctly targeted ES clones were selected by southern blots and karyotypes, and then injected into BALB/c blastocysts to generate the knock-in line. TertCreERT2/+ mice were born at normal Mendelian frequency. To verify the efficacy of CreERT2 in the ES, the TertCreERT2/+ clone was targeted with a modified “Rosa26-mTmG” targeting vector29 using HygroR as the selection gene. The double knock-in cells were treated with 500 nM 4-hydroxy tamoxifen (4-OHT) to evaluate recombination efficiency.
AAV production
All AAVs used in this study were produced with cis-plasmids containing the full TBG promoter [two copies of the α-1-microglobulin/bikunin precursor (AMBP) enhancer elements followed by the promoter of the SERPINA7 gene and a mini-intron], an AAV8 serotype packaging plasmid, and an adenovirus helper plasmid. AAV.GFP (AAV8.TBG.PI.eGFP.WPRE.bGH, catalog #: AV-8-PV0146) and AAV.Cre (AAV8.TBG.PI.Cre.rBG, catalog #AV-8-PV1091) were purchased from University of Pennsylvania Vector Core. AAV.lsl.dtA contains a strong SV40 stop element cloned from the Lox-Stop-Lox TOPO plasmid30 (addgene Plasmid #11584). AAV.flex.dtA was modified from pAAV-mCherry-flex-dtA31 (addgene Plasmid #58536) with the following changes: the EF-1α promoter was swapped with the TBG promoter, and mCherry was swapped with EGFP. HEK293T cells were transfected and grown on Corning multi-layer flasks to produce the viruses. The viruses were purified by Iodixanol (Sigma-Aldrich) gradient ultracentrifugation32, and tittered by qPCR33 and SYPRO Ruby (ThermoFisher) protein gel staining with standards.
Animals
TertCreERT2/+ mice were bred with the Rosa26 reporter (Gt(ROSA)26Sortm14(CAG-tdTomato)Hze/J)34 to generate TertCreERT2/+; Rosa26LSL-Tomato/+ mice for analysis. Two-month old mice were intraperitoneally injected with tamoxifen (Caymon, 1 mg/10 g weight) dissolved in 100 μL sesame oil (Sigma-Aldrich). Sparse-labelling was achieved by injecting tamoxifen at 0.08 mg/10 g weight. EdU (Carbosynth) was administrated via drinking water (1 mg/mL) daily for seven days. AAV was diluted to 4e11 genome particles in 100 μL normal saline (per mouse), and injected intravenously. For DDC injury, mice received diet TD.07571 (Harlan) containing 0.1% DDC (Sigma-Aldrich) ad libitum. For CCl4 injury, mice were injected with liquid CCl4 (Sigma-Aldrich, 10 μL/10 g weight) dissolved in sesame oil (Sigma-Aldrich).
Statistics
When comparing two groups, p values were determined by the two-sided unpaired t-test. When comparing more than two groups, p values were determined by the one-way ANOVA with Tukey's HSD test performed as the post hoc analysis. Data significance were also tested by non-parametric statistics using two-sided unpaired Wilcoxon–Mann–Whitney test for two-group comparison, and Kruskal–Wallis one-way ANOVA on ranks with Conover–Iman test performed as the post hoc analysis for more than two groups. Kolmogorov-Smirnov test was performed to compare the distribution patterns of continuous variables. The animals were randomly assigned to each experimental/control group. The investigators were not blinded to allocation during experiments and outcome assessment. Data are presented as “mean±SEM” in the text. Graphs were generated by the ggplot2 package35 in R.
FACS Experiments
Cells were isolated by standard two-step collagenase perfusion. Liver perfusion medium (Life Technologies) and filtered (0.22 μm) liver digest medium (Life Technologies) were perfused via the portal vein sequentially, according to the manufacturer's instructions. Dissociated liver was passed through a 100μm cell strainer and the hepatocytes were enriched by low-speed centrifugation (50xg for 3 min) for three times in hepatocyte wash medium (Life Technologies). Cells were analysed and/or sorted with a BD Aria II flow cytometer using a 100 μm nozzle. Dead cells were excluded based on Topro3 (1 μM) or DAPI (1 μM) (Life Technologies) incorporation. For ploidy analysis, hepatocytes were incubated in Hoechst33342 (15 μg/ml) and Reserpine (5 μM) at 37 degrees for 30min before analysis.
Immunofluorescence (IF), Imunohistochemistry (IHC), EdU detection, single-molecule RNA FISH and SiriusRed staining
Livers were cut into small blocks, and fixed in zinc-buffered formalin (Anatech). For IF, tissue blocks were fixed overnight at 4 degrees, cryoprotected in 30% (w/v) sucrose, embedded in OCT, snap-frozen and cut into 7 μm cryosections. For thick tissue analysis, tissue blocks were briefly fixed, embedded in low-melting agarose and cut into 300 μm sections using a vibratome, as previously described36. For IHC, tissue blocks were fixed overnight at 4 degrees, incubated in 70% ethanol overnight, embedded in paraffin and cut into 5 μm sections. Antigen retrieval was performed with citrate (pH 6) buffer (Biogenex) for 10 min using a pressure cooker. Slides were stained with primary and secondary antibodies in blocking buffer (1% BSA, 5% donkey serum, 0.25% Triton-X in PBS) overnight at 4 degrees, incubated with 1mM DAPI for 5min at room temperature, and mounted in Aqua poly/mount (Polysciences), or Vectashield with DAPI (Vector laboratories). DAB Peroxidase Substrate Kit (Vector Laboratories) or Emerald chromogen kit (Abcam) were used for IHC. EdU incorporation was detected by using the Click-iTEdU Alexa Fluor 488 Imaging Kit (Life Technologies). For analysis on cytospun samples, cells were FACS-sorted and cytospun (500 rpm/28 g for 5min) onto slides. Slides were fixed in 4% (v/v) PFA for 5min, and stained with primary and secondary antibodies in blocking buffer for 1hour at room temperature, and then mounted in Prolong Gold with DAPI mounting medium (Life Technologies). Alternatively, slides were fixed in 4% (v/v) PFA for 20min, and proceeded for single-molecule RNA FISH using an RNAscope® 2.0 HD Detection-RED kit (ACDbio) according to the manufacturer's instruction. SiriusRed staining for collagen deposit was performed with Fast Green as the counter-stain, using a staining kit (Chondrex), according to the manufacturer's instruction.
qPCR and RNAseq
RT-qPCR and RNA-seq were performed on TERTHigh and TERTLow hepatocytes isolated by FACS from three TertCreERT2/+; Rosa26LSL-Tomato/+ mice three days after tamoxifen treatment. Hepatocytes were sorted directly in TRIzol-LS (Life Technologies). Total RNA was extracted and purified using an RNeasy micro kit (Qiagen) according to the manufacturers’ instructions. qPCR was performed using the following primers: Tert (pair1)37 CCACGTATGTGTCCATCAGC / TAGAGGATTGCCACTGGCTC; Tert (pair2) ATCTGCAGGATTCAGATGCC / GCAGGAAGTGCAGGAAGAAG; Tert (pair3)21TGGCTTGCTGCTGGACACTC / TGAGGCTCGTCTTAATTGAGGTCTG; Gtf2b CTCTGTGGCGGCAGCAGCTATTT / CGAGGGTAGATCAGTCTGTAGGA. qPCR reactions were carried out using Brilliant II SYBR® Green master mix (Strategene) and Roche lightcycler 480. Cq values were determined by the second derivative maximum method, and fold-changes were calculated by 2-ΔCq. RNAseq libraries were constructed using a KAPA Stranded mRNA-Seq Kit (Kapa). Libraries were sequenced on the Illumina NextSeq platform, generating 55∼75 million 75bp paired-end reads per library. Three biological replicates per sample were analysed. Raw reads were trimmed by TrimGalore0.4.0 (Babraham Bioinformatics), mapped to mm10 by tophat 2.0.1338, analysed by the DEseq2 packages39. The RNA-seq data have been deposited in NCBI's Gene Expression Omnibus and are accessible through GEO Series accession number GSE104415.
Imaging Analysis
Fluorescent images were analysed by Leica LAS AF, ImageJ, Adobe Photoshop and Fluorender. Area Index was defined by the liver area covered by Tomato+ cells as the percentage of total area, and quantified by ImageJ. 3D reconstruction was performed using Fluorender. Multicellular clones were imaged in 258 × 258 × 100 μm3 volumes by a Leica SP8 confocal microscope, or a Prairie Ultima IV two-photon microscope. Clones composed of more than eight cells often extended the imaging volume, and therefore were counted as eight cells. The surface planar view was created by maximum-projection of the first 12 μm volume close to the surfaceto approximate staining results from thin sections. For co-immunostaining with GS, 580 × 580 × 100 μm3 volumes were imaged. Stitched single-plane images were processed from individual tiles by Adobe Photoshop. Number of EdU+, Ki67+, GS+, CK19+ hepatocytes were manually counted.
TRAP assays
Telomere Repeat Amplification Protocol (TRAP) was carried out by a previously established protocol40. FACS-sorted cells or homogenized tissue were lysed in NP40 buffer (25 mM HEPES-KOH, 400 mM NaCl, 1.5 mM MgCl2, 10% glycerol, 0.5% NP40, and 1 mM DTT [pH 7.5] supplemented with protease inhibitors).
Ethical Compliance
All animal protocols were approved by the Institutional Animal Care and Use Committee at Stanford University. All experiments have complied with relevant ethical regulations by Stanford University.
Code availability
Codes are available from the corresponding author upon request.
Data availability
The source data for the RNA-seq study are available in the GEO repository under accession numbers GSE104415.
Extended Data
Extended Data Figure 1. Generation and characterization of the TertCreERT2/+ knock-in line.
a-d, TertCreERT2 targeting strategy and southern-blot strategy (a). Southern-blots using a 5′probe (b), a NeoR probe (c), and a 3′probe (d). KI, knock-in cells. WT, wild-type cells. For gel source data, see Supplementary Figure 1. e-g, TertCreERT2/+;Rosa26mTmG/+ mouse embryonic stem cells showed either membrane Tomato (f, overlaid on bright-field image), or membrane EGFP(g, overlaid on bright-field image) in response to 500nM 4-hydroxy tamoxifen (4-HT). h, hepatocytes from TertCreERT2/+; Rosa26LSL-Tomato/+ livers before and after FACS-enrichment. i, Tamoxifen dose response of TertCreERT2/+; Rosa26LSL-Tomato/+ livers (n = 3 mice for each group, cross-bar: mean). j, Quantification of the TRAP assay shown in Fig.1e by densitometry. k-n, Co-immunofluorescence for Tomato (red) and CD45 (k, blood cells, 202 cells examined), CD68 (l, Kupffer cells, 179 cells examined), GFAP (m, stellate cells, 158 cells examined) and PECAM (n, endothelial, 167 cells examined) (each in green) in TertCreERT2/+; Rosa26LSL-Tomato/+ liver, 3-day trace, with DAPI (blue). Experiments repeated twice for b-d, f-g, k-n. Scale bars, 100 μm in g,h, 50 μm in k-n.
Extended Data Figure 2. Ploidy and nuclear profiles of the TERTLow and TERTHigh lineages.
a-c, Ploidy analysis by Hoechst incorporation and FACS in TERTLow (a) and TERTHigh (b) hepatocytes. Quantification showed no significant differences between TERTLow and TERTHighcells regarding ploidies (c, n = 5 mice, each represented by unique dot-shapes). d-f, Nuclei count by Tomato(red), phalloidin(green) and DAPI(blue) in livers traced by 3 days (d) and 6 months (e). Quantification showed no significant differences between TERTLow and TERTHighcells in binuclei fractions (f, n = 4 mice for each group, each represented by unique dot-shapes). Experiments repeated twice. Scale bar, 50 μm.
Extended Data Figure 3. Characterization of the lineage expansion of TERTHigh hepatocytes.
a-e, IF performed on TertCreERT2/+; Rosa26LSL-Tomato/+ livers after one-year trace showed TERTHigh hepatocytes exclusively gave rise to hepatocytes. f-i, Repeated injections showed TERTHigh cells as a constant proportion of the liver. Lineage expansion over one injection (g) and three injections (h) was quantified (i, n = 3 mice for each group; cross-bar: mean). j, Heat map showing differentially regulated genes among all TERTLow and TERTHigh samples. Class I and Class 2 refer to genes significantly down-regulated and up-regulated in TERTHigh samples, respectively. Genes assigned to DAVID- generated annotation clusters shown on the right. Experiments repeated twice. Scale bar, 200 μm.
Extended Data Figure 4. Zonal pattern of TERTHigh lineage hepatocytes.
a-d, Stitched images of IF for Tomato protein (red) and GS (green) in liver sections from TertCreERT2/+; Rosa26LSL-Tomato/+ mice treated with tamoxifen and traced for three days (a), three months (b), six months (c) or one year (d). e-g, FACS-isolated and cytospunhepatocytes from TertCreERT2/+; Rosa26LSL-Tomato/+ mice treated with tamoxifen and traced for three days were stained for CPS1 (red) and GS (green) in TERTLow (e) and TERTHigh hepatocytes (f), and quantified for the GS+ fraction of all cells (g, n = 3 mice; cross-bars: mean). Experiments repeated three times. Scale bars, 200 μm.
Extended Data Figure 5. Distribution of proliferating hepatocytes in Tert+/+ and TertCreERT2/+ livers in homeostasis and under injury hepatocytes.
a-f, Livers were stained with anti-Ki-67 antibody with standard immunohistochemistry. Ki-67+ nuclei were indicated by brown colours in uninjured livers (a, b), and CCl4 (10 μL/10 g weight) injured livers (c, d), with haematoxylin counterstain in light blue. Green chromogen was used to indicate Ki-67+ nuclei in DDC (0.1%) treated livers (e, f). Hepatocyte nuclei were distinguished by size and morphology. Examples of Ki-67+ hepatocytes nuclei were shown in box insets. g, Quantification of Ki-67+ hepatocytes and their distribution along the central-portal axis. The position index (P.I.) was determined by the distance to the most adjacent central vein (x), the distance to the most adjacent portal vein (y), and the distance between the central and portal veins (z), following the law of cosines. h-j,Two-sided Kolmogorov-Smirnov tests were performed to analyse the distribution of Ki-67+ hepatocytes along the central-portal axis. Histograms (bin-width = 0.1) and shaded curves of the kernel density estimation with Gaussian approximation were shown. Bars and error-bars: mean±SEM. No significant differences between Tert+/+ and TertCreERT2/+ livers were found in uninjured livers (h, n = 4 mice for each group;each mouse represented by unique dot-shapes;p = 0.58), in CCl4 injured livers (i, n = 3 mice for each group; each mouse represented by unique dot-shapes, p = 0.32), or in DDC injured livers (j, n = 3 mice for each group; each mouse represented by unique dot-shapes;p = 0.98). Experiments repeated twice. CV, central vein; PV, portal vein; P.I., position index. Scale bar, 200 μm.
Extended Data Figure 6. EdU incorporation assays.
a, Scheme of experiments. b-g, EdU incorporation in livers of TertCreERT2/+; Rosa26LSL-Tomato/+ mice treated with tamoxifen, traced for three days, then treated with EdU in drinking water for 7 days (1 mg/mL). The overlay image (b), as well as individual images of HNF4A (c), DAPI (d), EdU (e) and Tomato (f) were shown. Quantification of EdU incorporation in hepatocytes (g, n = 5 mice, each represented by unique dot-colours). Dashed boxes, EdU+HNF4A+Tomato+ cells. h-k,EdU incorporation in livers of Tert+/+ (h) and TertCreERT2/+(i) mice were compared. Co-immunofluorescence for GS (red) and CK19 (white) was overlaid with EdU (green) and DAPI (blue). Quantification of the distribution of EdU+ hepatocytes (j, “pericentral”: in GS+ zones; “periportal”: 0-2 cell layers adjacent to the portal veins space or CK19+ bile ducts; “mid-lobular”: neither “pericentral” nor “periportal”. Dot-colours represent individual mice) and total EdU+ hepatocytes in Tert+/+ and TertCreERT2/+ livers (k) (n = 5 mice for Tert+/+livers, and n = 4 mice for TertCreERT2/+livers). Experiments repeated twice. Scale bar, 50 μm in d, 200 μm in i.
Extended Data Figure 7. Single-molecule RNA FISH on wild-type hepatocytes.
a, Experiment performed on wild-type hepatocytes isolated by FACS and cytospun. b, Control experimentby omitting the detection probe for Tert. c, Quantification by foci counts (n = 3 mice, each represented by unique dot-shapes. Bars and error-bars are mean+SEM). Experiments repeated three times. Scale bar, 50 μm.
Extended Data Figure 8. Responses of Tert+/+ and TertCreERT2/+livers to injuries.
a-b, H&E analysis on uninjured livers. c-d, H&E analysis on livers 3 days post CCl4 injection. Artificial white dotted lines encircle the damage pericentral area. e-f, H&E analysis on livers 7 days post CCl4 injection. g-h, H&E analysis on livers 1 month post DDC treatment. CV, central vein; PV, portal vein. Experiments repeated five times. Scale bar, 200 μm.
Extended Data Figure 9. Progeny of TERTHigh hepatocytes can adopt ductal fate after DDC injury.
a-d, IF analysis on TertCreERT2/+; Rosa26LSL-Tomato/+ livers treated with tamoxifen and DDC, and traced for 1 month. The overlay image (a), as well as individual images of Tomato (b), CK19 (c), and DAPI (d) were shown. e. Quantification of the percentage of CK19+Tomato+ cells in all Tomato+ cells (n = 5 mice, mean±SEM:10.0±1.2%) f. Quantification of the percentage of CK19+Tomato+ cells in all CK19+ cells (n = 5 mice, mean±SEM:6.1±1.0%). Bars: mean. Experiments repeated three times. Scale bar, 50 μm.
Extended Data Figure 10. Characterization of AAV.lsl.DTA and AAV.flex.DTA.
a-d, Epifluorescence of EGFP, as well as DAPI staining from livers 4 days after injection with AAV.GFP (a), AAV.lsl.DTA (b), AAV.flex.DTA (c), and uninjected control (d) shown. e, Diagram of AAV.flex.DTA, and recombination events that lead to DTA expression. f, Survival effects of AAV.TBG viruses. Combined injection of “AAV.lsl.DTA+AAV.Cre” (red line) or “AAV.flex.DTA+AAV.Cre” (green line) lead to a narrow window of complete mortality between 4.5-6 days; in contrast, “AAV.GFP+AAV.Cre”, AAV.lsl.DTA, or AAV.flex.DTA injection did not result in mortality. Between 4-6 mice were used for each regimen. Survived mice were monitored for up to 2 months. g-j,H&E on liver sections from mice injected with AAV.lsl.DTA alone (g), AAV.flex.DTA alone (h), “AAV.lsl.DTA+AAV.Cre” (i), and “AAV.flex.DTA+AAV.Cre” (j). k-r, Livers injected with AAV.flex.DTA and Tamoxifen showed reduction of TERTHigh cells (k, l), as well as increases in collagen deposit (m, n), activated stellate cells (o, p) and ductal cells (q, r). Experiments repeated three times for a-d, and twice for g-j, k-r. Scale bars, 200 μm.
Supplementary Material
Acknowledgments
This work was supported by grants from the NIH (NCI CA197563 and NIA AG056575) to S.E.A, the Emerson Foundation (S.E.A.), and California TRDRP (P.N.). We thank members of the Artandi laboratory, R. Nusse, P. Beachy, M. Kay and M. Krasnow for critical comments.
Footnotes
Author Contributions: S.L., and S.E.A. conceived the study. S.L.,E.M.N. and S.E.A. designed the experiments. S.L. and C.G. created the Tert knock-in line. S.L. and E.M.N. performed the lineage tracing and EdU incorporation experiments. L.C. performed the TRAP assay. S.L. and P.N. performed histological analysis. S.L., and S.W. performed the AAV experiments. S.L. and A.G. performed RNA-seq analyses. S.L. and S.E.A. analysed the data and wrote the paper.
Author Information: The authors declare no competing financial interests.
References
- 1.Stanger BZ. Cellular homeostasis and repair in the mammalian liver. Annu Rev Physiol. 2015;77:179–200. doi: 10.1146/annurev-physiol-021113-170255. [DOI] [PMC free article] [PubMed] [Google Scholar]
- 2.Zaret KS, Grompe M. Generation and regeneration of cells of the liver and pancreas. Science. 2008;322:1490–1494. doi: 10.1126/science.1161431. [DOI] [PMC free article] [PubMed] [Google Scholar]
- 3.Malato Y, et al. Fate tracing of mature hepatocytes in mouse liver homeostasis and regeneration. The Journal of clinical investigation. 2011;121:4850–4860. doi: 10.1172/JCI59261. [DOI] [PMC free article] [PubMed] [Google Scholar]
- 4.Schaub JR, Malato Y, Gormond C, Willenbring H. Evidence against a stem cell origin of new hepatocytes in a common mouse model of chronic liver injury. Cell reports. 2014;8:933–939. doi: 10.1016/j.celrep.2014.07.003. [DOI] [PMC free article] [PubMed] [Google Scholar]
- 5.Yanger K, et al. Adult hepatocytes are generated by self-duplication rather than stem cell differentiation. Cell stem cell. 2014;15:340–349. doi: 10.1016/j.stem.2014.06.003. [DOI] [PMC free article] [PubMed] [Google Scholar]
- 6.Tarlow BD, Finegold MJ, Grompe M. Clonal tracing of Sox9+ liver progenitors in mouse oval cell injury. Hepatology. 2014;60:278–289. doi: 10.1002/hep.27084. [DOI] [PMC free article] [PubMed] [Google Scholar]
- 7.Tarlow BD, et al. Bipotential Adult Liver Progenitors Are Derived from Chronically Injured Mature Hepatocytes. Cell stem cell. 2014 doi: 10.1016/j.stem.2014.09.008. [DOI] [PMC free article] [PubMed] [Google Scholar]
- 8.Raven A, et al. Cholangiocytes act as facultative liver stem cells during impaired hepatocyte regeneration. Nature. 2017;547:350–354. doi: 10.1038/nature23015. [DOI] [PMC free article] [PubMed] [Google Scholar]
- 9.Calado RT, et al. Constitutional telomerase mutations are genetic risk factors for cirrhosis. Hepatology. 2011;53:1600–1607. doi: 10.1002/hep.24173. [DOI] [PMC free article] [PubMed] [Google Scholar]
- 10.Hartmann D, et al. Telomerase gene mutations are associated with cirrhosis formation. Hepatology. 2011;53:1608–1617. doi: 10.1002/hep.24217. [DOI] [PubMed] [Google Scholar]
- 11.Rudolph KL, Chang S, Millard M, Schreiber-Agus N, DePinho RA. Inhibition of experimental liver cirrhosis in mice by telomerase gene delivery. Science. 2000;287:1253–1258. doi: 10.1126/science.287.5456.1253. [DOI] [PubMed] [Google Scholar]
- 12.Jungermann K, Kietzmann T. Zonation of parenchymal and nonparenchymal metabolism in liver. Annu Rev Nutr. 1996;16:179–203. doi: 10.1146/annurev.nu.16.070196.001143. [DOI] [PubMed] [Google Scholar]
- 13.Wang B, Zhao L, Fish M, Logan CY, Nusse R. Self-renewing diploid Axin2(+) cells fuel homeostatic renewal of the liver. Nature. 2015;524:180–185. doi: 10.1038/nature14863. [DOI] [PMC free article] [PubMed] [Google Scholar]
- 14.Font-Burgada J, et al. Hybrid Periportal Hepatocytes Regenerate the Injured Liver without Giving Rise to Cancer. Cell. 2015;162:766–779. doi: 10.1016/j.cell.2015.07.026. [DOI] [PMC free article] [PubMed] [Google Scholar]
- 15.Planas-Paz L, et al. The RSPO-LGR4/5 ZNRF3/RNF43 module controls liver zonation and size. Nat Cell Biol. 2016;18:467–479. doi: 10.1038/ncb3337. [DOI] [PubMed] [Google Scholar]
- 16.Tanami S, et al. Dynamic zonation of liver polyploidy. Cell Tissue Res. 2017;368:405–410. doi: 10.1007/s00441-016-2427-5. [DOI] [PubMed] [Google Scholar]
- 17.Batista LF, Artandi SE. Understanding telomere diseases through analysis of patient-derived iPS cells. Curr Opin Genet Dev. 2013;23:526–533. doi: 10.1016/j.gde.2013.07.006. [DOI] [PMC free article] [PubMed] [Google Scholar]
- 18.Nault JC, et al. High frequency of telomerase reverse-transcriptase promoter somatic mutations in hepatocellular carcinoma and preneoplastic lesions. Nat Commun. 2013;4:2218. doi: 10.1038/ncomms3218. [DOI] [PMC free article] [PubMed] [Google Scholar]
- 19.Pech MF, et al. High telomerase is a hallmark of undifferentiated spermatogonia and is required for maintenance of male germline stem cells. Genes Dev. 2015;29:2420–2434. doi: 10.1101/gad.271783.115. [DOI] [PMC free article] [PubMed] [Google Scholar]
- 20.Montgomery RK, et al. Mouse telomerase reverse transcriptase (mTert) expression marks slowly cycling intestinal stem cells. Proc Natl Acad Sci U S A. 2011;108:179–184. doi: 10.1073/pnas.1013004108. [DOI] [PMC free article] [PubMed] [Google Scholar]
- 21.Schepers AG, Vries R, van den Born M, van de Wetering M, Clevers H. Lgr5 intestinal stem cells have high telomerase activity and randomly segregate their chromosomes. The EMBO journal. 2011;30:1104–1109. doi: 10.1038/emboj.2011.26. [DOI] [PMC free article] [PubMed] [Google Scholar]
- 22.Itzkovitz S, et al. Single-molecule transcript counting of stem-cell markers in the mouse intestine. Nature cell biology. 2011;14:106–114. doi: 10.1038/ncb2384. [DOI] [PMC free article] [PubMed] [Google Scholar]
- 23.Gao GP, et al. Novel adeno-associated viruses from rhesus monkeys as vectors for human gene therapy. Proc Natl Acad Sci U S A. 2002;99:11854–11859. doi: 10.1073/pnas.182412299. [DOI] [PMC free article] [PubMed] [Google Scholar]
- 24.Elias H. A re-examination of the structure of the mammalian liver; the hepatic lobule and its relation to the vascular and biliary systems. Am J Anat. 1949;85:379–456. doi: 10.1002/aja.1000850303. 315 pl. [DOI] [PubMed] [Google Scholar]
- 25.Recknagel RO, Glende EA, Jr, Dolak JA, Waller RL. Mechanisms of carbon tetrachloride toxicity. Pharmacol Ther. 1989;43:139–154. doi: 10.1016/0163-7258(89)90050-8. [DOI] [PubMed] [Google Scholar]
- 26.Kopp JL, Grompe M, Sander M. Stem cells versus plasticity in liver and pancreas regeneration. Nat Cell Biol. 2016;18:238–245. doi: 10.1038/ncb3309. [DOI] [PubMed] [Google Scholar]
- 27.Davis R. Cre recombinase-expressing mice generated for the NIH Neuroscience Blueprint Cre Driver Network. MGI Direct Data Submission. 2009 [Google Scholar]
- 28.Wu S, Ying G, Wu Q, Capecchi MR. A protocol for constructing gene targeting vectors: generating knockout mice for the cadherin family and beyond. Nature protocols. 2008;3:1056–1076. doi: 10.1038/nprot.2008.70. [DOI] [PubMed] [Google Scholar]
- 29.Muzumdar MD, Tasic B, Miyamichi K, Li L, Luo L. A global double-fluorescent Cre reporter mouse. Genesis. 2007;45:593–605. doi: 10.1002/dvg.20335. [DOI] [PubMed] [Google Scholar]
- 30.Jackson EL, et al. Analysis of lung tumor initiation and progression using conditional expression of oncogenic K-ras. Genes Dev. 2001;15:3243–3248. doi: 10.1101/gad.943001. [DOI] [PMC free article] [PubMed] [Google Scholar]
- 31.Wu Z, Autry AE, Bergan JF, Watabe-Uchida M, Dulac CG. Galaninneurons in the medial preoptic area govern parental behaviour. Nature. 2014;509:325–330. doi: 10.1038/nature13307. [DOI] [PMC free article] [PubMed] [Google Scholar]
- 32.Zolotukhin S, et al. Recombinant adeno-associated virus purification using novel methods improves infectious titer and yield. Gene Ther. 1999;6:973–985. doi: 10.1038/sj.gt.3300938. [DOI] [PubMed] [Google Scholar]
- 33.Aurnhammer C, et al. Universal real-time PCR for the detection and quantification of adeno-associated virus serotype 2-derived inverted terminal repeat sequences. Hum Gene Ther Methods. 2012;23:18–28. doi: 10.1089/hgtb.2011.034. [DOI] [PubMed] [Google Scholar]
- 34.Madisen L, et al. A robust and high-throughput Cre reporting and characterization system for the whole mouse brain. Nat Neurosci. 2010;13:133–140. doi: 10.1038/nn.2467. [DOI] [PMC free article] [PubMed] [Google Scholar]
- 35.Wickham H. ggplot2: Elegant Graphics for Data Analysis. Springer-Verlag; New York: p. 2009. [Google Scholar]
- 36.Snippert HJ, Schepers AG, Delconte G, Siersema PD, Clevers H. Slide preparation for single-cell-resolution imaging of fluorescent proteins in their three-dimensional near-native environment. Nature protocols. 2011;6:1221–1228. doi: 10.1038/nprot.2011.365. [DOI] [PubMed] [Google Scholar]
- 37.Cui W, Taub DD, Gardner K. qPrimerDepot: a primer database for quantitative real time PCR. Nucleic Acids Res. 2007;35:D805–809. doi: 10.1093/nar/gkl767. [DOI] [PMC free article] [PubMed] [Google Scholar]
- 38.Kim D, et al. TopHat2: accurate alignment of transcriptomes in the presence of insertions, deletions and gene fusions. Genome Biol. 2013;14:R36. doi: 10.1186/gb-2013-14-4-r36. [DOI] [PMC free article] [PubMed] [Google Scholar]
- 39.Love MI, Huber W, Anders S. Moderated estimation of fold change and dispersion for RNA-seq data with DESeq2. Genome Biol. 2014;15:550. doi: 10.1186/s13059-014-0550-8. [DOI] [PMC free article] [PubMed] [Google Scholar]
- 40.Kim NW, Wu F. Advances in quantification and characterization of telomerase activity by the telomeric repeat amplification protocol (TRAP) Nucleic Acids Res. 1997;25:2595–2597. doi: 10.1093/nar/25.13.2595. [DOI] [PMC free article] [PubMed] [Google Scholar]
Associated Data
This section collects any data citations, data availability statements, or supplementary materials included in this article.
Supplementary Materials
Data Availability Statement
The source data for the RNA-seq study are available in the GEO repository under accession numbers GSE104415.


