Abstract
Altered re-wiring of cell metabolism and transcriptional programs are both hallmarks of cancer that sustain rapid proliferation and metastasis1. However mechanisms controlling the interplay between metabolic reprogramming and transcriptional regulation remain elusive. Here we show that metabolic enzyme 6-phosphofructo-2-kinase/fructose-2,6-bisphosphatase 4 (PFKFB4) regulates transcriptional reprogramming by activating the oncogenic steroid receptor coactivator-3 (SRC-3). We employed a method for identifying potential kinases that modulate coactivator functions by integrating kinome-wide RNA interference (RNAi)-based screening coupled to intrinsic SRC-3-transcriptional response. PFKFB4, a regulatory enzyme that synthesizes an allosteric stimulator of glycolysis2, was found to be a robust stimulator of SRC-3 that co-activates estrogen receptor (ER). PFKFB4 phosphorylates SRC-3 at serine 857 (S857) enhancing its transcriptional activity, whereas either suppression of PFKFB4 or ectopic expression of a phosphorylation-deficient SRC-3 mutant S857A (SRC-3S857A) significantly abolishes SRC-3-mediated transcriptional output. Functionally, PFKFB4-driven SRC-3 activation drives glucose flux towards the pentose phosphate pathway enabling purine synthesis by transcriptionally upregulating the expression of enzyme transketolase (TKT). In addition, two enzymes adenosine monophosphate deaminase-1 (AMPD1) and xanthine dehydrogenase (XDH) involved in purine metabolism were identified as SRC-3 targets which may or may not be directly involved in purine synthesis. Mechanistically, phosphorylation at S857 increases coactivator interaction with the transcription factor ATF4 stabilizing SRC-3/ATF4 recruitment to target gene promoters. Ablation of SRC-3 or PFKFB4 suppresses in vivo breast tumor growth and prevents metastasis to the lung from an orthotopic setting as does an SRC-3S857A mutant. PFKFB4 and pSRC-3-S857 levels are elevated and significantly correlate in ER positive tumors whereas, in patients with basal subtype, PFKFB4-SRC-3 drives a common protein signature that positively correlates with the poor survival of breast cancer patients. These findings suggest that the Warburg-pathway enzyme PFKFB4 acts as a molecular fulcrum coupling sugar metabolism to transcriptional activation by stimulating SRC-3 critical to promote aggressive metastatic tumors.
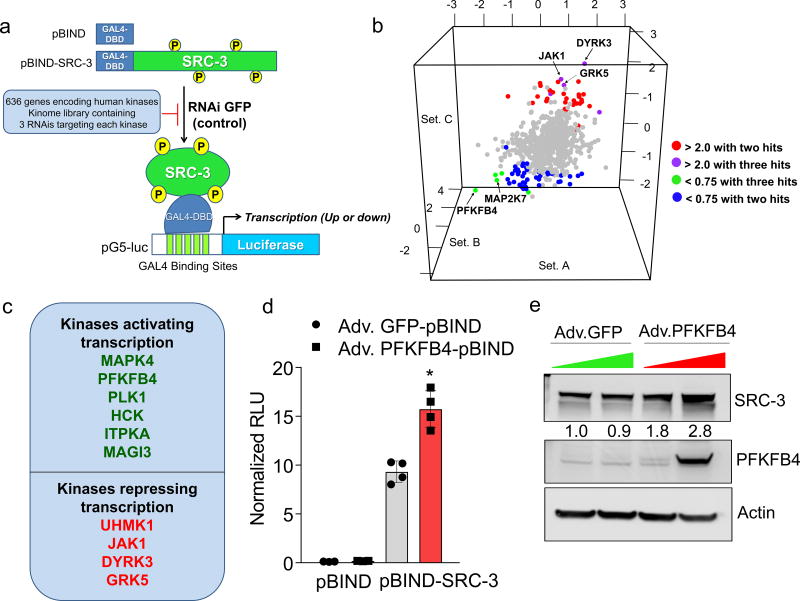
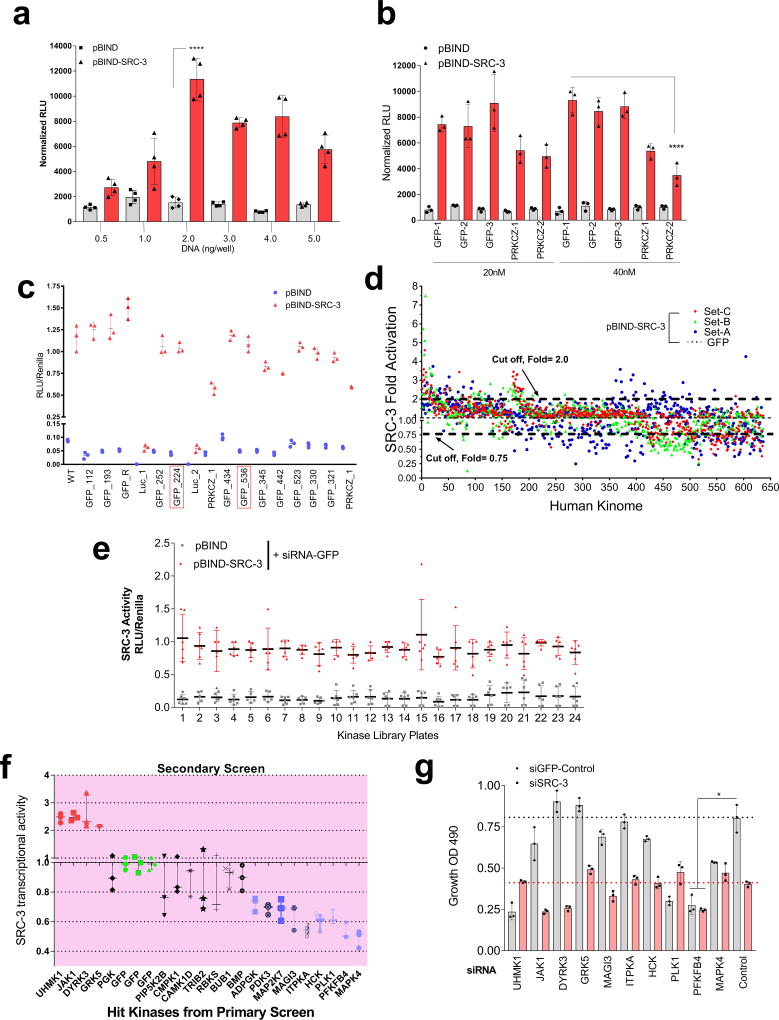
Among the landscape of genetic alterations that drive aggressive metastatic tumors, transcriptional coregulator SRC-3 is one of the abundantly deregulated oncogenes3–5. Importantly, dynamic interactions between SRC-3 and its subsequent recruitment to target genes are delicately regulated by post-translational modifications on SRC-36. Phosphorylation of SRC-3 can alter its transcriptional activity, protein stability and subcellular localization7–9, and deregulated kinase signaling hyper-activating SRC-3 is a hallmark of many tumors10, 11. As a starting point for identifying kinases that modulate SRC-3 transcriptional activity, we performed an unbiased RNAi screening assay using a kinome library containing siRNAs targeting 636 human kinases (median 3 siRNAs per kinase) in the presence of a GAL4-DNA binding domain-fused-SRC-3 (pBIND-SRC-3)12 and GAL4 DNA binding sites containing luciferase reporter gene (pG5-luc) (Fig. 1a). The concentration of pBIND-SRC-3 construct needed to obtain luciferase readings in a linear range was standardized along with the dose of kinase siRNAs to observe significant alterations in SRC-3 intrinsic activity (Extended Data Fig. 1a, b). As a positive control we used siRNAs targeting protein kinase C zeta (PRKCZ1), a kinase known to activate SRC-313, and compared the repression of the coregulator activity upon kinase knockdown with the non-targeting control GFP-siRNAs (Extended Data Fig. 1c). Kinome-wide screening identified several kinases as modulators of SRC-3 activity (Fig. 1b, Extended Data Fig. 1d, Supplementary Table 1), either as stimulators or repressors compared to the controls (Extended Data Fig. 1e).
Figure 1. PFKFB4 is an essential activator of transcriptional coregulator SRC-3.
a, Schematics showing the RNAi kinome library screening with SRC-3 transcriptional activity assay using GAL4 DNA binding site-luciferase reporter (pG5-luc) along with GAL4-DNA binding domain (DBD)-full-length SRC-3 fusion (pBIND-SRC-3) or control pBIND as readout. b, Log2 fold change in SRC-3 activity with three siRNAs/kinase represented as Set A, Set B and Set C in the 3D plot (n=3, biologically independent samples targeted by siRNAs). Suppression of kinases increasing SRC-3 activity with 2/3 siRNAs (red) or 3/3 siRNAs (purple), and reducing SRC-3 activity with 3/3 siRNAs (green) or 2/3 (blue). c, Kinases scoring reproducibly in modulating SRC-3 activity. d, SRC-3 activity in MCF-7 cells transduced with adv. GFP or PFKFB4 and co-transfected with pBIND (n=3) or pBIND-SRC-3 (n=4). [Mean ± s.d., one-way ANOVA with Tukey’s Multiple comparisons test]. g, Protein expression of SRC-3, PFKFB4 and actin in MCF-7 cells overexpressing PFKFB4 or control-GFP. For exact P-values please refer to source data, and n represents biologically independent samples.
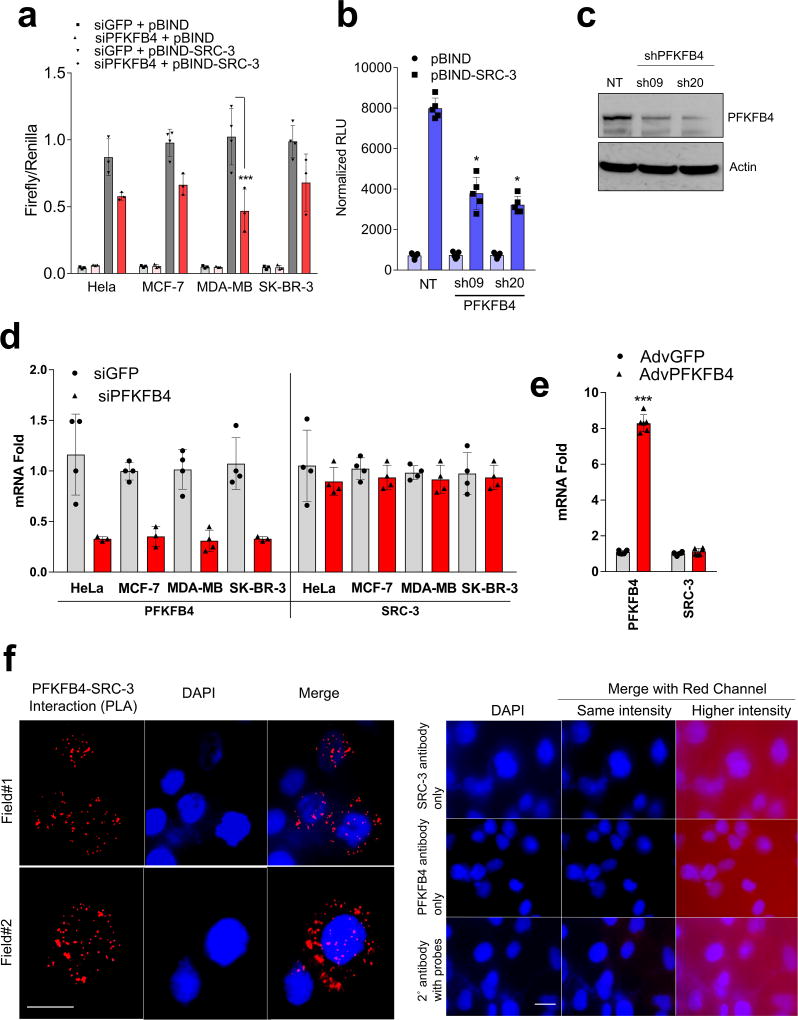
Ten kinases were designated as reproducible and significant hits in the screen (Fig. 1c and Extended Data Fig. 1f), among which metabolic kinase PFKFB4 was identified as the most robust positive regulator of SRC-3 activity. A secondary screen coupled with growth assays to identify the top-hit kinases driving cancer cell proliferation also identified PFKFB4 to be the most dominant kinase regulating cellular proliferation (Extended Data Fig. 1g). Silencing of PFKFB4 with different shRNAs and siRNAs decreased SRC-3 activity (Extended Data Fig. 2a, b) in multiple cancer lines with reduced PFKFB4 levels (Extended Data Fig. 2c, d), whereas ectopic overexpression of PFKFB4 using an adenoviral infection (Adv. PFKFB4) enhanced SRC-3 activity (Fig. 1d). Interestingly, SRC-3 protein levels were increased upon ectopic PFKFB4 expression (Fig. 1e), but not mRNA levels (Extended Data Fig. 2e), and proximity ligation assays (PLA) support a direct SRC-3-PFKFB4 interaction, consistent with PFKFB4-dependent regulation of SRC-3 activity (Extended Data Fig 2f).
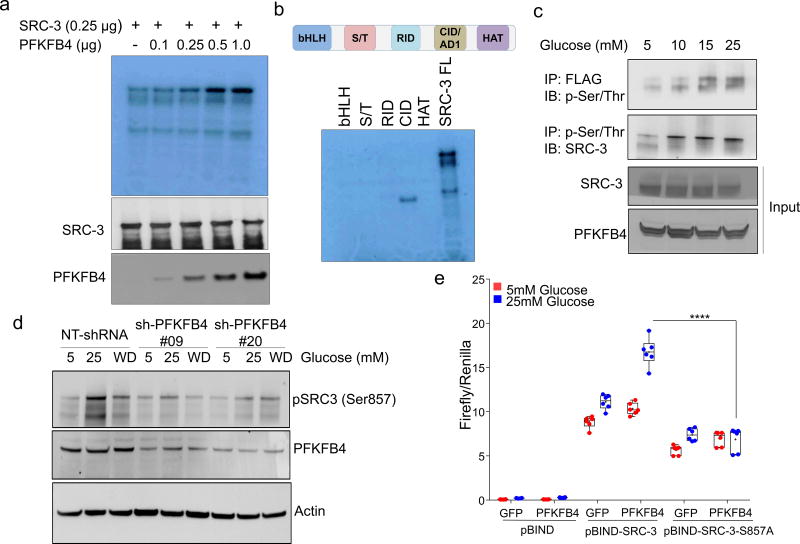
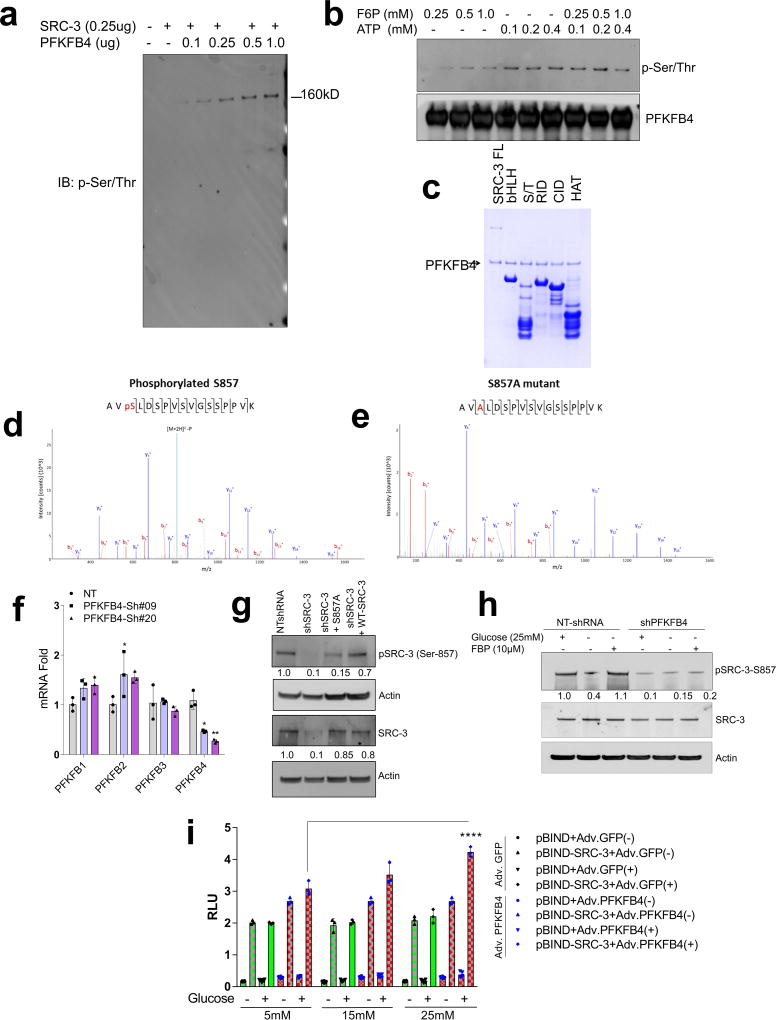
PFKFB4 encodes 6-phosphofructo-2-kinase/fructose-2,6-bisphosphatase-4, a bifunctional metabolic enzyme that synthesizes fructose 2,6-bisphosphate (F2,6-BP), an important sugar-phosphate metabolite that stimulates glycolysis14. PFKFB4 dovetails two antagonistic properties involving a kinase reaction synthesizing F2,6-BP from fructose-6-phosphate (F6P) and ATP, and conversely hydrolyzing F2,6-BP into F6P and inorganic phosphate (Pi) via its phosphatase activity15, 16. These properties of PFKFB4 prompted us to investigate whether PFKFB4-catalyzed enzymatic reactions could increase phosphorylation on SRC-3. An in vitro enzymatic reaction containing F6P, ATP and varying concentrations of recombinant PFKFB4 enzyme were incubated with purified full-length SRC-3 protein. Surprisingly, increasing the amount of PFKFB4 enzyme in the reaction concomitantly enhanced the Ser/Thr phosphorylation of SRC-3 indicating that the metabolic enzyme PFKFB4 can phosphorylate a protein substrate (Extended Data Fig. 3a). We investigated the phosphate-donor in the PFKFB4-kinase reaction, and identified ATP as being required for SRC-3 phosphorylation by PFKFB4 (Extended Data Fig. 3b). These findings suggest that PFKFB4 can function as a protein kinase to phosphorylate SRC-3 by transferring a phosphate group from ATP. To confirm this observation, we performed a kinase assay using [γ-32P]ATP as the phosphate donor and observed enhanced incorporation of phosphate from [γ-32P]ATP into SRC-3 protein upon increasing concentrations of the PFKFB4 kinase in the reaction (Fig. 2a). To identify the phosphorylation site(s) on SRC-3, we used recombinant GST-fused-SRC-3 fragments encoding various domains (Extended Data Fig. 3c) as substrates for an in vitro kinase reaction, and found that only the CBP-interacting domain (CID) of SRC-317 is phosphorylated by PFKFB4 (Fig. 2b). In vitro phosphorylated GST-SRC-3-CID protein then was analyzed by mass spectrometry and only one serine residue (S857) was identified as a phosphorylation target of PFKFB4 (Extended Data Fig. 3d). Consistent with this identification, mutation of S857 to alanine (S857A) abolished phosphorylation of the SRC-3-CID by PFKFB4 in vitro (Extended Data Fig. 3e), confirming PFKFB4 phosphorylates oncogenic coregulator SRC-3 at S857.
Figure 2. PFKFB4 phosphorylates SRC-3 by functioning as a protein kinase.
a, Upper panel-Recombinant GST-fused PFKFB4 incubated with full-length SRC-3 (SRC-3 FL) in presence of [32P]ATP in an in vitro kinase assay. Lower panels- SRC-3 and PFKFB4 protein levels were analyzed by immunoblotting. b, In vitro kinase assay of PFKFB4 in the presence of SRC-3 fragments expressing different domains or full length SRC-3-FL. c, HEK293T cells expressing Flag-tagged-SRC-3 and PFKFB4 cultured in different concentrations of glucose and immunoprecipitated by Flag or p-Ser/Thr antibodies followed by immunoblotting. d, MDA-MB-231 cells stably expressing shRNAs targeting PFKFB4 (sh-PFK#09 and sh-PFK#20) or control NT-shRNA grown in presence of 5mM, 25mM glucose or glucose withdrawn from cells grown in 25mM of glucose and replaced with 5mM (WD) for 6 hours. Protein levels of pSRC-3-S857, PFKFB4 and β-actin were detected by immunoblotting. e, HEK293T cells expressing pBIND, pBIND-SRC-3 or pBIND-SRC-3-S857A were transduced with Adv. GFP or PFKFB4, and cultured in 5mM or 25mM glucose followed by luciferase assay. [Boxes represent 25th to 75th percentile, line in the middle represents median, whiskers showing min to max all points, + indicates mean, n=6 biologically independent experiments; Two-way ANOVA with Tukey’s Multiple comparisons test]. Data shown in (a–e) are representative of 3 biologically independent experiments with similar results. For exact P-values please refer to source data.
Since increased glucose metabolism stimulates the kinase activity of PFKFB4 required to maintain steady glycolysis18, we measured the levels of phosphorylated-SRC-3 (pSRC-3) under these conditions. HEK293T cells were transfected with Flag-SRC-3 and PFKFB4, and then stimulated with an increasing concentration of glucose in culture media, which revealed enhanced phosphorylation of SRC-3 (Fig. 2c). Next we investigated the levels of pSRC-3-S857 in breast cancer cells under conditions of active glycolysis by immunoblotting with a pSRC-3-S857-selective antibody. MDA-MB-231 cells growing under a normal glucose (25mM) condition showed robust phosphorylation of SRC-3 at S857 compared to tumor cells cultured in low glucose (5mM) (Fig. 2d). Interestingly, withdrawing glucose from the media (WD) following growth in normal glucose conditions (25mM) resulted in significant loss of SRC-3 phosphorylation (Fig. 2d). Moreover, stable knockdown of PFKFB4 using two different shRNA constructs (sh-PFK#09 and sh-PFK#20) (Fig. 2d, Extended Data Fig. 3f) abolished pSRC-3-S857 levels in breast cancer cells cultured in 25mM glucose, indicating that PFKFB4-dependent SRC-3 phosphorylation on S857 is a highly-selective modification under conditions conducive to active glycolysis. We expressed SRC-3S857A (S857A) phosphorylation-defective mutant or SRC-3 wild-type (WT-SRC-3) protein in SRC-3 ablated cells, and under conditions of active glycolysis levels of pSRC-3-S857 are elevated in WT-SRC-3 cells compared to SRC-3S857A (Extended Data Fig. 3g). Importantly, introduction of fructose-1,6-bisphosphate (FBP) alone into glucose-starved cells permeabilized with streptolysin O (SLO) rescued pSRC-3-S857 levels (Extended Data Fig. 3h) indicating this phosphorylation-event is linked with the energy status of the cell19.
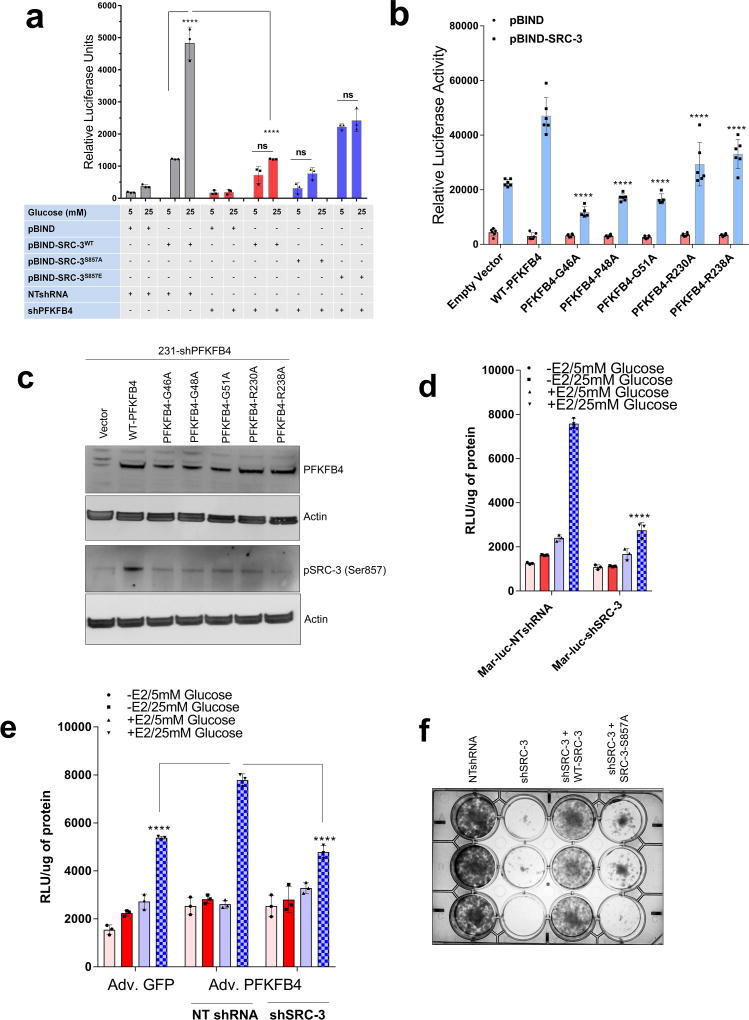
To measure the importance of this modification on the intrinsic activity of SRC-3, we transduced cancer cells with adenovirus expressing PFKFB4 (Adv. PFKFB4) or control GFP, and cultured the transduced cells in presence of normal glucose (25mM) or low glucose (5mM). Enhanced expression of PFKFB4 along with glucose stimulation significantly increased transcriptional activity of SRC-3 (pBIND-SRC-3) compared to cells cultured in low glucose conditions, suggesting PFKFB4-dependent SRC-3-phosphorylation is important for the coactivator-driven transcriptional response (Extended Data Fig. 3i). To substantiate this observation, we employed the phosphorylation-deficient pBIND-SRC-3-S857A or phosphorylation-mimic pBIND-SRC-3-S857E mutant in a similar transcriptional activation assay and found that the S857A mutant was significantly refractory to glucose-dependent PFKFB4 signaling (Fig. 2e). The S857E mutant was constitutively active even at low levels of glucose, and glucose stimulation failed to show any further activation (Extended Data Fig. 4a). Previous studies have identified several critical sites in the kinase domain of PFKFB4 important for ATP binding14. These residues G46, P48, G51, R229 and R237 when mutated to alanine significantly decrease binding affinity for ATP and results in reduced PFKFB4-kinase activity. We expressed these mutants in PFKFB4-silenced breast cancer cells and transcriptional assays confirmed significantly reduced SRC-3 activity and S857 phosphorylation (Extended Data 4b, c). Since SRC-3 is an established ER coactivator, we investigated the importance of glucose-dependent PFKFB4 signaling on ER-mediated transcriptional activity. MCF-7 cells stably expressing an estradiol (E2)-ER-dependent luciferase reporter gene (ERE-MAR-Luc cells)20 were used to assay ER activity as a function of E2 and glucose in the media. Glucose addition enhanced ER activity whereas low glucose or SRC-3 silencing significantly repressed transcriptional output in response to E2 (Extended Data Fig. 4d). Overexpression of PFKFB4 enhanced ER activity only in cells treated with E2 and glucose, whereas this PFKFB4-dependent increase in ER activity is repressed upon SRC-3 ablation (Extended Data Fig. 4e). In line with this observation, SRC-3S857A failed to rescue growth of SRC-3 depleted cells compared to WT-SRC-3 (Extended Data Fig. 4f). These findings suggest that in glycolytic breast tumors PFKFB4/SRC-3 also can hyper-activate ER activity in presence of E2 and phosphorylation of SRC-3 at S857 is a critical mark required for transcriptional responses.
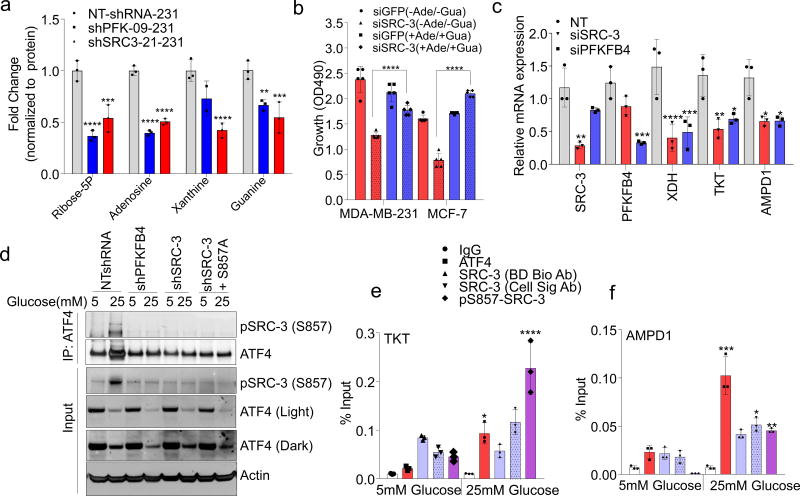
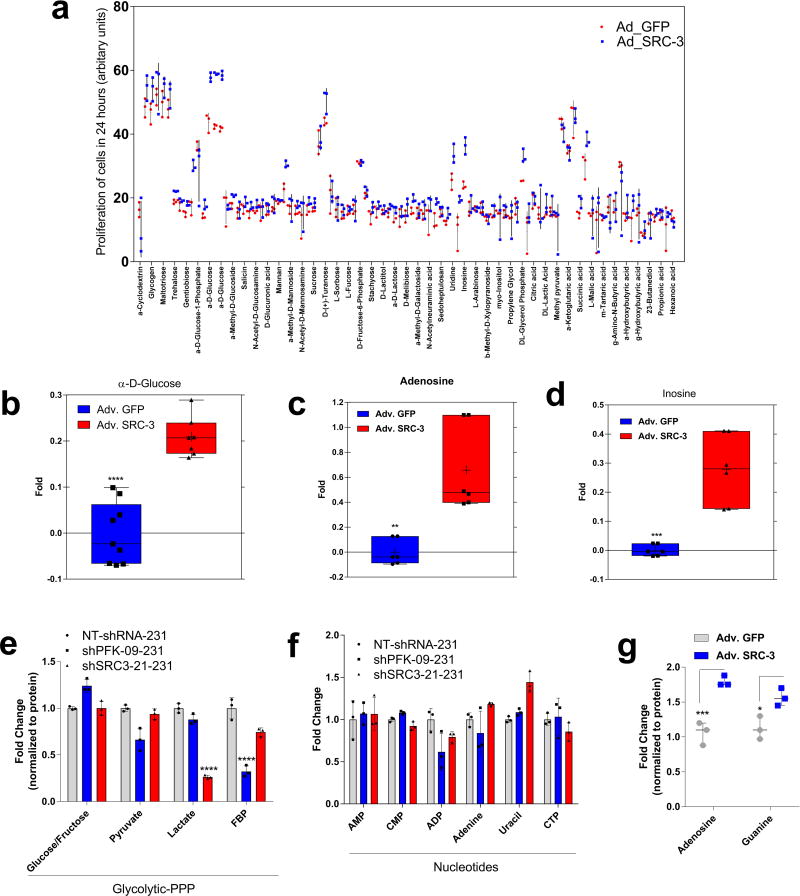
PFKFB4 is an important regulator of glucose metabolism and directs metabolic pathways required for biosynthesis of macromolecules to sustain rapid proliferation in cancer cells2. To identify the physiological role of PFKFB4-dependent SRC-3 activation in tumor metabolism, we performed an unbiased phenotypic screen to identify the metabolites that are preferentially used by SRC-3 overexpressing cells. For this we employed a phenotype microarray analysis (Biolog, Inc.)21 containing ninety three metabolites (Supplementary Table 2) arrayed in a microplate and measured in real-time the importance of these metabolites in supporting SRC-3-dependent growth. We transduced mammary epithelial MCF10A cells (with relatively low endogenous SRC-3) with adenovirus expressing GFP or SRC-3 followed by the phenotype screen for 24 hours. We identified enhanced proliferation of cells with gain-in SRC-3 expression under conditions of glucose and purines such as adenosine and inosine (Extended Data. 5a, b, c, d). To further investigate the role of SRC-3 and determine how activation by PFKFB4 affects its regulation of metabolism in breast cancer cells, we performed mass spectrometry-based metabolic profiling of MDA-MB-231 cells expressing shRNAs targeting SRC-3 or PFKFB4. Ablation of either SRC-3 or PFKFB4 significantly reduced intracellular pools of ribose-5P (R5P), and purine nucleotides and intermediates, such as adenosine, xanthine and guanine (Fig 3a and Extended Data Fig. 5e, f). Overexpression of SRC-3 in MCF10A cells also confirmed increased pools of purines (Extended Data. 5g). To measure the direct contribution of PFKFB4 and SRC-3 regulation of glucose flux towards the pentose phosphate pathway (PPP), we used isotope labeled [6-13C-glucose] to trace the carbon flow22. PFKFB4 and SRC-3 depletion significantly reduced the 13C-enrichment of Ribulose/xylulose-5P, an important intermediary metabolite in the PPP and rate-limiting precursor for purine biosynthesis (Extended Data Fig. 6a). We investigated whether exogenous addition of purines could rescue the reduced growth rate of SRC-3 deficient breast cancer cells. As expected, loss of SRC-3 suppressed growth of MDA-MB-231 and MCF-7 breast cancer cells23, whereas supplementation of purines in the culture media significantly rescued the growth defect, indicating SRC-3 expression is critical for synthesis of purines for growth (Fig. 3b).
Figure 3. SRC-3 phosphorylation by PFKFB4 enhances gene expression of metabolic enzymes.
a, Relative levels of metabolites altered by sh-PFKFB4 or sh-SRC-3 compared to control shNT in MDA-MB231 cells. [Mean ± s.d., n=3 biologically independent samples; two-way ANOVA with Tukey’s Multiple comparisons test] b, Relative proliferation of MDA-MB-231 and MCF-7 cells four days after treatment with siRNA-GFP (control) or SRC-3 under conditions indicated. [Mean ± s.d., n=5 biologically independent replicates; one-way ANOVA with Tukey’s Multiple comparisons test]. c, Expression of metabolic enzymes TKT, XDH, and AMPD1 in MDA-MB-231 cells after treatment with siRNAs-GFP (control), PFKFB4, or SRC-3. [Mean ± s.d., n=3 biologically independent samples; one-way ANOVA with Tukey’s Multiple comparisons test]. d, Immunoprecipitation of ATF4 from MDA-MB-231 cells grown in 5mM or 25mM glucose expressing shPFKFB4, shSRC-3, control- NTshRNA or expression of SRC-3-S857A in shSRC-3 cells. Levels of pSRC-3-S857 associated with ATF4 were detected by immunoblotting. IgG light chain-HRP was used to probe ATF4 in immunoblotting. e–g, Chromatin immunoprecipitation (ChIP) of ATF4, total SRC-3, and pSRC-3-S857 followed by qPCR from MDA-MB-231 cells treated with 5 mM or 25 mM glucose compared to an IgG isotype control. e, TKT. f, AMPD1. [Mean ± s.d., n=3 biologically independent samples used for ChIP; one-way ANOVA with Tukey's multiple comparisons test compared to 5 mM glucose groups]. For exact P-values please refer to source data.
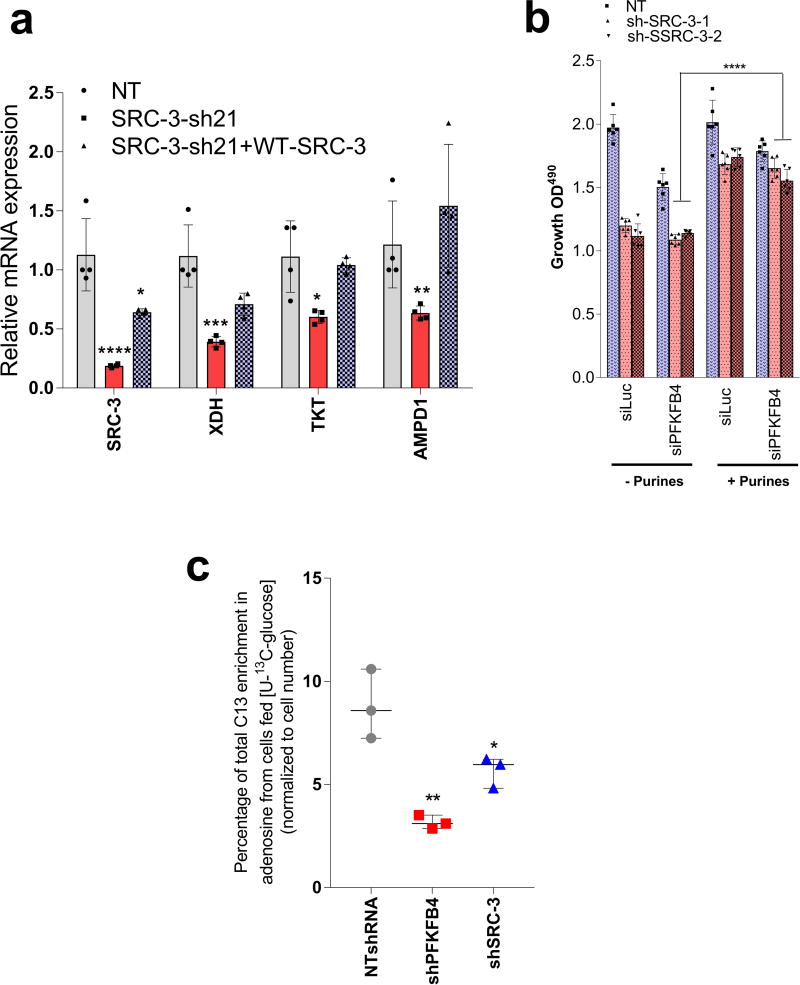
To identify the potential mechanisms of apparent SRC-3-driven purine synthesis, we performed gene expression analysis of enzymes involved in the PPP, and purine synthesis. Knockdown of SRC-3 reduced expression of transketolase (TKT), adenosine monophosphate deaminase 1 (AMPD1), and xanthine dehydrogenase (XDH) (Extended Data Fig. 6b, c). These SRC-3 target genes were also found to be regulated by PFKFB4 knockdown (Fig. 3c) and their expression was significantly enhanced in actively glycolytic breast cancer cells (Extended Data Fig. 6d). TKT is a major enzyme mediating non-oxidative PPP, whereas XDH and AMPD1 traditionally known to regulate purine catabolism are found to be regulated by SRC-324, 25. Whether the switch in roles by these reversible enzymes XDH and AMPD1 depend on tumor metabolic state needs further investigation. Similarly, [6-13C-glucose] isotope tracing experiments also confirmed reduced levels of TKT products seduheptulose-7P (S7P) and erythrose-4P (E4P) upon PFKFB4 or SRC-3 knockdown (Extended Data Fig. 6e, f). To confirm that these genes are direct targets of SRC-3, we re-expressed SRC-3 in MDA-MB-231 cells with depleted levels of endogenous SRC-3 protein (Extended Data Fig. 3g) and observed significant restoration of SRC-3 target genes (Extended Data Fig. 7a). Addition of exogenous purines also restored the primary growth defects in PFKFB4-silenced MDA-MB-231 cells (Extended Data Fig. 7b), with a decreased incorporation of [U-13C-glucose] carbon into purines (Extended Data Fig. 7c). Although the metabolic effects may or may not be directly regulated by target genes AMPD1 or XDH, our findings indicate that PFKFB4 and SRC-3 mutually cooperate to drive glucose flux towards purine generation.
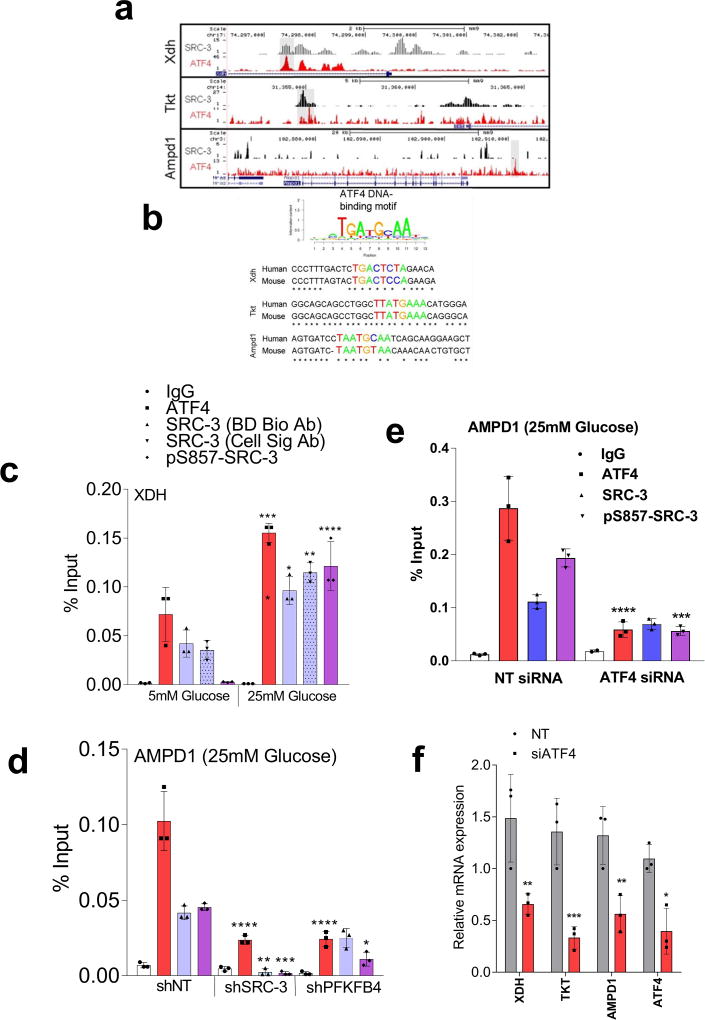
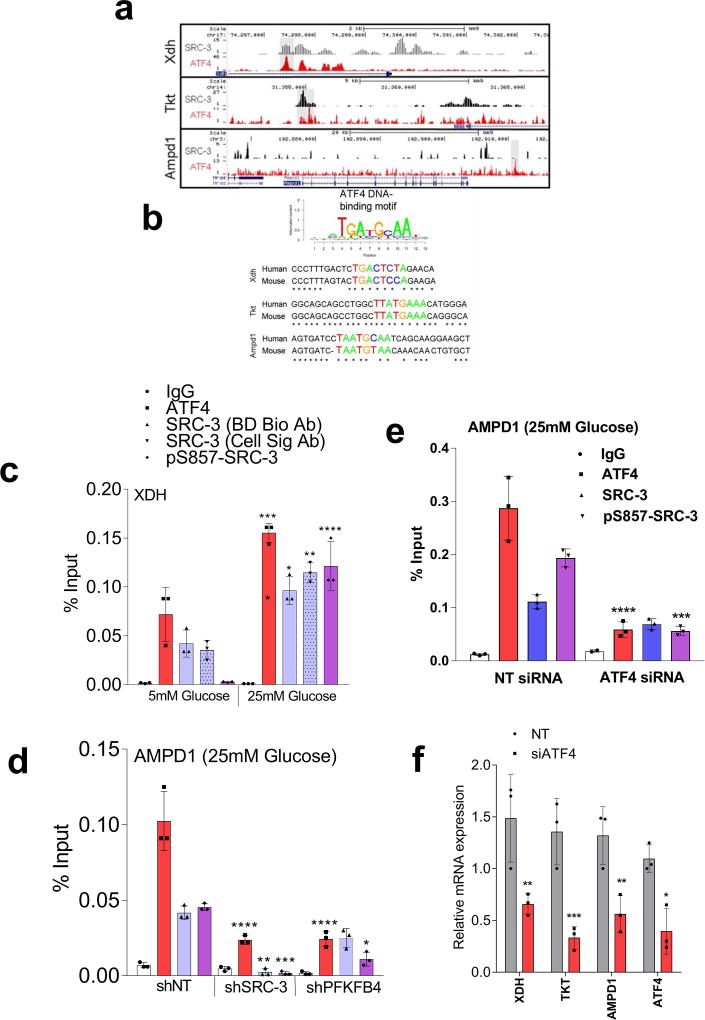
To define how PFKFB4 phosphorylation of SRC-3 impacts transcriptional regulation of the three commonly regulated purine biosynthesis genes defined above, we analyzed the chromatin occupancy of SRC-3 on the promoters of TKT, XDH and AMPD1 using an existing in silico analysis of SRC-3 chromatin immunoprecipitation sequencing (ChIP-Seq) dataset26. We identified strong overlap of SRC-3 occupancy with activating transcription factor 4 (ATF4) binding sites27 on the three target genes (Extended Data Fig 8a, b). Interestingly, ATF4 has been recently identified to promote purine synthesis in response to growth signals28. To validate whether SRC-3 interacts with ATF4, we immunoprecipitated ATF4 from MDA-MB-231 cells growing in either 25mM or 5mM glucose. Under conditions of enhanced glycolysis, interaction of ATF4 with pSRC-3-S857 increased robustly although the total ATF4 protein level was lower due to reduced nutrient stress compared to 5mM glucose treatment. However, loss of PFKFB4, SRC-3, or re-expression of SRC-3S857A in SRC-3-knockdown cancer cells greatly reduced the association (Fig. 3d). Next we performed ChIP-qPCR to measure the chromatin occupancy of ATF4, pSRC-3-S857 and SRC-3 on the target gene promoters. Breast cancer cells growing in the presence of 25mM glucose showed increased occupancy of ATF4 and pSRC-3-S857 on TKT (Fig. 3e), XDH (Extended Data Fig 8c) and AMPD1 (Fig. 3f) promoters, whereas loss of SRC-3 or PFKFB4 significantly reduced ATF4 chromatin occupancy on AMPD1 (Extended Data Fig 8d). In addition, we found SRC-3 recruitment to the gene promoters also is dependent on ATF4 as knockdown of ATF4 significantly reduced target gene expression and pSRC-3-S857 promoter occupancy (Extended Data 8e, f). These findings demonstrate that in actively glycolytic breast cancers PFKFB4-dependent phosphorylation of SRC-3 at S857 promotes interaction with the transcription factor ATF4, thereby stabilizing the complex on chromatin and driving transcription of key metabolic enzymes.
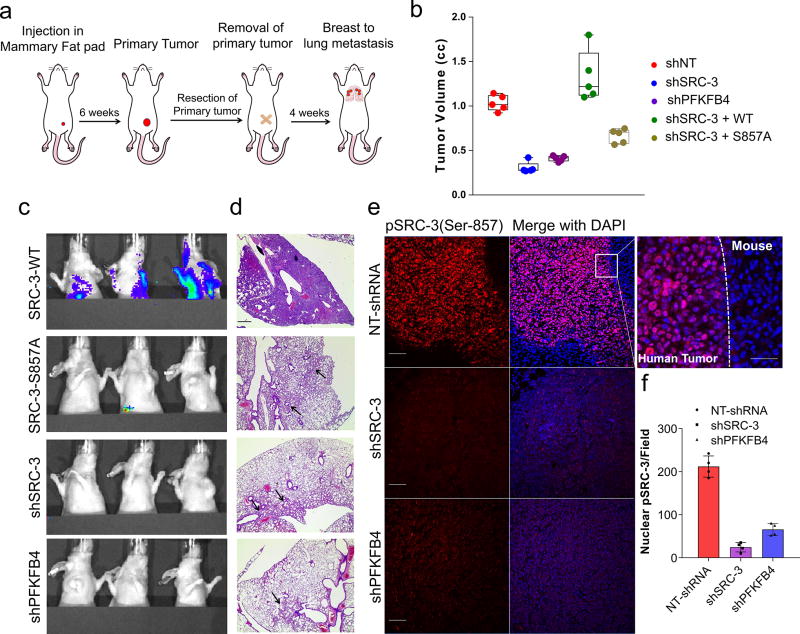
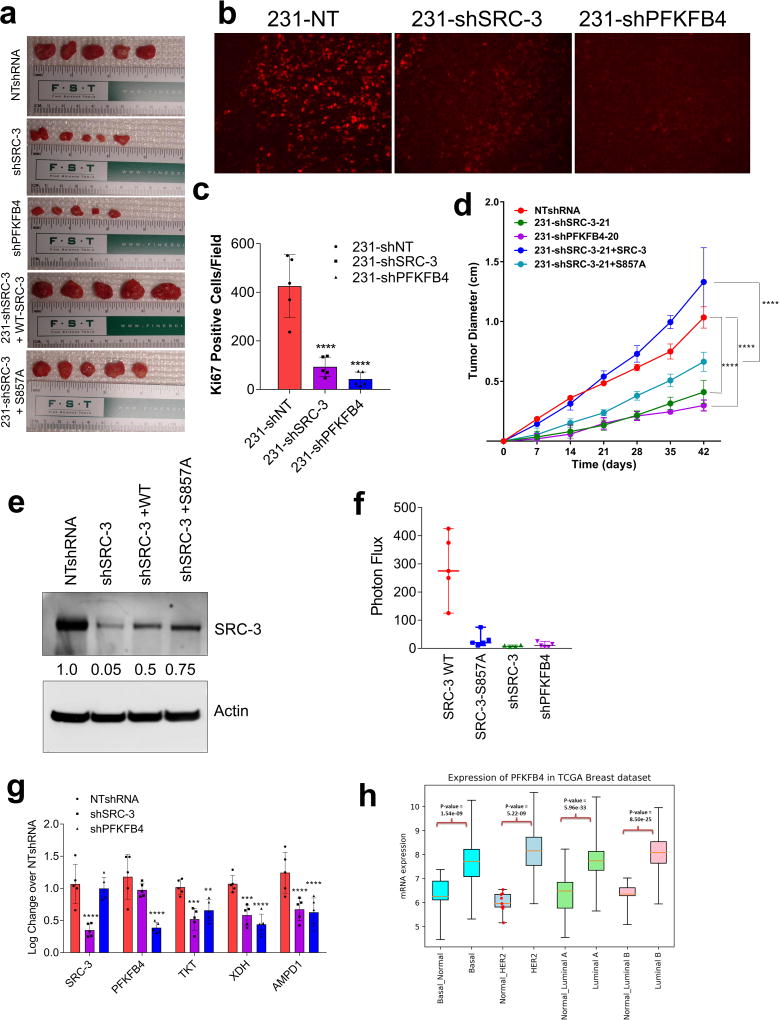
To study whether suppression of PFKFB4 or SRC-3 can affect growth of breast tumors in vivo (Fig. 4a), we implanted MDA-MB-231 cells stably expressing non-targeting shRNA (NT-shRNA), SRC-3 shRNA (shSRC-3) (Extended Data Fig. 3g) and PFKFB4 shRNA (shPFKFB4) (Fig. 2d) in the mammary fat pad of female nude mice. Compared to control mice, genetic loss of SRC-3 or PFKFB4 exhibited substantially reduced tumor growth and volume (Fig. 4b and Extended Data Fig. 9a). Immunostaining with a human Ki67 antibody showed significantly reduced proliferative cells in SRC-3 or PFKFB4 ablated tumors compared to controls (Extended Data Fig. 9b, c). In order to evaluate the functional significance of the S857 phosphorylation of SRC-3 in breast tumor progression, we stably expressed shRNA-resistant wild type (SRC-3-WT) or SRC-3S857A (SRC-3-S857A) in MDA-MB-231 cells with suppressed expression of endogenous SRC-3 protein (Extended Data Fig. 3g). Rescuing expression with the exogenous SRC-3-WT construct in SRC-3-depleted cells completely restored the growth of the breast tumors (Extended Data Fig. 9d), while the phosphorylation-deficient S857A (Extended Data Fig. 9d, e) was partially resistant to tumorigenesis six weeks after grafting the tumor cells (Fig. 4b and Extended Data Fig. 9a).
Figure 4. Activation of the PFKFB4-SRC-3 axis drives breast tumor primary growth and metastasis.
a–g, MDA-MB-231 cells stably expressing shSRC-3, shPFKFB4, or wildtype SRC-3 (WT-SRC-3) or the SRC-3 S857A mutant in the shSRC-3 cells were injected into nude female mice. a, Schematics of the in vivo orthotopic xenograft experiment. Tumor cells were injected in the mammary fat pad (n=5 mice) and after six weeks primary tumors were resected out and animals were monitored by bioluminescence. b, Tumor volume. One-way ANOVA with Tukey’s Multiple comparisons test. n=5 [Boxes represent 25th to 75th percentile, line in the middle represents median, whiskers showing min to max all points, + indicates mean.] c, Bioluminescence imaging of animals four weeks post-surgery. Representative images of three animals are shown from n=5 mice for SRC-3-WT, S857A, and shPFKFB4; and n=4 mice for shSRC-3. Residual or recurrence tumors at primary sites were masked with black paper to visualize lung lesions. d, Histology images showing lung sections stained with hematoxylin and eosin (H&E). Arrows indicate micro metastasis lesions. Scale bar 100µm. Data shown are representative of four fields per slide from n=5 animals per group. e, Immunohistochemical (IHC) images from primary tumors demonstrating pSRC-3-S857 expression (red) co-stained with DAPI (blue). Scale bar: 100 µm. Magnified image in the box shows the tumor boundary as indicated by the dotted line. Scale bar: 200 µm. f, Quantification of nuclear-stained pSRC-3-S857 in each groups. Average of four fields per slide from n=5 mice per group. [Mean (center) ± s.d. (errors), One-way ANOVA with Dunnett's multiple comparisons test.]. For exact P-values please refer to source data.
After resecting out the primary tumors, we allowed the animals to survive for four more weeks with weekly bioluminescence imaging (Fig. 4a) to evaluate metastatic potential. Animals with SRC-3-WT expressing primary tumors developed profound lung metastasis with morbid hunched back posture, whereas suppression of SRC-3 or PFKFB4 or expression of the SRC-3S857A phosphorylation-deficient mutant all showed markedly reduced lung lesions (Fig. 4c, Extended Data Fig. 9f). Pathological analysis identified only a few micro-metastatic lesions in the lungs of animals with SRC-3S857A, or SRC-3 and PFKFB4-ablated primary tumors (Fig. 4d) with no observed health issues during the four weeks following surgery. These findings demonstrate that SRC-3 and PFKFB4 are drivers of basal-subtype breast tumor growth and that phosphorylation of SRC-3 at the S857 site is critical for metastatic progression of the disease. Immunostaining of the primary tumors with pSRC-3-S857 antibody detected increased nuclear localized human SRC-3 in the tumors harvested from WT-SRC-3 animals that progressed to aggressive metastatic disease, whereas PFKFB4 or SRC-3 ablated tumors had significantly reduced nuclear staining (Fig. 4e, f). Nuclear localized pSRC-3-S857 represents active-SRC-3 in the tumor that in turn promotes target gene expression to maintain tumor growth and metastasis. Importantly, this single phosphorylation site modification was also found to be an indicator of tumor metastasis mediated by ERK3 in a previous study29. Taken together our data demonstrate that PFKFB4-SRC-3 signaling axis promotes tumor cell proliferation by increasing purine synthesis (Extended Data Fig. 9g) which may also serve as a critical determinant of metastatic progression of the disease.
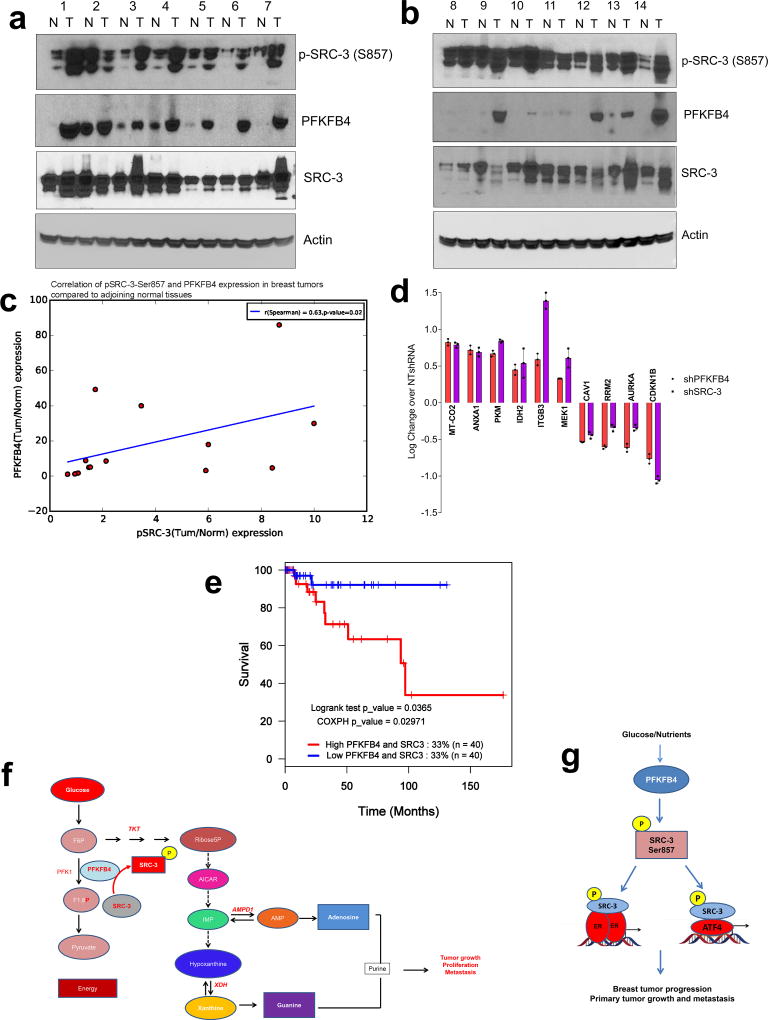
In an attempt to identify the clinical implications of this axis, we first analyzed expression of PFKFB4 in The Cancer Genome Atlas (TCGA) database and found its expression to be significantly enhanced across all the subtypes of breast cancer (Extended Data Fig. 9h). Since SRC-3 is an ER coactivator, we analyzed expression of pSRC-3-S857 and PFKFB4 in ER-positive primary breast tumors and adjacent normal tissues. Our data show elevated levels of pSRC-3-S857, PFKFB4 and SRC-3 in the majority of tumors compared to normal tissues (Extended Data Fig. 10a, b), and a significant correlation between pSRC-3-S857 and PFKFB4 levels (r=0.63, Extended Data Fig. 10c). Since PFKFB4 expression also is elevated in other breast tumor subtypes we performed protein array analyses using MDA-MB-231cell lysates with suppressed expression of SRC-3 or PFKFB4 protein, and compared the significantly altered protein targets to the control NT-shRNA. Our study identified a common proteomic signature by intersecting the significant proteins affected by ‘both’ SRC-3 and PFKFB4 knockdown (Extended Data Fig. 10d). Imposing the restriction of protein-changes in the ‘same direction’ we evaluated the correlation of the common PFKFB4/SRC-3 proteomic signature with patient survival in a cohort of breast cancer patient specimens for which clinical information was available. We identified that the PFKFB4-SRC-3 common proteomic signature also is associated with a decreased likelihood of survival in a basal-like-subtype triple negative patient cohort (Extended Data Fig. 10e). These clinical associations are compatible with our in vivo experimental observations substantiating that the PFKFB4-SRC-3 axis is a molecular powerhouse that propels breast tumorigenesis leading it to an aggressive metastatic disease.
Herein we have uncovered a novel interplay between the glycolytic pathway and the oncogenic activation of the transcriptional coactivator SRC-3. Warburg effect is known to be one of the most dominant sugar metabolic pathways across cancers generating energy and macromolecules to sustain rapid proliferation and tumor growth. We now find that a glycolytic stimulator, the bifunctional enzyme PFKFB4, also can operate as a protein kinase, at least in actively glycolytic tumors. Upon glucose uptake PFKFB4 catalyzes the synthesis of F2,6BP from F6P and ATP; and our study revealed that under these conditions PFKFB4 also can phosphorylate SRC-3 at S857. Phosphorylation of SRC-3 at S857 rapidly increases its transcriptional activity and promotes synthesis of genes for driving glucose flux towards purine synthesis (Extended Data Fig. 10f). PFKFB4-SRC-3 axis was found to be enriched in ER-positive breast tumors, and was also identified to promote a common proteomic signature that correlates with worse outcomes in triple negative breast cancer patients thereby driving an aggressive metastatic disease (Extended Data Fig. 10g). Our work suggests that targeting the PFKFB4-SRC-3 axis may be therapeutically valuable in breast tumors that are notably dependent on glucose metabolism.
Methods
Vectors and virus production
Commercially-available shRNAs targeting the 3′ UTR region of the PFKFB4 (TRCN0000199909-sh09 and TRCN0000199820-sh20) and SRC-3/NCOA-3 (TRCN0000370321-sh21 and TRCN0000365196-sh96) were obtained from Sigma. Lentiviruses were produced by transient transfection using Lipofectamine 2000 (Life Technologies) into 293T cells along with pMD2.G (a gift from Didier Trono- Addgene plasmid # 12259) and psPAX2 (a gift from Didier Trono- Addgene plasmid # 12260), and the viral supernatants were collected after 48 hours followed by precipitation and purification using PEG-it Virus Concentration Solution (System Bioscience)30. The construct expressing the Gal4 responsive luciferase reporter (pG5-luc) was obtained from Promega, and the pBIND-SRC-3 was generated by inserting an in-frame fusion between the GAL4 DNA binding domain and the open reading frame of human SRC-3, as described previously12. The pBIND-SRC-3-S857A31 and pBIND-SRC-3-S857E mutant was generated using the QuikChange Lightening site-directed mutagenesis kit, as described earlier31. The GST-SRC-3 fragment constructs were obtained by cloning portions of the SRC-3 in-frame with GST. The N-terminus bHLH (aa 1–320), Serine/Threonine (S/T) (aa 321–580), RID (aa 581–840), CID (aa 841–1080), and HAT (aa 1081–1421) were generated as described previously7. The expression plasmid encoding SRC-3 with a C-terminal FLAG tag was cloned into pSG5-FLAG (WT-SRC-3), and the point mutation of serine 857 to alanine (S857A) was generated by site-directed mutagenesis of WT-SRC-3 and GST-SRC-3-CID constructs13, 29. The human PFKFB4 cDNA (NM_004567.3) was obtained from Origene (Cat#RC201573). The PFKFB4 mutants G46A, P48A, G51A, R230A and R238A were generated by site-directed mutagenesis. All constructs were verified by Sanger sequencing. The siGENOME siRNA against PFKFB4, SRC-3 and ATF4 were obtained from Dharmacon.
| PFKFB4-sh09 | TRCN0000199909 | CCGGGCTGATTGGCTGCCACATTTCCTCGAGGAAATGTGGCAGCCAATCAGCTTTTTTG |
| PFKFB4-sh20 | TRCN0000199820 | CCGGGCGCAGCTCTTAGGTGTTCACCTCGAGGTGAACACCTAAGAGCTGCGCTTTTTTG |
| SRC-3-sh21 | TRCN0000370321 | CCGGTGACACTGCACTAGGATTATTCTCGAGAATAATCCTAGTGCAGTGTCATTTTTG |
| SRC-3-sh96 | TRCN0000365196 | CCGGTTCCACCTCCTAGGGATATAACTCGAGTTATATCCCTAGGAGGTGGAATTTTTG |
Cell culture
HeLa, HEK293T, MDA-MB-231, MCF-7 and MCF-7-ERE-MAR-Luc cells were cultured in DMEM (Gibco) supplemented with 10% FBS; SK-BR-3 cells were grown in McCoy’s media with 10% FBS; and MCF-10A cells in DMEM/F12 (Gibco) supplemented with 5% horse serum, epidermal growth factor (EGF), hydrocortisone, cholera toxin and insulin. All cell lines were incubated at 37°C and 5% CO2. Cell lines were obtained from ATCC, and maintained and yearly tested for mycoplasma contamination by the Tissue Culture Core, Baylor College of Medicine (BCM).
Stable cells expressing shRNAs were generated by lentiviral transduction in presence of polybrene (8µg/mL). Polyclonal pooled populations of stable cells were selected in the presence of puromycin (1 µg/ml) for more than 3 passages before initiating any functional experiments.
Human Kinome Library Screen
A high-throughput RNAi screen was performed using the Stealth RNAi human kinase library (Life Technologies) targeting each 636 human kinases with three individual siRNAs directed at different regions of the gene that were arrayed in twenty six 96-well plates. To identify the kinases that modulate SRC-3 transcriptional activity, we reverse co-transfected HeLa cells with pBIND or pBIND-SRC-3 (2ng/96-well) along with pG5luc firefly-luciferase reporter (100ng/96-well), and control siRNA targeting GFP (siGFP) or siRNAs targeting kinases (40nM). The mixture was incubated with 0.75µL/96-well of Lipofectamine 2000 for 20minutes followed by addition of HeLa cell-suspension (12,500 cell/96-well) in complete growth medium (DMEM + 10% FBS) on top. After 48 hours of culture, plates were carefully washed with PBS and luminescence reading was recorded in luminometer (Berthold Inc.) using the Dual-Luciferase Assay System (Promega). Additional wells present on all plates had appropriate controls containing cells transfected with pBIND and siRNA targeting GFP (siGFP), or pBIND-SRC-3 and siGFP along with reporter plasmid. SRC-3 transcriptional activity was calculated by comparing the relative luciferase units (RLU) of pBIND-SRC-3 to pBIND readings transfected with siGFP. Firefly luciferase reading from each well was normalized to its Renilla reading (pBIND-vector backbone contains the Renilla luciferase gene) to adjust the variations in transfection efficiency. The fold change in SRC-3 activity upon suppression of kinases was calculated by comparing data to siGFP readings, followed by robust z-score analysis to identify kinases that either increase or decrease SRC-3 activity more than 2 SD above or below control siGFP (pBIND-SRC-3 + siGFP) treatment. Fold change values were converted to log2 for each Set of siRNA and then graphed in 3D plot.
Cell Proliferation Assays
Cells were transfected with indicated siRNAs and were seeded at a density of 3,000 cells/96-well in complete growth medium. For rescue experiment, cells were seeded in complete growth media supplemented with dialyzed serum with or without purines (10µM adenosine, Sigma and 10µM guanosine, Sigma). After 4 days, cells were stained with CellTiter96 (Promega) reagent followed by measurement of absorbance at 490nm. For the clonogenic survival assays, 1000 cells per well were plated onto a 6-well plate, and were incubated for 7 days, and stained with crystal violet. The medium was changed every two days.
In vitro phosphorylation assays
The full length SRC-3-FLAG protein was expressed in Sf9 cells and purified using anti-Flag antibody beads13. The SRC-3 fragments were expressed as GST-fusion proteins in E. coli and purified using a GST-fusion protein purification kit (Life Technologies) following the manufacturer’s protocol. Each reaction of in vitro phosphorylation assay was carried out with varying concentration of purified recombinant GST-PFKFB4 protein (SignalChem) (0.1–1µg) along with SRC-3 (0.25µg) as substrate, cold ATP (0.2mM) or 5µCi [γ-32P]ATP (Perkin Elmer), and 1X kinase buffer (Cell Signaling) in a total volume of 30µL. The reaction was carried out at 30°C for 30 minutes and then stopped by adding 10 µl of 4 X SDS sample buffer. Proteins were resolved by SDS-PAGE gel, stained with Coomassie Brilliant Blue (Bio-Rad), and visualized by autoradiography or probed with anti-Ser/Thr antibody (BD Biosciences). For mass spectrometric (MS) identification of phosphorylation sites, the GST-SRC-3-CID protein was used as a substrate for the kinase reaction along with cold ATP and PFKFB4 enzyme followed by separation by SDS-PAGE and staining with Coomassie blue. Gel lanes were sliced into different bands and in-gel digested overnight at 37°C with trypsin. After digestion, peptides were extracted twice in 200 µL of acetonitrile with re-suspension in 20 µL of 2% formic acid prior to second extraction, dried in a Savant SpeedVac, and dissolved in a 5% methanol/0.1% formic acid solution. The samples were then subjected to MS separation to detect phosphorylated residues.
Cell culture treatment conditions, protein isolation and immunoblotting
For siRNA treatments cells were lysed 72 hours post-transfection. Stable cells were grown untill 80% confluency before protein was extracted. During nutritional stress conditions, stable cells were cultured in complete media untill 80% confluency, followed by a brief starvation (3 hours) in glucose-free growth medium. Cells were then switched to DMEM (−) glucose supplemented with 10% dialyzed serum and 5mM or 25 mM glucose, as indicated in the figures, for 24 hours before cells were lysed. For glucose withdrawal, cells were cultured in 25mM for 24 hours and then switched to media containing 5mM glucose for additional 6 hours. For FBP treatment, glucose starved cells were pre-treated with Streptolysin O (Sigma, Cat# S5265) at a concentration of 10µM to permeabilize the cells, followed by addition of FBP (Santa Cruz, Cat# sc-214805) as described previously19. Immunoblotting was performed as described previously30. Briefly, cells were lysed using NP-40 lysis buffer (Life Technologies) along with protease and phosphatase inhibitor cocktail (Millipore). Total protein was estimated using a BCA-protein estimation kit (Pierce) and approximately 40µg of proteins were separated by 4–12% Bis-Tris gels (Life Technology) and electroblotted onto nitrocellulose membranes using the iBlot system (Life Technology). Blots were blocked for 2 hours at room temperature or overnight at 4°C in 1 X TBS buffer (Biorad, CA) supplemented with 0.1% Tween-20 (Sigma) and either 5% bovine serum albumin (BSA) or 5% non-fat dry milk (Biorad, CA). Blots were incubated overnight at 4°C with primary antibody diluted into TBST containing 1% BSA or 5% non-fat dry milk. Blots were subsequently washed three times for 10 min in TBST and incubated with secondary antibody coupled to horseradish peroxidase (Promega). Blots were washed as previously described, reacted with ECL reagents (Thermo Scientific) and detected by chemi-luminescence (UVP Biospectrum).
Antibodies used for immunoblotting in the study are: mouse monoclonal SRC-3 (Cat# 611105, BD Biosciences), rabbit monoclonal SRC-3 (Cat# 2126, Cell Signaling), FLAG (Cat# F3165, Sigma-Aldrich), mouse phosphoSerine/Threonine (Cat# 612548, BD Biosciences), rabbit PFKFB4 (Cat# 137785 and 71622, Abcam), mouse PFKFB4 (Cat# TA500809, Origene), rabbit monoclonal ATF4 (Cat# 11815, Cell Signaling), and β-actin conjugated to HRP (Cat# A3854, Sigma-Aldrich). The phospho-SRC-3 (Ser857) rabbit monoclonal antibody was produced by immunizing animals with a synthetic peptide containing phosphorylated Ser857 of human SRC-3. This antibody (Clone 10A6) was a kind gift from Cell Signaling Technology, Inc.
Immunoprecipitations
293T cultured in 100mm dishes until 80% confluency was transfected with FLAG-SRC-3 followed by infection with adenovirus PFKFB4 (Signagen Laboratories). Twenty-four hours post-infection media was changed and cells were incubated overnight in different concentrations of glucose (5, 10, 15, and 25mM) in DMEM (−) glucose medium supplemented with 10% dialyzed-FBS. For MDA-MB-231 cells, stable cells expressing shRNAs targeting PFKFB4, SRC-3 or expression of S857A in SRC-3 depleted cells were grown in 5mM or 25mM glucose. Cells were lysed in NP-40 lysis buffer (Invitrogen) supplemented with protease and phosphatase inhibitor cocktail (Millipore). For co-immunoprecipitations, lysates were precleared with control Protein A/G Agarose beads (Pierce). Five hundred micrograms of protein were then used for pulldown assays using monoclonal anti-FLAG (Cat#F3165, Sigma) or anti-phosho-Ser/Thr antibody (BD Biosciences) overnight. The beads were then captured, washed and immunoprecipitated proteins were eluted and subjected to immunoblotting, along with 2% input sample run in parallel. For ATF4 pull down, anti-ATF4 (Cat# 11815, Cell Signaling) was used at a 1:250 dilutions to pull down ATF4. Light chain specific anti-rabbit secondary antibody conjugated to HRP (Jackson Immunoresearch, 1:5000) was used to detect ATF4 in immunoblotting following immunoprecipitation to avoid overlap with IgG-heavy chain
Immunohistochemistry
Immunohistochemistry was performed as described previously30. Mouse monoclonal anti-human Ki-67 antibody MIB-1 (Dako) and rabbit monoclonal anti-phospho-SRC-3 (Ser857) (Cell Signaling) were used to stain the lung sections followed by anti-mouse or anti-rabbit Alexa-594 secondary antibody (Molecular Probes).
Gene Expression Analyses
Total RNA was isolated from cancer cells or tumors using the RNeasy Kit (QIAGEN). Reverse transcription was carried out using a Superscript VILO cDNA synthesis kit (Invitrogen, CA) according to the manufacturer's instructions. For gene expression analysis, qPCR was performed using the Taqman system (Roche) with sequence-specific primers and the Universal Probe Library (Roche). β-actin was used as an internal control. Melt curve analysis was performed to ensure that a single PCR product was produced in a given well. We used 3 biological replicates for each treatment group. Data was analyzed using the comparative Ct method (ΔΔCt).
Targeted TCA, glycolysis, pentose phosphate pathway and nucleotide synthesis intermediary metabolite analysis using liquid chromatography-mass spectrometry
Sample preparation for mass spectrometric analysis: the metabolome extraction method described earlier was used for the cell lines in this study30, 32. Briefly, cells were thawed at 4°C and subjected to freeze-thaw cycle in liquid nitrogen three times to rupture the cell membrane. Following this, a 750 µL of ice cold methanol: water (4:1) containing 20 µL of spiked internal standard was added to each cell line. The cells were homogenized for 1 min (30 sec pulse twice) and mixed with 450 µl of ice-cold chloroform and vortex mixed in a Multi-Tube Vortexer for 10 min. The resulting homogenate was mixed with 150 µl of ice-cold water and vortexed again for 2 min. The homogenate was incubated at −20°C for 20 min and centrifuged at 4°C for 10 min to partition the aqueous and organic layers. The aqueous and organic layers were separated and dried at 37°C for 45 min in an Automatic Environmental Speed Vac® system (Thermo Fisher Scientific). The aqueous extract was reconstituted in 500 µl of ice-cold methanol:water (50:50) and filtered through 3 KDa molecular filter (Amicon Ultracel −3K Membrane, Millipore Corporation) at 4°C for 90 min to remove proteins. The filtrate was dried at 37°C for 45 min in a speed vac and stored at −80°C until mass spectrometry analysis. Prior to mass spectrometry analysis, the dried extract was re-suspended in 100 µL of methanol:water (50:50) containing 0.1% formic acid and analyzed using multiple reaction monitoring (MRM).
Liquid Chromatography- Mass spectrometry HPLC analysis was performed using an Agilent 1290 series HPLC system equipped with a degasser, binary pump, thermostatted auto sampler and column oven (all from Agilent Technologies). The MRM-based measurement of relative metabolite levels were used for normal phase chromatographic separation. All samples were kept at 4°C, and 5 ul of the sample was used for analysis.
Separation of TCA, glycolysis and pentose phosphate associated metabolites
The normal phase chromatographic separation was also used for targeted identification of metabolites. This analysis employed solvents containing water (solvent A), with solvent A modified by the addition of 5mM Ammonium acetate (pH 9.9), and 100% acetonitrile (ACN) solvent B). The binary pump flow rate was 0.2 ml/min with a gradient spanning 80 % B to 2 % B over a 20-minute period followed by 2% B to 80% B for a 5-min period and followed by 80% B for 13-minute time period. The flow rate was gradually increased during the separation from 0.2 mL/min (0–20 mins), 0.3 mL/min (20.1–25 min), 0.35 mL/min (25–30 min), 0.4 mL/min (30–37.99 min) and finally set at 0.2 mL/min (5 min). Metabolites were separated on a Luna Amino (NH2) column (4µm, 100A 2.1×150mm, Phenominex) that was maintained in a temperature controlled chamber (37°C). All the columns used in this study were washed and reconditioned after every 50 injections. Ten microliters were injected and analyzed using a 6495 QQQ triple quadrupole mass spectrometer (Agilent Technologies) coupled to a 1290 series HPLC system via Selected Reaction Monitoring (SRM). Metabolites were measured using negative ionization mode with an ESI voltage of −3500 ev, respectively. Approximately 9–12 data points were acquired per detected metabolite.
Separation of nucleotides
For measurement of nucleotides and deoxy-nucleotides prior to mass spectrometry analysis, the dried extract was suspended in 50 µL of methanol: water (50:50) containing 0.1% formic acid. Samples were delivered to the MS via reverse phase chromatography using a RRHD SB-CN column (1.8 µm, 3.0 × 100 mm, Agilent Technologies) at 300 µl/min. Gradient spanning 2% B to 98% B over a 15-minute period followed by 98% B to 2% B for a 1-minute period. Then gradient is continued for a 4-minute time period to re-equilibrate the column. Buffers A and B were comprised of 0.1% formic acid in water and acetonitrile, respectively.
Ten microliters were injected and analyzed using a 6495 QQQ triple quadrupole mass spectrometer (Agilent Technologies) coupled to a 1290 series HPLC system via Selected Reaction Monitoring (SRM). Metabolites were measured using positive ionization mode with an ESI voltage of +4000 ev, respectively. Approximately 9–12 data points were acquired per detected metabolite.
Isotope labeling and profiling by targeted MS
Glucose labeled with 13C: [6-C13glucose] and [U-C13glucose] were purchased from Cambridge Isotope Laboratories. MDA-MB231 cells were grown in 10cm-dishes in regular media until 80% confluence, followed by brief (3hours) starvation and then addition of 25mM of [6-C13]glucose supplemented with DMEM[−]glucose media with 10% dialyzed FBS and 1% PS33. For [U-C13glucose], cells were fed with steady state isotope tracers for 48 hours and medium was replaced 2h before metabolome collection and/or isotope tracer addition. Culture medium was collected, cells were washed with PBS, and counted from each treatment were snap-frozen with liquid nitrogen. Cells were scraped into a 0.5-ml mixture of 1:1 water/methanol, sonicated for 1 minute (two 30-second pulses), and then mixed with 450 µl ice-cold chloroform. The resulting homogenate was then mixed with ice-cold water and vortexed again for 2 minutes. The homogenate was incubated at −20°C and centrifuged at 4°C for 10 minutes to partition the aqueous and organic layers. The aqueous and organic layers were combined and dried at 37°C for 45 minutes in an automatic Environmental Speed Vac system (Thermo Fisher Scientific). The extract was reconstituted in a 500-µl solution of ice-cold methanol/water (1:1) and filtered through a 3-kDa molecular filter (Amicon Ultracel 3-kDa Membrane) at 4°C for 90 minutes to remove proteins. The filtrate was dried at 37°C for 45 minutes in a speed vacuum and stored at −80°C until MS analysis. Prior to MS analysis, the dried extract was resuspended in a 50-µl solution of methanol/water (1:1) containing 0.1% formic acid and then analyzed using multiple reaction monitoring (MRM). Ten microliters was injected and analyzed using a 6490 QQQ triple quadrupole mass spectrometer (Agilent Technologies) coupled to a 1290 Series HPLC system via selected reaction monitoring (SRM). Metabolites were targeted in both positive and negative ion modes: the electrospray source ionization (ESI) voltage was +4,000 V in positive ion mode and −3,500 V in negative ion mode. Approximately 9 to 12 data points were acquired per detected metabolite. To target the TCA flux, the samples were delivered to the mass spectrometer via normal-phase chromatography using a Luna Amino column (4 µm, 100A 2.1 × 150 mm). To target the fatty acid flux, the samples were delivered to the mass spectrometer via reverse-phase chromatography using a Phenyl Hexyl column (3 µm, 100A 2.1 × 150 mm). For 13C-labeled experiments, SRM was performed for expected 13C incorporation in various forms for targeted LC-MS/MS. Mass isotopomer distribution (MID) was calculated and corrected for natural abundance.
Proximity Ligation Assay (PLA)
Interaction between endogenous SRC-3 and PFKFB4 was detected using the PLA technique34 using Duolink In Situ Red Starter Kit Mouse/Rabbit (Cat# DUO92101, Sigma) according to manufacturer’s instructions. Briefly, MDA-MB-231 cells were seeded in 35 mm glass bottom culture dish (Cat# P35G-0-14C, MatTek Corporation), and after reaching 80% confluency, cells were fixed followed by blocking for 1 hour using the Duolink Blocking Solution at 37°C. Cells were then incubated in presence of primary antibodies: SRC-3 (Rabbit Monoclonal, Cell Signaling) and PFKFB4 (Mouse Monoclonal, Origene), either alone or in combination. Following incubation, cells were washed and Duolink PLA PLUS and MINUS probes were added for 1 hour at 37°C. After washing off the unbound probes, cells were incubated first with the ligase enzyme followed by DNA polymerase enzyme to amplify the DNA circle. Finally cells were mounted using Duolink in Situ Mounting Media with DAPI, and analyzed by microscopy. Images were obtained using Zeiss Axio Observer A1 inverted microscope with N-Achroplan 100×/1.25 oil lens, Zeiss MRC5 camera, and AxioVision Rel.4.8 software.
Analysis of ATF4 and SRC-3 cistromes and motif analysis of ATF4 bound sequences
Due to the lack of ATF4 and SRC-3 ChIP-Seq datasets in breast cancer cell lines, we compared an in-house SRC-3 ChIP-Seq dataset of mouse liver26, with a previously published ATF4 ChIP-Seq data in mouse embryonic fibroblasts27. Even though this comparison is less than ideal as SRC-3 and ATF4 ChIP-Seq was performed in different tissues, the co-localization of SRC-3 and ATF4 cistromes even in different tissues, nevertheless, argues for interplay between them, a finding subsequently confirmed by co-IP and ChIP-qPCR assay in human breast cancer cell lines. ATF4 binding motifs in the promoter regions of XDH, TKT and AMPD1 genes were discovered using the MISP (Motif-based Interval Screener with PSSM) toolbox in Galaxy Cistrome with a p-value cut-off of 0.005. The consensus ATF4 binding motif used as input is TGATGCAA.
Chromatin immunoprecipitation (ChIP)
The following antibodies were used for ChIP: SRC-3 (Cell Signaling or BD Biosciences), ATF4 (Santa Cruz C-20, and Cat# 11815 Cell Signaling), pSRC-3-S857 (Cell Signaling), and rabbit IgG. ChIP assays were performed according to an EZ ChIP kit (Millipore) with some modification35. Briefly, MDA-MB-231 cells were grown in 15 cm dishes until 80% confluent. For glucose stimulation, cells were glucose-deprived for 3 hours by incubating in glucose-free DMEM supplemented with 10% FBS, followed by 4 hours stimulation with 5mM or 25mM glucose. Cells were crosslinked in 1% formaldehyde and quenched with 125mM glycine. Chromatin was sheared by sonication using a Branson Sonifier, precleared with control IgG antibodies and agarose beads (Millipore), and then immunoprecipitated with IgG (control), SRC-3, pSRC-3-S857 and ATF4 antibodies. DNA fragments were eluted from beads followed by reverse-crosslinking and purified DNA was used in qPCR reactions using SYBR green (Applied Biosytems) to determine the promoter occupancy. Melt curve analysis was performed to verify all SYBR green reactions produced a single PCR product.
Luciferase Assays
Luciferase assays were performed from whole cell lysates made in Cell Culture Lysis reagent (Promega) using the Luciferase Reporter Assay (Promega) and a Berthold 96-well plate reader. Luciferase values were normalized to the total protein level.
Metabolomic Phenotyping Microarrays
Screening was performed using 96-well plate phenotype microarrays (Biolog, Inc.) containing 88 different carbon substrates and 5 nucleotides as the energy source21. MCF10A cells were infected with either adenovirus (Ad- GFP or Ad-SRC-3) and seeded at an initial density of 2x10⁴ cells per well in triplicate. Biolog Redox Dye Mix MA was added to each well according to the manufacturer's instructions, and kinetic usage of the metabolites was monitored using the GEN III OmniLog ID System (Biolog, Inc.).
Human Breast Tumors
The breast tumors and adjoining normal tissue was obtained from the Lester and Sue Smith Breast Center at Baylor College of Medicine according to the Institutional Research Board approved protocol #H-7900. Whole cell lysates from a total of 14 human breast tumors that are ER(+) primary tumors, along with matched normal tissues, were used to detect pSRC-3-Ser857, SRC-3, and PFKFB4 levels by immunoblotting.
Determining a Common PFKFB4/SRC3 Proteomic Signature
Protein lysates from MDA-MB-231 cells stably expressing shRNAs targeting SRC-3 or PFKFB4 were used for protein array analysis as described before36. Expression of proteins significantly altered due to the ablation of PFKFB4 and SRC-3 over NTshRNA were determined using a parametric t-test as implemented in the python (spicy) statistical system. Significance was assessed for p<0.05, fold change exceeding 1.25x, and normalized signal levels exceeding 200 units. A common proteomic signature was determined by intersecting the significant proteins affected by each treatment, and imposing the restriction that the protein changes are in the same direction.
Association of the PFKFB4/SRC-3 Proteomic Signature in Human Basal Breast Cancer
We evaluated the association of the common PFKFB4/SRC-3 proteomic signature with patient survival in a cohort of primary Basal Breast Cancer patient specimens collected by The Cancer Genome Atlas (TCGA) for which clinical information has been collected37. We first subsetted the proteins measured using the array by TCGA. Next, for each protein in the PFKFB4/SRC-3 common proteomic signature and for each Basal Breast Cancer specimen, we computed the z-score for its expression within the patient cohort. We then computed the sum of the z-scores for each specimen. Specifically, the z-scores of the proteins suppressed by PFKFB4/SRC-3 (i.e. upregulated by shPFKFB4/shSRC-3) were subtracted from the z-scores of the proteins induced by PFKFB4 (i.e. down-regulated by shPFKFB4/shSRC-3); this resulted in an activity score of the PFKFB4/SRC-3 common proteomic signature, respectively, for each specimen. After computing the activity scores, we further partitioned the patient cohort in specimens with a high activity score (top 33% of the specimens) and specimens with a low activity score (bottom 33% of the specimens) for the corresponding signatures. We considered significant association with survival using the log-rank test (p<0.05) and the Cox proportional hazard test (p<0.05) available via the package survival as implemented in the R statistical system.
Tumorigenicity and metastasis assays
All animal experiments were carried out in accordance with a protocol approved by the Baylor College of Medicine Institutional Animal Care and Use Committee and experiments were terminated once maximal tumor volumes are reached (10% of the animal body weight). MDA-MB-231 breast cancer cells stably expressing luciferase were individually transduced with shRNAs targeting SRC-3 (shSRC-3) and PFKFB4 (shPFKFB4). For the rescue experiment, SRC-3 ablated tumor cells were used to restore either the levels of WT-SRC-3 or SRC-3-S857A and polyclonal pooled population was selected. Approximately 2.5 × 10⁵ cells were injected at orthotopic site along with Matrigel (BD Biosciences) (1:1 volume) in the mammary fat pad of 5–6 week-old female athymic nude Foxn1-nu mice (Envigo). The mammary tumor length (L) and width (W) were measured with a caliper. Tumor volumes were calculated using the formula L∗W2∗π/6. After six weeks, tumors were resected out by surgery and the animals were monitored for lung metastasis progression every week and quantified using noninvasive bioluminescence measurement with IVIS Lumina II equipment. Four weeks after tumor resection animals were sacrificed and tissues were harvested and fixed in 4% PFA. Paraffin-embedded lung samples were also subjected to haematoxylin and eosin (H&E) staining to reveal the size and number of lung macro or micro-metastases. The experiments were not randomized and the investigators were not blinded to allocation during experiments and outcome assessment. No statistical methods were used to predetermine sample size estimate.
Statistics
Unless otherwise indicated, all results represent the mean ± SD, and statistical comparisons between different groups were performed using the two-tailed Student’s t test, one-way or two-way ANOVA with appropriate multiple comparisons corrections. For all statistical analyses, differences of p ≤ 0.05 were considered statistically significant, and three biologically independent experiments with similar results are reported. GraphPad Prism software version 6.0/7.0 (GraphPad Software) was used for data analysis.
Data availability
Source Data have been provided with the online version of the paper for all figures and all other data that support the findings of this study are available from the corresponding author upon reasonable request. Accession number for ATF4 ChIP-Seq is GSE35681 and for SRC-3 is GSE67860.
Extended Data
Extended Data Figure 1. Kinome-wide screen identified potential kinases regulating SRC-3 intrinsic transcriptional activity.
a, HeLa cells expressing varying concentrations of pBIND or pBIND-SRC-3 construct were used to measure SRC-3 activity. [Mean ± s.d., n=4 biologically independent samples, *P<0.000001 One-way ANOVA with Sidak’s multiple comparison test]. Normalized RLU, relative luciferase units normalized by protein content b, HeLa cells expressing pBIND or pBIND-SRC-3 were treated with siRNA targeting GFP or PRKCZ at the indicated dose followed by luciferase assay to measure SRC-3 activity. [Mean ± s.d., n=3 biologically independent samples; *P<0.000001 One-way ANOVA with Tukey’s multiple comparison test]. c, Different control siRNAs targeting GFP or luciferase (Luc) were used to measure SRC-3 activity in HeLa cells expressing pBIND or pBIND-SRC-3. [Mean (Center) ± s.d. (error), n=3 biologically independent samples,]. The GFP-siRNA controls in red box were used in the library screen as controls. d, Effect on SRC-3 transcriptional activity by three sets of siRNA (Set A, B and C) targeting 636 human kinases in HeLa cells. Effect of control siRNA-GFP was set at one (dotted line), cut off fold for increased activation set at 2 and reduced activity at 0.75 following z-score analysis. [n=3, siRNAs/kinase n=6, siGFP/plate; total n=1908 (siRNAs targeting kinases) n=144 (siRNA-GFP control) independent samples]. e, SRC-3 activity in HeLa cells across 26 kinome-library plates in presence of control siRNA targeting GFP. [Mean (center) ± s.d. (error), n=6 biologically independent replicates for each 24 plates]. f, A secondary screen was performed in HeLa cells to confirm the primary screen hits using a pooled siRNA targeting the kinases followed by SRC-3 transcriptional activity. [n=3 biologically independent samples; Boxes represent 25th to 75th percentile, line in the middle represents median, whiskers showing min to max all points]. g, Relative proliferation of MDA-MB-231 cells four days after treatment with siRNAs targeting GFP (control), SRC-3 or indicated kinases. [Mean ± s.d., n=3 biological replicates, Two-way ANOVA with Dunnett's multiple comparisons test. *P<0.0001.]
Extended Data Figure 2. PFKFB4, the top hit from the kinase screen, enhances the transcriptional activity of SRC-3.
a, Effect of PFKFB4 knockdown on SRC-3 transcriptional activity in various breast cancer cell lines. [Mean ± s.d., n=3 or n=4 (siGFP + pBIND-SRC-3), biologically independent cells; *P<0.000009 Two-way ANOVA with Tukey’s multiple comparison test]. b, SRC-3 transcriptional activity in MDA-MB-231 cells expressing shRNAs targeting PFKFB4 (sh09 and sh20) or control (non-targeting- NT) co-transfected with pBIND or pBIND-SRC-3. [Mean ± s.d., n=5, biological replicates, one-way one-way analysis of variance (ANOVA) with Tukey’s Multiple comparisons test]. c, Protein expression of PFKFB4 or actin in MDA-MB-231 cells expressing shRNAs targeting PFKFB4. d, Expression of PFKFB4 and SRC-3 mRNA in indicated breast tumor cells after treatment with siRNAs targeting GFP (control), or PFKFB4. [Mean ± s.d., n=4 or n=3, biological replicates (siPFKFB4 to measure PFKFB4 gene expression); For exact P-values please refer to source data. e, Expression of PFKFB4 and SRC-3 mRNA in MDA-MB-231 cells transduced with AdGFP, or AdPFKFB4. [Mean ± s.d., n=6; biologically independent cells P<0.000001 Two-way ANOVA with Tukey’s multiple comparison test]. f, MDA-MB-231 cells (left panel) were stained with specific antibodies SRC-3 (rabbit) and PFKFB4 (mouse) prior to proximity ligation assay (PLA). The PLA signals between endogenous SRC-3 and PFKFB4 are shown in the red channel, DAPI was used to stain the nuclei (blue) and merge showing overlay of red and blue channels. Two representative fields from biologically independent experiments were shown from n=5. Right panel- control cells were stained with either SRC-3, PFKFB4 or secondary antibody-conjugated with probes. Scale bar = 20µM (left) and 40µM (right). Data shown are representative of 3 biologically independent experiments with similar results.
Extended Data Figure 3. PFKFB4 functions as a protein kinase by phosphorylating SRC-3 at the S857 residue.
a, In vitro PFKFB4 kinase assay in presence of purified SRC-3 protein, fructose-6-phosphate (F6P), ATP and increasing concentration of recombinant PFKFB4 enzyme followed by SDS-PAGE. Immunoblotting with p-Ser/Thr antibody shows the level of phosphorylated Ser/Thr-SRC-3 protein. b, In vitro PFKFB4 kinase assay in presence of purified SRC-3 protein, PFKFB4 enzyme and varying concentrations of F6P and ATP followed by SDS-PAGE. Immunoblotting with p-Ser/Thr antibody shows the level of p-SRC-3 protein. c, Coomassie blue stain showing the levels of GST-fused SRC-3 fragments used in in vitro kinase reactions performed in Fig. 2b. d, Proteomics analysis of in vitro kinase assay using the GST-SRC-3-CID fragment in the presence of PFKFB4 enzyme and ATP followed by mass spectrometric analyses. Mass spectrum shows the green phosphorylation peak. e, Proteomics analysis of an in vitro kinase assay using a S857A-mutated GST-SRC-3-CID protein in the presence of PFKFB4 enzyme and ATP, followed by mass spectrometric analyses. Mass spectrum failed to detect phosphorylation peaks in the S857A mutated SRC-3-CID protein. f, Expression of PFKFB1, PFKFB2, PFKFB3 and PFKFB4 in MDA-MB-231 cells expressing shRNAs targeting PFKFB4 (sh#09 and sh#20). mRNA levels were normalized to internal housekeeping gene actin. [Mean ± s.d., n=3, biological replicates, two-way ANOVA with Tukey’s Multiple comparisons test, *P<0.05]. g, Protein levels of pSRC-3-S857, total-SRC-3 and actin in MDA-MB-231 cells stably expressing NTshRNA, SRC-3shRNA, or expression of shRNA-resistant S857A (shSRC-3+S857A) mutant or wild-type SRC-3 in SRC-3 depleted cells (shSRC-3+WT-SRC-3) cultured in 25mM glucose. Protein bands were quantified by Image J after normalization to β-actin. h, MDA-MB-231 cells stably expressing NT-shRNA or shRNA targeting PFKFB4 were grown in presence of 25mM glucose or were glucose starved for 4 hours followed by incubation with Streptolysin O (SLO) for 5 min. FBP (10µM) was added to glucose starved cells for additional 1 hour, followed by cell lysis and immunoblotting. Protein bands were quantified by Image J after normalization to β-actin and the NT shRNA lane was set to 1. i, Relative luciferase activity (RLU) showing the transcriptional activity of SRC-3 in MDA-MB-231 cells transduced with Adv. GFP or Adv. PFKFB4 cultured in presence of 5mM, 15mM or 25mM glucose. [Mean ± s.d., n=6 (pBIND) and n=3 (pBIND-SRC-3) biological cell samples, two-way ANOVA with Tukey’s Multiple comparisons test, *P<0.000001]. Data shown in 3a-c and 3f-h are representative of 3 biologically independent experiments with similar results, and 3d-e are representative of 2 biologically independent experiments each run with three different reactions all showing similar results and peptide coverage.
Extended Data Figure 4. Ser-857 phosphorylation enhances SRC-3 transcriptional activity.
a, Relative luciferase activity (RLU) showing the activity of SRC-3WT, SRC-3S857A and SRC-3S857E in MDA-MB-231 cells transduced with lentivirus expressing NTshRNA or shPFKFB4 cultured in presence of 5mM or 25mM glucose. [Mean ± s.d., n=3 biological cell samples, two-way ANOVA with Tukey’s Multiple comparisons test, *P<0.000001]. b, Relative luciferase activity (RLU) showing the activity of SRC-3 in MDA-MB-231 cells stably expressing lentivirus shPFKFB4 and cultured in presence of 25mM glucose. The cells are then co-transfected with empty vector, WT-PFKFB4, and PFKFB4-mutants G46A, P48A, G51A, 230A and 238A. [Mean ± s.d., n=6 biological cell samples, two-way ANOVA with Tukey’s Multiple comparisons test, *P<0.000001]. c, MDA-MB-231 cells stably expressing shRNAs targeting PFKFB4 (231-sh-PFKFB4) were transfected with constructs expressing empty vector (vector), WT-PFKFB4, and PFKFB4-mutants G46A, P48A, G51A, 230A and 238A and cultured in presence of 25mM glucose. Protein levels of phospho-SRC-3 (S857), PFKFB4 and β-actin were detected by immunoblotting. d, Relative luciferase activity (RLU) showing the activity of estrogen receptor-α (ERα) in MCF7-Mar-luc cells transduced with lentivirus expressing NTshRNA or shSRC-3 cultured in presence of 5mM or 25mM glucose stimulated with ethanol (−E2) or with 100nm (E2). [Mean ± s.d., n=3 biological cell samples, two-way ANOVA with Tukey’s Multiple comparisons test, *P<0.000001]. e, Relative luciferase activity (RLU) showing the activity of estrogen receptor-α (ERα) in MCF7-Mar-luc cells transduced with adenovirus expressing Adv. GFP or Adv. PFKFB4. Cells transduced with Adv. PFKFB4 were infected to express NTshRNA or shSRC-3 after 2 days and then cultured in presence of 5mM or 25mM glucose stimulated with ethanol (−E2) or with 100nm (E2). [Mean ± s.d., n=3 biological cell samples, two-way ANOVA with Tukey’s Multiple comparisons test, *P<0.000001]. f, Survival assay in MCF7 cells showing the effect of NT-shRNA, shSRC-3, and re-expression of WT-SRC-3 or SRC-3S857A in SRC-3 depleted cells cultured in charcoal-stripped media supplemented with 25mM glucose and E2 for 7 days [n=3 biological independent data are shown]. All data shown are representative of 3 independent experiments with similar results.
Extended Data Figure 5. Increased glucose and purines are required for SRC-3 dependent growth.
a, Real time measurement of MCF10A cell proliferation transduced with adenovirus Adv. GFP or Adv. SRC-3 in presence of 93 different metabolites. n=3 independent plates run for each sample. Mean (center) ± s.d. (error bars), b, Relative growth of MCF10A cells transduced with Adv. GFP or Adv. SRC-3 in presence of D-glucose, c, adenosine and d, inosine. Mean ± s.d., n=6 biological cell samples, Unpaired t-test two tailed. [Boxes represent 25th to 75th percentile, line in the middle represents median, whiskers showing min to max all points]. e–f, Relative levels of intermediary metabolites in MDA-MB-231 cells after treatment with shRNAs targeting PFKFB4 or SRC-3 compared to control shRNA (NT). e, Glycolytic and pentose phosphate pathway (PPP) metabolites. f, Nucleotides. [Mean ± s.d., n=3 biological independent samples, two-way ANOVA with Tukey’s Multiple comparisons test, *P<0.05]. g, Total levels of purines in MCF10A cells transduced with Adv. GFP and Adv. SRC-3. [Mean ± s.d., n=3 biological independent samples, two-way ANOVA with Tukey’s Multiple comparisons test,; Boxes represent 25th to 75th percentile, line in the middle represents median, whiskers showing min to max all points]. For exact P-values please refer to source data.
Extended Data Figure 6. SRC-3 drives the purine synthesis program under conditions of active glycolysis.
a, MDA-MB231 cells stably expressing NTshRNA, shPFKFB4 and shSRC-3 were fed with [6-C13glucose]. Ribulose/Xylulose-5P (m+1) labeling from [6-C13glucose] were shown. [Mean ± s.d., n=3 biological cell samples, One-way ANOVA with Tukey’s Multiple comparisons test, ***P=0.00013; ****P=0.000078]. b, Genes involved in oxidative and non-oxidative PPP. [Mean ± s.d., n=3 biological cell samples, Two-way ANOVA with Sidak's multiple comparisons test, *P=0.0431]. c, Genes involved in nucleotide synthesis. [Mean ± s.d., n=3 biological cell samples, Two-way ANOVA with Sidak's multiple comparisons test]. d, Expression of metabolic enzymes transketolase (TKT), xanthine dehydrogenase (XDH), and adenosine monophosphate dehydrogenase 1 (AMPD1) in MDA-MB-231 cells transduced with adenovirus expressing GFP (control) and PFKFB4 cultured in presence of 5mM, 15mM or 25mM glucose. [Mean ± s.d., n=3 biological cell samples, two-way ANOVA with Dunnett's multiple comparisons test]. e–f, MDA-MB231 cells stably expressing NTshRNA, shPFKFB4 and shSRC-3 were fed with [6-C13glucose]. e, Seduheptulose-7P (m+1). and f, Erythrose-4P labeling from [6-C13glucose] were shown. [Mean ± s.d., n=3 biological cell samples, two-way ANOVA with Dunnett's multiple comparisons test (e) or with Tukey’s multiple comparison test (f), Boxes represent 25th to 75th percentile, line in the middle represents median, whiskers showing min to max all points]. For exact P-values please refer to source data.
Extended Data Figure 7. Growth defect due to loss of SRC-3 or PFKFB4 is rescued by exogenous purines.
a, Expression of metabolic enzymes transketolase (TKT), xanthine dehydrogenase (XDH), adenosine monophosphate dehydrogenase 1 (AMPD1) and SRC-3 in MDA-MB-231 cells expressing shRNA targeting control-shNT, shSRC-3-21 or re-expression of shRNA –resistant wildtype SRC-3 protein in SRC-3 depleted cells (shSRC-3-21+WT-SRC-3). [Mean ± s.d., n=4 biological cell samples, two-way ANOVA with Tukey’s Multiple comparisons test]. b, Relative proliferation of MDA-MB-231 expressing shRNA targeting SRC-3 (shSRC-3-1 and shSRC-3-2) or NT after treatment with siRNAs targeting luciferase (siLuc) as control or PFKFB4 under conditions indicated. [Mean ± s.d., n=6 samples from biologically independent experiments, two-way ANOVA with Tukey’s Multiple comparisons test, ****P<0.000001]. c, MDA-MB231 cells stably expressing NTshRNA, shPFKFB4 and shSRC-3 were fed with [U-C13glucose] for 48 hours. Adenosine C13 labeling from [U-C13glucose] were shown. [Mean ± s.d., n=3 samples from biologically independent experiments, one-way ANOVA with Tukey’s Multiple comparisons test; Boxes represent 25th to 75th percentile, line in the middle represents median, whiskers showing min to max all points]. Data shown are representative of 3 biologically independent experiments with similar results. For exact P-values please refer to source data.
Extended Data Figure 8. PFKFB4-SRC-3 stabilizes ATF4 transcription factor to promote purine synthesis.
a, Chromatin localization peaks of SRC-3 and ATF4 on TKT, XDH and AMPD1 genes in mouse liver. b, ATF4 binding peaks are conserved on three SRC-3 target purine biosynthetic genes in both mouse and human genomes. c, Chromatin immunoprecipitation (ChIP) of ATF4, total SRC-3, and pSRC-3-S857 from MDA-MB-231 cells treated with 5 mM or 25 mM glucose compared to an IgG isotype control. qPCR was performed to determine amount of promoter enrichment. d, ChIP-qPCR was performed from MDA-MB-231 cells cultured in 25 mM glucose expressing shSRC-3, shPFKFB4, or control-shNT [Mean ± s.d., n=3 biological cell samples; one-way ANOVA with Tukey's multiple comparisons test compared to 5 mM glucose groups (3e, f, g); and compared to shNT group (3h)]. e, ChIP of ATF4, total SRC-3 (BD Biosciences-Ab), and pSRC-3-S857 from MDA-MB-231 cells on AMPD1 promoter treated with non-targeting siRNA (NTsiRNA) or siRNA against ATF4 and cultured in presence of 25 mM glucose compared to an IgG isotype control. qPCR was performed to determine amount of promoter enrichment. [Mean ± s.d., n=3 biological cell samples; one-way ANOVA with Tukey’s Multiple comparisons]. f, Expression of metabolic enzymes transketolase (TKT), xanthine dehydrogenase (XDH), adenosine monophosphate dehydrogenase 1 (AMPD1) and SRC-3 in MDA-MB-231 cells expressing siRNA targeting control (NT), or siRNA-ATF4. [Mean ± s.d., n=3 biological cell samples, two-way ANOVA with Sidak’s Multiple comparisons test]. For exact P-values please refer to source data.
Extended Data Figure 9. PFKFB4-SRC-3 axis promotes breast tumor growth and metastasis.
a, Primary tumors resected out after six weeks. b, Ki-67 staining of primary tumors from animals injected with MDA-MB-231 cells stably expressing NT-shRNA, shSRC-3 or shPFKFB4. Data shown representative of five fields per slide from n=5 animals per group with similar findings. c, Quantification of Ki67 positive cells in the tumor. [Mean ± s.d., n=5 animals per group, average of five fields counted from each slide, one-way ANOVA with Dunnett's multiple comparisons test, ****P=0.0001] d, Primary tumor growth in animals injected with MDA-MB-231 cells stably expressing shRNA targeting SRC-3 (shSRC-3), PFKFB4 (shPFKFB4), or expression of wildtype SRC-3 (WT-SRC-3) or S857A mutant in the shSRC-3 knockdown cells. [Mean ± s.d., n=5 animals per group, two-way ANOVA with Tukey’s multiple comparisons test, *P<0.000001]. e, Immunoblot showing the relative expression of SRC-3 in primary tumors from MDA-MB-231 cells stably expressing NTshRNA, shSRC-3, or re-expression of WT-SRC-3 or S857A mutant in the shSRC-3 knockdown cells. n=5 animals per group was pooled to generate the tumor lysate used for analysis. Semiquantitative levels of each band were analyzed by densitometry using UVP Vision Works LS software, and the relative values normalized to actin are indicated numerically under each lane. f, Graph representing the photon flux of animals from different groups. Animals (n=5) in SRC-3-WT, S857A and shPFKFB4; and (n=4) for shSRC-3. One-way ANOVA with Dunnett's multiple comparisons test. *P<0.0001 [Line shows median with range]. g, mRNA expression of three metabolic enzymes (TKT, XDH, and AMPD1), SRC-3 and PFKFB4 from the primary tumors. [Mean ± s.d., n=5 animals per group, two-way ANOVA with Tukey’s multiple comparisons test]. h, Expression of PFKFB4 in breast cancer patients across different subtypes compared to normal breast tissue. Normal Basal = 17; Basal = 139; Normal_Her2 = 9; Her2 = 67; Normal Luminal A= 62; Luminal A = 418; Normal Luminal B = 21 and LumB = 186. [Line in the center of the rectangle represent median, top edge of the rectangle represent 3rd quartile, bottom edge of the rectangle represent 1st quartile, top whisker represent maximum, and bottom whisker represent minimum.] All Data shown are representative of 3 biologically independent experiments with similar results. For exact P-values please refer to source data.
Extended Data Figure 10. The PFKFB4-SRC-3 axis drives transcriptional programming in breast cancer patients.
a, b, Expression of p-SRC-3, SRC-3 and PFKFB4 in ER(+) breast tumor specimens and matched adjoining normal tissues as detected by immunoblotting n=14, ER-positive breast cancer patients. c, Semi-quantitative levels of each band shown in a and b, were analyzed by densitometry using UVP Vision Works LS software, and the relative values normalized to actin were used to calculate the fold change (tumor/normal) and plotted to obtain the correlation between PFKFB4 and pSRC-3-Ser857 expression [n=14 normal and tumor tissues, R=0.63, p=0.02 Spearman's rank correlation coefficient]. d, Log fold change in protein expression of the PFKFB4-SRC-3 signature compared to the control knockdown (NTshRNA) as determined using a parametric t-test as implemented in the python (spicy) statistical system. Significance was assessed for P<0.05, fold change exceeding 1.25x, are only considered as true regulators [Mean ± s.d., n=3 biologically independent samples]. e, Kaplan–Meier survival plot showing poor survival of breast cancer patients with basal subtype (triple negative) disease exhibiting an increased expression of a common proteomic signature induced by PFKFB4 and SRC-3 axis. The cohort of patients was collected by the The Cancer Genome Atlas (TCGA; P=0.0365, log-rank test; P=0.02971, Cox proportional hazards; two-sided). f, Cartoon model describing the crosstalk between glycolysis and purine generation highlighting the essential steps regulated by pSRC-3-S857. This PFKFB4-dependent SRC-3 phosphorylation enhances mRNA expression of genes involved in purine metabolism driving breast tumor growth, proliferation and metastasis. F6P, fructose-6-phosphate; F1,6-P, fructose 1,6 bisphosphate; AICAR, 5-Aminoimidazole-4-carboxamide ribonucleotide; IMP, Inosine monophosphate; AMP, Adenosine monophosphate. g, Model showing that in glycolytic breast tumors activated PFKFB4 drives SRC-3 phosphorylation at Ser857, which then activates ER-positive primary tumor growth in conjunction with E2-liganded ER, as well in ER-negative/recurrent tumors in conjunction with ATF4, driving aggressive metastatic disease.
Supplementary Material
Acknowledgments
We like to thank Dr. Ralph DeBerardinis at UT Southwestern Medical School, Dallas, TX; Dr. Katerina Gurova and Dr. Mikhail Nikiforov at Roswell Park Cancer Institute, Buffalo, NY for helpful discussions and suggestions. We thank the core facilities at BCM: Tissue Culture Core, CBASS core, Pathology Core, Proteomics Core (NIH P30CA125123), Metabolomics (CPRIT RP120092), and Gene Vector Core. We also acknowledge Uan-I Chen for technical assistance and Cell Signaling Technology for kind gift of the p-SRC-3-S857 antibody. This work was supported by funds from the Susan G. Komen (PG1221410 to B.W.O and PDF14300468 to S.D), the NIH (4R01HD007857, HD08818 and 4P01DK059820 to B.W.O; 1K22CA207578 to S.D and R01CA220297 to N.P), DOD (W81XWH-13-1-0285 to B.W.O and W81XWH-16-1-0297 to S.D), American Cancer Society 127430-RSG-15-105-01-CNE to N.P, and P30CA016056 to RPCCC.
Footnotes
Contributions
S.D. and B.W.O. conceived of the project. S.D. performed most experiments with the following exceptions: N.P. independently performed metabolic profiling and isotope-tracing, J.M.C. and S.Y.J. independently performed proteomics analysis and identified the phosphorylation-site, and B.Z. analyzed the cistromes and motif analysis. K.R. performed all the data analysis, statistical tests and human datasets for clinical correlation under the supervision of C.C. B.C.N. developed plasmids used in the study; C.E.F. validated pSRC-3-S857 antibody, and P.Y. purified full-length SRC-3 protein and recombinant SRC-3 fragments. T.F.W. provided the RNAi-kinome library and supervised the library screen. X.H.Z. supervised the animal study. B.W.O., M.J.T., and S.Y.T. supervised the overall project. S.D. and B.W.O. wrote the manuscript with feedback from all authors.
Competing interests
The authors declare no competing financial interests.
References
- 1.Ward PS, Thompson CB. Metabolic reprogramming: a cancer hallmark even warburg did not anticipate. Cancer. Cell. 2012;21:297–308. doi: 10.1016/j.ccr.2012.02.014. [DOI] [PMC free article] [PubMed] [Google Scholar]
- 2.Dang CV. Cancer cell metabolism: there is no ROS for the weary. Cancer. Discov. 2012;2:304–307. doi: 10.1158/2159-8290.CD-12-0069. [DOI] [PubMed] [Google Scholar]
- 3.Gojis O, et al. The role of SRC-3 in human breast cancer. Nat. Rev. Clin. Oncol. 2010;7:83–89. doi: 10.1038/nrclinonc.2009.219. [DOI] [PubMed] [Google Scholar]
- 4.Anzick SL, et al. AIB1, a steroid receptor coactivator amplified in breast and ovarian cancer. Science. 1997;277:965–968. doi: 10.1126/science.277.5328.965. [DOI] [PubMed] [Google Scholar]
- 5.Xu J, Wu RC, O'Malley BW. Normal and cancer-related functions of the p160 steroid receptor co-activator (SRC) family. Nat. Rev. Cancer. 2009;9:615–630. doi: 10.1038/nrc2695. [DOI] [PMC free article] [PubMed] [Google Scholar]
- 6.Han SJ, Lonard DM, O'Malley BW. Multi-modulation of nuclear receptor coactivators through posttranslational modifications. Trends Endocrinol. Metab. 2009;20:8–15. doi: 10.1016/j.tem.2008.10.001. [DOI] [PMC free article] [PubMed] [Google Scholar]
- 7.Wu RC, et al. Selective phosphorylations of the SRC-3/AIB1 coactivator integrate genomic reponses to multiple cellular signaling pathways. Mol. Cell. 2004;15:937–949. doi: 10.1016/j.molcel.2004.08.019. [DOI] [PubMed] [Google Scholar]
- 8.Wu RC, Feng Q, Lonard DM, O'Malley BW. SRC-3 coactivator functional lifetime is regulated by a phospho-dependent ubiquitin time clock. Cell. 2007;129:1125–1140. doi: 10.1016/j.cell.2007.04.039. [DOI] [PubMed] [Google Scholar]
- 9.Dasgupta S, Lonard DM, O'Malley BW. Nuclear receptor coactivators: master regulators of human health and disease. Annu. Rev. Med. 2014;65:279–292. doi: 10.1146/annurev-med-051812-145316. [DOI] [PMC free article] [PubMed] [Google Scholar]
- 10.Lonard DM, O'Malley BW. The expanding cosmos of nuclear receptor coactivators. Cell. 2006;125:411–414. doi: 10.1016/j.cell.2006.04.021. [DOI] [PubMed] [Google Scholar]
- 11.Dasgupta S, O'Malley BW. Transcriptional coregulators: emerging roles of SRC family of coactivators in disease pathology. J. Mol. Endocrinol. 2014;53:R47–59. doi: 10.1530/JME-14-0080. [DOI] [PMC free article] [PubMed] [Google Scholar]
- 12.Lonard DM, Nawaz Z, Smith CL, O'Malley BW. The 26S proteasome is required for estrogen receptor-alpha and coactivator turnover and for efficient estrogen receptor-alpha transactivation. Mol. Cell. 2000;5:939–948. doi: 10.1016/s1097-2765(00)80259-2. [DOI] [PubMed] [Google Scholar]
- 13.Yi P, et al. Atypical protein kinase C regulates dual pathways for degradation of the oncogenic coactivator SRC-3/AIB1. Mol. Cell. 2008;29:465–476. doi: 10.1016/j.molcel.2007.12.030. [DOI] [PMC free article] [PubMed] [Google Scholar]
- 14.Pilkis SJ, Claus TH, Kurland IJ, Lange AJ. 6-Phosphofructo-2-kinase/fructose-2,6-bisphosphatase: a metabolic signaling enzyme. Annu. Rev. Biochem. 1995;64:799–835. doi: 10.1146/annurev.bi.64.070195.004055. [DOI] [PubMed] [Google Scholar]
- 15.Rousseau GG, Hue L. Mammalian 6-phosphofructo-2-kinase/fructose-2,6-bisphosphatase: a bifunctional enzyme that controls glycolysis. Prog. Nucleic Acid Res. Mol. Biol. 1993;45:99–127. doi: 10.1016/s0079-6603(08)60868-5. [DOI] [PubMed] [Google Scholar]
- 16.Chesney J, et al. Fructose-2,6-bisphosphate synthesis by 6-phosphofructo-2-kinase/fructose-2,6-bisphosphatase 4 (PFKFB4) is required for the glycolytic response to hypoxia and tumor growth. Oncotarget. 2014;5:6670–6686. doi: 10.18632/oncotarget.2213. [DOI] [PMC free article] [PubMed] [Google Scholar]
- 17.Chen H, et al. Nuclear receptor coactivator ACTR is a novel histone acetyltransferase and forms a multimeric activation complex with P/CAF and CBP/p300. Cell. 1997;90:569–580. doi: 10.1016/s0092-8674(00)80516-4. [DOI] [PubMed] [Google Scholar]
- 18.Colosia AD, et al. Induction of rat liver 6-phosphofructo-2-kinase/fructose-2,6-bisphosphatase mRNA by refeeding and insulin. J. Biol. Chem. 1988;263:18669–18677. [PubMed] [Google Scholar]
- 19.Zhang CS, et al. Fructose-1,6-bisphosphate and aldolase mediate glucose sensing by AMPK. Nature. 2017;548:112–116. doi: 10.1038/nature23275. [DOI] [PMC free article] [PubMed] [Google Scholar]
- 20.Jiang S, et al. Scaffold attachment factor SAFB1 suppresses estrogen receptor alpha-mediated transcription in part via interaction with nuclear receptor corepressor. Mol. Endocrinol. 2006;20:311–320. doi: 10.1210/me.2005-0100. [DOI] [PubMed] [Google Scholar]
- 21.Stashi E, et al. SRC-2 Is an Essential Coactivator for Orchestrating Metabolism and Circadian Rhythm. Cell. Rep. 2014;6:633–645. doi: 10.1016/j.celrep.2014.01.027. [DOI] [PMC free article] [PubMed] [Google Scholar]
- 22.Deberardinis RJ, Sayed N, Ditsworth D, Thompson CB. Brick by brick: metabolism and tumor cell growth. Curr. Opin. Genet. Dev. 2008;18:54–61. doi: 10.1016/j.gde.2008.02.003. [DOI] [PMC free article] [PubMed] [Google Scholar]
- 23.Nikolai BC, et al. HER2 Signaling Drives DNA Anabolism and Proliferation through SRC-3 Phosphorylation and E2F1-Regulated Genes. Cancer Res. 2016;76:1463–1475. doi: 10.1158/0008-5472.CAN-15-2383. [DOI] [PMC free article] [PubMed] [Google Scholar]
- 24.Patra KC, Hay N. The pentose phosphate pathway and cancer. Trends Biochem. Sci. 2014;39:347–354. doi: 10.1016/j.tibs.2014.06.005. [DOI] [PMC free article] [PubMed] [Google Scholar]
- 25.Li L, Zhou X, Ching WK, Wang P. Predicting enzyme targets for cancer drugs by profiling human metabolic reactions in NCI-60 cell lines. BMC Bioinformatics. 2010;11:501-2105-11-501. doi: 10.1186/1471-2105-11-501. [DOI] [PMC free article] [PubMed] [Google Scholar]
- 26.Zhu B, et al. A Cell-Autonomous Mammalian 12 hr Clock Coordinates Metabolic and Stress Rhythms. Cell. Metab. 2017;25:1305–1319.e9. doi: 10.1016/j.cmet.2017.05.004. [DOI] [PMC free article] [PubMed] [Google Scholar]
- 27.Han J, et al. ER-stress-induced transcriptional regulation increases protein synthesis leading to cell death. Nat. Cell Biol. 2013;15:481–490. doi: 10.1038/ncb2738. [DOI] [PMC free article] [PubMed] [Google Scholar]
- 28.Ben-Sahra I, Hoxhaj G, Ricoult SJ, Asara JM, Manning BD. mTORC1 induces purine synthesis through control of the mitochondrial tetrahydrofolate cycle. Science. 2016;351:728–733. doi: 10.1126/science.aad0489. [DOI] [PMC free article] [PubMed] [Google Scholar]
- 29.Long W, et al. ERK3 signals through SRC-3 coactivator to promote human lung cancer cell invasion. J. Clin. Invest. 2012;122:1869–1880. doi: 10.1172/JCI61492. [DOI] [PMC free article] [PubMed] [Google Scholar]
- 30.Dasgupta S, et al. Coactivator SRC-2-dependent metabolic reprogramming mediates prostate cancer survival and metastasis. J. Clin. Invest. 2015;125:1174–1188. doi: 10.1172/JCI76029. [DOI] [PMC free article] [PubMed] [Google Scholar]
- 31.Wang L, et al. Characterization of a Steroid Receptor Coactivator Small Molecule Stimulator that Overstimulates Cancer Cells and Leads to Cell Stress and Death. Cancer. Cell. 2015;28:240–252. doi: 10.1016/j.ccell.2015.07.005. [DOI] [PMC free article] [PubMed] [Google Scholar]
- 32.Jin F, et al. A Novel [15N] Glutamine Flux using LC-MS/MS-SRM for Determination of Nucleosides and Nucleobases. J. Anal. Bioanal Tech. 2015;6:267. doi: 10.4172/2155-9872.1000267. Epub 2015 Aug 30. [DOI] [PMC free article] [PubMed] [Google Scholar]
- 33.Fan J, et al. Quantitative flux analysis reveals folate-dependent NADPH production. Nature. 2014;510:298–302. doi: 10.1038/nature13236. [DOI] [PMC free article] [PubMed] [Google Scholar]
- 34.Stadler C, et al. Immunofluorescence and fluorescent-protein tagging show high correlation for protein localization in mammalian cells. Nat. Methods. 2013;10:315–323. doi: 10.1038/nmeth.2377. [DOI] [PubMed] [Google Scholar]
- 35.Foulds CE, et al. Proteomic analysis of coregulators bound to ERalpha on DNA and nucleosomes reveals coregulator dynamics. Mol. Cell. 2013;51:185–199. doi: 10.1016/j.molcel.2013.06.007. [DOI] [PMC free article] [PubMed] [Google Scholar]
- 36.Welte T, et al. Oncogenic mTOR signalling recruits myeloid-derived suppressor cells to promote tumour initiation. Nat. Cell Biol. 2016;18:632–644. doi: 10.1038/ncb3355. [DOI] [PMC free article] [PubMed] [Google Scholar]
- 37.Ciriello G, et al. Comprehensive Molecular Portraits of Invasive Lobular Breast Cancer. Cell. 2015;163:506–519. doi: 10.1016/j.cell.2015.09.033. [DOI] [PMC free article] [PubMed] [Google Scholar]
Associated Data
This section collects any data citations, data availability statements, or supplementary materials included in this article.
Supplementary Materials
Data Availability Statement
Source Data have been provided with the online version of the paper for all figures and all other data that support the findings of this study are available from the corresponding author upon reasonable request. Accession number for ATF4 ChIP-Seq is GSE35681 and for SRC-3 is GSE67860.


