

Abstract
Numerous studies have shown that phonological skills are critical for successful reading acquisition. However, how the brain network supporting phonological processing evolves and how it supports the initial course of learning to read is largely unknown. Here, for the first time, we characterized the emergence of the phonological network in 28 children over three stages (prereading, beginning reading, and emergent reading) longitudinally. Across these three time points, decreases in neural activation in the left inferior parietal cortex (LIPC) were observed during an audiovisual phonological processing task, suggesting a specialization process in response to reading instruction/experience. Furthermore, using the LIPC as the seed, a functional network consisting of the left inferior frontal, left posterior occipitotemporal, and right angular gyri was identified. The connection strength in this network co‐developed with the growth of phonological skills. Moreover, children with above‐average gains in phonological processing showed a significant developmental increase in connection strength in this network longitudinally, while children with below‐average gains in phonological processing exhibited the opposite trajectory. Finally, the connection strength between the LIPC and the left posterior occipitotemporal cortex at the prereading level significantly predicted reading performance at the emergent reading stage. Our findings highlight the importance of the early emerging phonological network for reading development, providing direct evidence for the Interactive Specialization Theory and neurodevelopmental models of reading.
Keywords: development, functional connectivity, neuroimaging, phonological processing, reading
1. INTRODUCTION
The ability to read is a recent evolutionary milestone in human history (Dehaene et al., 2010; Liberman, 1992). Not only can a skilled reader automatically associate printed words with their meanings (Seidenberg, 2005), but they can also integrate written text into a coherent understanding in a timely and accurate fashion (Wolf & Katzir‐Cohen, 2001).
Phonological processing plays a critical role in learning to read (e.g., Melby‐Lervåg, Lyster, & Hulme, 2012; Perfetti, Beck, Bell, & Hughes, 1987; Wagner & Torgesen, 1987). Phonological skills refer to the understanding that word sounds consist of smaller units (syllables, phonemes) and to the ability to manipulate these smaller units. This ability enables beginning readers to analyze the phonological structure of a word and map it onto corresponding orthographic and lexical‐semantic features, facilitating the recognition process of learned words. Supporting this view, longitudinal behavioral studies have previously revealed significant correlations between phonological and reading abilities (e.g., Swanson, Trainin, Necoechea, & Hammill, 2003; Wagner, Torgesen, & Rashotte, 1994), and strong predictive power of preliteracy phonological abilities on long‐term reading achievement (e.g., Georgiou, Parrila, & Papadopoulos, 2008; Scarborough, 1998; Schatschneider, Fletcher, Francis, Carlson, & Foorman, 2004).
The importance of phonological skills in reading development has also been emphasized in neurodevelopmental models of reading development. Pugh et al. (2001) and Sandak, Mencl, Frost, and Pugh (2004) first proposed that reading acquisition starts with the emergence of a dorsal reading circuit in the left temporo‐parietal cortex (LTPC) for the development of phonological processing skills. A dorsal network, connecting the LTPC and the left inferior frontal cortex (LIFC), is then gradually formed to support the integrative process of phonological and lexical‐semantic features of learned words. This phonological route enables beginning readers to decode new words they encounter. Meanwhile, the left occipitotemporal cortex interacts increasingly with higher order cortices responsible for phonological and semantic processing (e.g., LTPC and LIFC) most likely facilitated by decoding and reading experiences during the time course of learning to read, which results in a specialization for words and word‐like stimuli (Interactive Account; Price & Devlin, 2011). As a result, the visual word form system (VWFS; Cohen et al., 2000; Vinckier et al., 2007) emerges for fast‐paced word recognition in fluent readers (e.g., McCandliss, Cohen, & Dehaene, 2003; Shaywitz et al., 2002).
The network characteristic of the proposed neural trajectory of reading development is in line with the Interactive Specialization Theory, which highlights the importance of inter‐regional interactions for the development of cognitive skills and their neural correlates (Johnson, 2000, 2001, 2011; Johnson, Halit, Grice, & Karmiloff–Smith, 2002). This theory assumes that a specific cognitive function is initially subserved by multiple pathways, each consisting of different neural regions. These neural pathways exhibit slightly different preferences towards distinctive processes and/or types of stimuli. Such biases interact with external stimulation, such as sensory input and response feedback over the developmental course, resulting in the recruitment of an optimal neural network that dominantly and effectively serves the target cognitive function. In other words, a neural region does not mature on its own. Instead, its specialization process is propelled and sculptured by the activities of the network(s) it forms with other neural regions for the corresponding cognitive functions.
As phonological processing is an important building block of successful reading acquisition, examining the emergence of the neural network underlying phonological processing from the prereading to the emergent reading stage will provide important insights into the specialization process of the reading network. However, to date, empirical studies on the developmental changes in the functional properties of individual regions associated with phonological abilities have only examined children who could already read, and results are inconclusive due to their cross‐sectional approach. While Booth et al. (2002), Bitan et al. (2007), and Cone, Burman, Bitan, Bolger, and Booth (2008) reported an age‐related increase in LIFC and/or LTPC activation when children between 9 and 12 years old and adults performed a rhyming judgment task involving visually and/or aurally present words, a negative correlation between age and activation was observed in the left superior and middle frontal cortex when children ages 7–17 years carried out a nonword repetition task (Shaywitz et al., 2002). As children and adolescents show large variance in their behavioral and neural trajectories of reading development (e.g., Bates, Dale, & Thal, 1995; Lenroot & Giedd, 2006; Raz et al., 2005; Yeatman, Dougherty, Ben‐Shachar, & Wandell, 2012), these previous studies recruiting different participants for various developmental stages may have confounded the developmental changes with individual/cohort differences (Karmiloff‐Smith, 2010; Poldrack, 2000), which may have led to the inconsistent results across studies (Crone & Ridderinkhof, 2011; Durston et al., 2006; Kraemer, Yesavage, Taylor, & Kupfer, 2000).
With increasing attention toward the neural integrative processes underlying cognitive functions (Friston & Price, 2001), two pioneering studies have investigated the dynamic changes in the neural network associated with the development of phonological skills (Bitan et al., 2007; Bitan, Cheon, Lu, Burman, & Booth, 2009). Children between the ages of 9 and 15 years and adults were recruited to perform a rhyming task in the scanner. Their neural network associated with the phonological processing was analyzed using the dynamic causal modeling (DCM) technique (Bitan et al., 2009, 2007). DCM is a model‐based analysis method that aims to evaluate the influences that one neural region has on the functional activities in other regions within a predefined reading network with hypothesized directional connections (Friston, Harrison, & Penny, 2003; Kahan & Foltynie, 2013). Both studies discovered an age‐related increase in the intrinsic connectivity strength between the dorsal LIFC and the left lateral temporal cortex, highlighting the significance of inter‐regional connections for the development of phonological skills. However, as participants recruited in both studies were advanced readers, it remains unclear as to how the development of phonological processing contributes to the formation of the neural network associated with reading acquisition.
In this study, we employed the first longitudinal study design to investigate the developmental trajectories of the functional network for phonological processing in 28 typically developing children, starting from the beginning of formal reading instruction. An audiovisual phonological task with pictorial stimuli was applied and data were collected at three time points‐prereading, beginning reading, and emergent reading stages‐to delineate the dynamic changes of the phonological network in response to formal reading instruction. Developmental changes in activation magnitude were first characterized by traditional univariate analyses. Then, to capture the longitudinal development in the phonological network accompanying the regional specialization process, seed‐based functional connectivity (FC) analyses were applied, which evaluated the covariance in functional activities between two or more brain regions (Friston, 1994).
Based on the Interactive Specialization Theory (Johnson, 2000, 2001, 2011; Johnson et al., 2002) and neurodevelopmental models of reading (Price & Devlin, 2011; Pugh et al., 2001; Sandak et al., 2004), we hypothesized that (1) developmental changes are observed in the dorsal reading circuit (LTPC) given its essential role in phonological processing; (2) the neural pathways between the LTPC and LIFC, and between the LTPC and VWFS, are established during reading development over the three stages; and (3) given the important role of phonological abilities in literacy acquisition, the readiness (connection strength) of the phonological network at the prereading stage is critical for reading development.
2. METHODS
2.1. Participants
Twenty‐eight typically reading children (15 males) took part in this study. They were retrospectively selected from the Boston Longitudinal Dyslexia study, which investigated the neural trajectory underlying reading development in children with and without a family history of developmental dyslexia. This study focused on the neurodevelopmental trajectories of typical phonological and reading development. Therefore, to ensure a representative sample of typically developing readers, only participants fulfilling the following criteria were included: (a) no family history of developmental dyslexia (FHD‐), defined as no first‐degree relatives diagnosed with dyslexia; (b) Nonverbal IQ within the average range or above (Kaufman Brief Intelligence Test–nonverbal matrices; Kaufman & Kaufman, 2004); (c) neural and behavioral data successfully collected at three time points, that is, before kindergarten, after kindergarten, and after the first grade; (d) typical phonological skills at all time points and typical reading abilities at the final time point (see detailed information in the Psychometric measurements section). Using these criteria, among 79 FHD‐ participants who were initially recruited for this project, 32 children with longitudinal data available at all three developmental stages were first selected. One participant was then excluded due to low Nonverbal IQ (standard score = 80), and three more were further removed due to poor reading outcomes at the third stage, leaving 28 participants for the current analyses.
All participants were first recruited during the summer of their kindergarten entry year (age = 64.3 ± 3.9 months, 55–74 months), and were invited back again after finishing kindergarten (age = 76.4 ± 4.0 months, 67–85 months) and one more time 1–3 years later (age = 94.3 ± 7.1 months, 86–116 months), resulting in three longitudinal time points. Since formal reading instruction starts in kindergarten, the initial time point was viewed as the prereading stage, the second time point after finishing kindergarten the beginning reading stage, and the third time point after receiving at least two years of reading instruction in elementary school the emergent reading stage. This classification was also consistent with the participants' single word reading performance assessed at each stage using the Word ID subtest of the Woodcock Reading Mastery Test‐Revised (WRMT‐R; Woodcock, 1987). 89% of the children could name no more than 9 words at the prereading stage with an average recognition performance of 5 words (standard deviation (SD) = 11, range: 0–43 words; see similar performance range of the word naming assessment for children at the prereading stage in Clark et al., 2014). The children's reading performance improved to 30 words (SD = 16, range: 7–64 words) at the beginning reading stage and 60 words (SD = 12, range: 35–82 words) at the emergent reading stage (Table 1). All children were native English‐speakers and right‐handed except for one who did not indicate a preference (ambidextrous). All participants were screened for a history of psychiatric, neurological, or neurodevelopmental diseases. Only one child (female) was diagnosed with ADHD. She was not medicated at the prereading stage. Information about ADHD medication was not available for the follow‐up visits. This study was approved by the ethics committee of Boston Children's Hospital. Verbal assent and informed consent were obtained from each child and guardian, respectively.
Table 1.
Demographic, behavioral, and psychometric results for prereading, beginning reading, and emergent reading stages and statistical comparisons among these stages
| Prereaders (Stage one, S1) | Beginning readers (Stage two, S2) | Emergent readers (Stage three, S3) | Developmental effect (F value) | Simple effect | ||
|---|---|---|---|---|---|---|
| Psychometric measures | ||||||
| Developmental stage | Before kindergarten | After kindergarten | After reading instruction | |||
| Age (months) | 64.3 ± 3.9 | 76.4 ± 4.0 | 94.3 ± 7.0 | F (2,54) = 399*** |
S1 < S2: t27 = 78.0, p < .001 S2 < S3: t27 = 13.7, p < .001 |
|
| CTOPP: elision | 4.2 ± 2.5 | 8.1 ± 3.3 | 13.0 ± 4.9 | F (2,52) = 60.6*** |
S1 < S2: t26 = 8.2, p < .001 S2 < S3: t27 = 5.2, p < .001 |
|
| CTOPP: blending | 6.1 ± 3.3 | 10.7 ± 2.6 | 13.2 ± 2.5 | F (2,54) = 103*** |
S1 < S2: t27 = 8.9, p < .001 S2 < S3: t27 = 6.3, p < .001 |
|
| CTOPP: nonword repetition | 7.2 ± 1.9 | 8.5 ± 2.2 | 10.0 ± 3.2 | F (2,54) = 11.0*** |
S1 < S2: t27 = 2.7, p = .01 S2 < S3: t27 = 2.4, p = .02 |
|
| RAN: objects | 70.0 ± 14.3 | 64.4 ± 17.2 | 47.5 ± 8.0 | F (2,48) = 45.7*** |
S1 > S2: t25 = −3.8, p < .001 S2 > S3: t26 = −5.8, p < .001 |
|
| CELF: core language | 44 ± 9.9 | 45.1 ± 9.8 | 46.8 ± 7.2 | F (2,44) = 1.7 | ‐ | |
| CELF: receptive language | 34.8 ± 4.7 | 36.0 ± 4.8 | 33.5 ± 5.9 | F (2,36) = 1.5 | ‐ | |
| CELF: expressive language | 37.1 ± 6.5 | 37.2 ± 6.1 | 35.2 ± 6.0 | F (2,42) = 1.9 | ‐ | |
| CELF: language structure | 44.3 ± 10.8 | 46.4 ± 9.3 | 45.8 ± 7.4 | F (2,32) = 0.09 | ‐ | |
| WRMT: letter ID | 28.3 ± 6.5 | 35.3 ± 3.9 | 39.4 ± 3.4 | F (2,52) = 56.5*** |
S1 < S2: t26 = 5.5, p < .001 S2 < S3: t27 = 7.4, p < .001 |
|
| WRMT: word ID | 5.4 ± 11.2 | 30.0 ± 16.0 | 60.5 ± 11.9 | F (2,52) = 252*** |
S1 < S2: t27 = 10.1, p < .001 S2 < S3: t26 = 12.9, p < .001 |
|
| In‐scanner performance | ||||||
| Age (months, imaging) | 65.5 ± 3.8 | 77.2 ± 3.9 | 95.4 ± 7.2 | F (2,54) = 400*** |
S1 < S2: t27 = 63.3, p < .001 S2 < S3: t27 = 14.0, p < .001 |
|
| Maximal head movement | Translational amplitude (mm) | 6.92 ± 6.3 | 5.62 ± 3.9 | 4.35 ± 3.5 | F (2,54) = 2.89 | ‐ |
| Rotation angle (radian) | 0.127 ± 0.13 | 0.098 ± 0.088 | 0.097 ± 0.18 | F (2,54) = 0.81 | ‐ | |
| Accuracy | FSM | 56.7% ± 0.29 | 69.6% ± 0.20 | 84.4% ± 0.18 | F (2,38) = 11.0*** |
S1 < S3: t24 = 2.5, p = .02 S2 < S3: t21 = 3.5, p = .002 |
| VM | 62.1% ± 0.23 | 70.5% ± 0.22 | 82.3% ± 0.16 | |||
| Response latency | FSM | 2457.7 ± 559.9 | 2264.6 ± 387.2 | 2094.2 ± 396.8 | F (2,38) = 2.96 | ‐ |
| VM | 2389.3 ± 525.9 | 2383.5 ± 487.1 | 2190.9 ± 463.6 | |||
Note. Abbreviations: CELF = Clinical Evaluation of Language Fundamentals; CTOPP = Comprehensive Test of Phonological Processing; FSM: First Sound Matching; RAN = Rapid Automatized Naming; VM: Voice Matching; WRMT = Woodcock Reading Mastery Tests.
Raw scores are presented to demonstrate developmental changes over the three reading stages. For RAN: objects, raw scores reflected time (seconds) spent naming all objects, and therefore were expected to decrease with age and increased reading fluency abilities. Due to missing data points for each assessment, degrees of freedom and significance level were adjusted accordingly. Results of simple effects are present only for the variables with a significant main effect (p < .05), and the comparison between S1 and S3 is not present if both the contrasts of S1 vs S2 and S2 vs S3 are significant.
*p < .05; **p < .01; ***p < .001.
2.2. Psychometric measurements
All children were examined on their language (Clinical Evaluation of Language Fundamentals, CELF; Semel, Wiig, & Secord, 1986), reading (WRMT‐R, Word ID), and reading‐related skills, which included phonological processing (Comprehensive Test of Phonological Processing, CTOPP; Wagner, Torgesen, & Rashotte, 1999), rapid automatized naming (RAN/RAS; Wolf & Denckla, 2005), and letter knowledge (WRMT‐R, Letter ID). Raw scores were calculated for each task and entered into within‐subject one‐way ANOVA analyses to evaluate the developmental differences across reading stages (statistical thresholds: p < .05). For assessments showing a significant main effect of developmental stage, pairwise post‐hoc comparisons were further carried out to evaluate simple effects between each stage (i.e., prereading stage vs beginning reading stage; beginning reading stage vs emergent reading stage; prereading stage vs emergent reading stage). Moreover, to confirm the typical development of phonological skills, participants' CTOPP scores were further converted into scaled scores. All participants acquired mean CTOPP scaled scores (averaged across three subtests) higher than the clinical cut‐off of 7 (i.e., one standard deviation below the mean of 10) at all the three developmental stages.
Additionally, at the emergent reading stage, several standardized reading assessments were further administered to examine participants' reading performance at both the single word and text levels. These assessments included the Test of Word Reading Efficiency (TOWRE, Torgesen, Wagner, & Rashotte, 1999) − Sight Word Efficiency (SWE) and Phonemic Decoding Efficiency (PDE) subtests; WRMT‐R − Word ID, Word Attack (WA), and Passage Comprehension (PC); and Woodcock‐Johnson III Tests of Achievement − Reading Fluency subtest (WJRF, Woodcock, McGrew, & Mather, 2001). Raw scores were first calculated and then converted into standard scores for each participant. Again, all 28 children included in the current study scored higher than the clinical cutoff of 85 in each reading assessment, demonstrating typical reading abilities in all tasks.
2.3. FMRI experiment: First sound matching (FSM)
2.3.1. Task and design
Phonological processing was investigated in the current study using a behavioral interleaved gradient block design. The task and procedure were described previously in Raschle, Zuk, and Gaab (2012b) and Raschle, Stering, Meissner, and Gaab (2014). During the experiment, participants listened to two consecutively presented object words, spoken in a male or female voice, and saw corresponding pictures presented on the screen simultaneously. They were required to judge via button‐press whether or not the names of the two object words matched on the first sound (FSM; experimental condition) or whether the object words were spoken by the same gender's voice (VM; control condition). Each trial lasted for 6 s, consisting of the 4 s stimulus presentation (2 s for each word) and 2 s response periods. This trial structure allowed the response duration to synchronize with the actual scanning in an interleaved gradient design, and thus there was reduced scanner background noise during auditory stimulus presentation (Gaab et al., 2007a, 2007b, 2008; Hall et al., 1999). Each FSM and VM block was comprised of four trials, and experimental blocks were alternated with resting blocks (fixation cross) of the same length. To accommodate the young participants in this study, FSM and VM were presented in separate runs, each lasting for 6 min.
2.3.2. In‐scanner behavioral performance analysis
Button responses and reaction times (RTs) were recorded during the imaging experiment. The participants' in‐scanner behavior was closely monitored by a research assistant who accompanied the participant in the scanner room (for details on the scanning protocol, see Raschle et al., 2012a, 2009). Due to the young ages of the participants at the initial stage (55–74 months), response correction was allowed if it was made before the stimulus presentation of the next trial (maximal response time = 2 s). Some children answered “incorrect” first and then subsequently switched to “correct.” In these cases, RTs were calculated based on the correct (second) response. None of the children switched from a “correct” to an “incorrect” answer. Both accuracies and RTs were fed into the within‐subject two‐way ANOVA analyses, respectively, to examine the effects of task and developmental stage, and their interaction on the experiment performances (statistical thresholds: p < .05). Simple effects on pairwise comparisons were further carried out if the main effect of developmental stage or the interaction reached significance.
2.3.3. Imaging acquisition
MRI scans were collected on an SIEMENS 3 T Trio MR scanner. A 32‐slice echo planar imaging‐interleaved sequence was applied to acquire the blood oxygen level‐dependent (BOLD) signals (TR = 6,000 ms; TA = 1,995 ms; TE = 30 ms; flip angle = 90°; field‐of‐view = 256 × 256 mm2; in‐plane resolution = 3.125 × 3.125 mm2, slice thickness = 4 mm, slice gap = 0.8 mm). The behavioral interleaved gradient imaging design was applied to allow for the presentation of the auditory stimuli without scanner background‐noise interference. Structural images were acquired using T1‐weighted MPRAGE MRI sequences with the following specifications: TR = 2000 ms; TE = 3.39 ms; flip angle = 9°; field of view = 256 × 256 mm2; voxel size = 1.3 × 1.0 × 1.3 mm3; slice number = 128.
2.3.4. fMRI preprocessing and first‐level analysis
Each subject's data acquired at the three reading stages were preprocessed and modeled separately using an age‐appropriate protocol implemented in SPM8 (http://www.fil.ion.ucl.ac.uk/spm/). Structural images were first preprocessed with the toolbox VBM8 (http://www.neuro.uni-jena.de/vbm/). They were segmented into gray matter (GM), white matter (WM), and cerebral spinal fluid (CSF) using an adaptive maximum a posterior (MAP) approach (Rajapakse, Giedd, & Rapoport, 1997). These segmented images were then affine transferred from native space to the Montreal Neurological Institute (MNI) space based on age‐ and gender‐matched Tissue Probability Maps created using the Template‐O‐Matic Toolbox (Wilke, Holland, Altaye, & Gaser, 2008). With the aim to increase local registration among participants, a diffeomorphic anatomical registration using exponentiated lie algebra (DARTEL) approach was applied to further normalize the affine‐registered GMs and WMs through six iterations of high dimensional warping processes using nonlinear registration (Ashburner, 2007). To account for the anatomical differences between children and adults, internal pediatric DARTEL templates, instead of default templates, were applied during DARTEL normalization, which were created based on 149 structural images of children of similar age (67.9 ± 4.2 months) and gender ratio (female/male = 1.04/1). The deformation fields, which recorded transformational matrices from the native space to the MNI space, were also saved for every structural image after DARTEL registration.
For functional image preprocessing, the initial volumes were first removed from each run to allow for T1 equilibration effects. The remaining images were spatially realigned to the first image of the series and coregistered to their corresponding structural images collected at the same stage. Deformational fields generated during the DARTEL wrapping process were then applied to normalize all functional images into the MNI space, which were subsequently smoothed using a Gaussian kernel with full‐width at half‐maximum (FWHM) of 8 mm.
Before statistical modeling, head motion detection was carried out using the Artifact Detection Tools (ART, http://www.nitrc.org/projects/artifact_detect). Images with excessive head movement were first automatically selected by ART if the scan‐to‐scan motion exceeded a translational threshold of 3 mm and/or a rotation threshold of 2°. All identified images were then visually inspected and those with artifacts, such as missing voxels, stripes or ghosting, were labeled as outliers. Only participants with fewer than 10% outlier scans at all three developmental stages were included in subsequent analyses. Note that similar strategies in the choices of motion criteria have also been adopted in previous pediatric longitudinal studies to maximize the sample size with longitudinal data at multiple times (e.g., Emerson & Cantlon, 2015; James, 2010; Szaflarski et al., 2012, 2006). The head movement of the remaining volumes did not differ significantly across developmental stages in terms of the maximal translation amplitude and rotation angle (Table 1). In addition, each outlier image was coded using a binary regressor with the outlier image as 1 and the remaining volumes as 0. All regressors for the outliers were combined with the six continuous regressors for head movements, and used as motion parameters in subject level analyses to partial out the confounding effect from head movement and increase the magnitude of statistical effects (Siegel et al., 2014).
The general linear model (GLM) was applied to explore the fixed‐effect within each subject. Experimental regressors for the task and rest conditions were modeled in a block‐design fashion and entered into a GLM with run effect and an intercept term as nuisance covariates. Motion parameters generated by ART were also included to regress out outlier images and partial out the overall motion effect. The default value of the high‐pass filter (128 s) was further included to remove confounding influences on the BOLD signal, such as physiological noise from cardiac and respiratory cycles. The contrast map for the experimental > control conditions (i.e., FSM > VM) was built and computed for every subject at each reading stage.
2.3.5. Univariate whole‐brain analyses
To evaluate the developmental changes in neural responses associated with phonological processing, a one‐way ANOVA model with reading stage as the within‐subject factor was built and subject‐wise contrast maps of FSM > VM for each developmental stage were entered. Subsequently, all possible contrasts between the three different developmental stages (prereading vs beginning reading; beginning reading vs emergent reading; prereading vs emergent reading) were computed. Moreover, for the regions exhibiting significant developmental effects, post‐hoc analyses on the contrasts FSM > rest and VM > rest were further computed to illustrate the developmental changes in each condition. In addition, to evaluate the potential influences of visual stimuli (pictures of the objects) on the neural correlates underlying phonological processing, two spherical Regions of Interest (ROI) were built in the primary visual cortices, specifically, the bilateral posterior occipitotemporal regions, based on the peaks ([±38, −90, −10], radius = 6 mm) reported in Brem et al. (2010). ANOVA tests were performed in each ROI to estimate the developmental changes for the contrasts FSM > VM, FSM > rest, and VM > rest, respectively.
2.3.6. FC analyses
The CONN toolbox was employed to estimate the inter‐regional correlations during phonological processing (Chai, Castañón, Öngür, & Whitfield‐Gabrieli, 2012; Whitfield‐Gabrieli & Nieto‐Castanon, 2012). The first‐level GLM model was first imported for every participant to build the task regressor for each condition. Preprocessed functional images were then denoised to eliminate the confounding effects from head movement and BOLD signals in the WM and CSF. To achieve this, the principle components of the BOLD timecourses of voxels in the corresponding normalized WM and CSF masks were estimated using the anatomical aCompCor strategy (Behzadi et al., 2007). These components were then combined with the SPM motion regressors generated by ART and entered as regressors of no interest in the connectivity analysis model. Furthermore, to partial out the artificial interregional correlations caused by the experimental manipulations, four task regressors and their first temporal derivative terms were also included as nuisance covariates and removed from the BOLD timecourses. The denoised functional images were further band‐pass filtered between 0.008 and 0.09, and detrended to remove linear drift within each functional session. Finally, the timecourses specific for phonological processing were derived through weighting the residual time series by the task regressor specific for the FSM condition. Moreover, a hanning window was applied to weigh down the initial and final scans of each block, to reduce the potential influence of the neighboring (resting) blocks.
For the whole‐brain FC analyses, candidate seed regions were initially chosen based on the findings from the univariate ANOVA analyses, which were further narrowed down to regions located within the reading network established in the previous literature. This selection procedure was employed to focus the current analyses on the network changes specific to reading acquisition. For each seed region, a PCA was first performed on the timecourses of all the voxels within each seed region, and the resulting principle eigenvariate was taken as the timecourse of the seed. Whole‐brain FC maps were then calculated by correlating the timecourse of the seed with that in each of the remaining voxels. The acquired r values were then Fisher‐ transformed to Z scores for subsequent statistical analyses. At group‐level analyses, subject‐wise FC maps were fed into a one‐way ANOVA analysis to evaluate connectivity changes across stages. Moreover, a regression analysis was carried out to estimate the relationship of developmental changes between FC and phonological abilities after controlling for age. Specifically, a phonological‐gain index was first estimated for each subject by subtracting the mean CTOPP raw score averaged across the three subtests acquired at the pre‐reading stage from that at the emergent reading stage. Then, a subject‐wise FC difference map was computed in the same way using FC maps at the prereading and emergent reading stages. These FC difference maps were then entered into a regression model with a phonological‐gain index as a covariate of interest, and age differences between the prereading and emergent reading stages as a control variable.
For all group‐level analyses, a customized cerebral mask was created by (a) generating a mean GM image across all subjects and thresholding at p = .2; (b) subtracting from it a subcortical mask generated using the AAL atlas (Tzourio‐Mazoyer et al., 2002). The resulting image was then binarized and applied as an explicit mask in the second‐level model to constrain all the computations to the cerebral cortex. Activation clusters were reported at a voxel‐level significance of p < .001 (uncorrected) with a cluster size of 29 voxels (k ≥ 29), which corresponded to a cluster level significance at p < .05, corrected for multiple comparisons using the Monte‐Carlo method.
2.3.7. Regression analyses
To evaluate the importance of the phonological network at the prereading stage for the development of reading abilities, regression analyses were performed using the R system (version 3.1.0 64 bit; Ihaka & Gentleman, 1996). A PCA with a varimax rotation was first conducted on the standard scores of all six reading assessments assessed at the emergent reading stage, to better capture the reading competence of each participant. Components that explained more than 10% of the variance in reading performance across participants were selected as reading outcomes for the subsequent regression analyses. A multiple linear regression model was then built to estimate the predictive power of connectivity strength of the identified neural pathways on each reading outcome at the emergent reading stage. The age of each child at the emergent reading stage was also included as a regressor of noninterest. The statistical significance was determined by permutation tests (n = 10,000). Moreover, to ensure the generality of the regression model, a leave‐one‐out‐cross‐validation (LOOCV) analysis was carried out for each reading outcome. Specifically, during each iteration (n = 28), one subject's data was held out, whose reading outcome was predicted using the regression model estimated based on the remaining 27 participants' data. A correlation analysis was then run between the predicted values and the real reading outcomes to evaluate the performance of the regression model.
Finally, to evaluate the effect of head movement threshold on the results, the main analyses were repeated in a subset of 18 participants who passed the more stringent criteria for head motion. Outlier scans were identified if the scan‐to‐scan motion was larger than 3 mm and/or 2°. Ten participants were therefore removed due to more than 20% outlier images at one (n = 7) or two (n = 3) developmental stages. The replication analyses were performed in the regions that showed developmental effects in the previous analyses with the full sample of 28 participants and similar results were observed (Supporting Information).
3. RESULTS
3.1. Psychometric results
All 28 subjects acquired standard scores higher than the clinical cut‐off for reading difficulties (i.e., 85) in all six reading assessments (SWE = 111.0 ± 13.3; PDE = 108.0 ± 13.0; Word ID = 115.5 ± 9.6; WA = 113.9 ± 11.6; PC = 112.1 ± 9.0; WJRF = 111.4 ± 10.6) as outlined in the selection criteria. Moreover, all participants developed typical phonological skills, as their mean CTOPP scaled scores, averaged across all subtests, were within or above the typical range (i.e., > 7) at all three reading stages (prereading stage: 10.5 ± 1.6; beginning reading stage: 11.1 ± 1.4; emergent reading stage: 10.9 ± 2.0).
For an evaluation of the developmental changes in language and cognitive abilities related to language and literacy acquisition, raw scores were employed. Consistent with the transition from prereading to emergent reading stages, participants' performance on the WRMT‐R Word ID task increased significantly (F(2,52) = 252, p < .001). Moreover, their raw scores on WRMT‐R letter ID (F(2,52) = 56.5, p < .001), on all three CTOPP phonological assessments (Elision: F(2,52) = 60.6, p < .001; Blending: F(2,54) = 103, p < .001; Nonword Repetition: F(2,54) = 11.0, p < .001), and on the RAN object assessment (F(2,48) = 45.7, p < .001) all exhibited significant positive developmental effects (all increases except for RAN for which a decrease is considered a skill improvement). Pairwise comparisons performed between each stage further demonstrated significant increases in raw scores for both the WRMT‐R Letter ID and CTOPP assessments, and a significant decrease in seconds for the RAN object assessment at the beginning reading stage compared to the prereading stage, and the emergent reading stage compared to the beginning reading stage (Table 1). However, raw scores on all CELF assessments did not change across the three developmental stages (p > .1 for all the ANOVAs). All the psychometric scores collected at the three time points are summarized in Table 1.
3.2. fMRI performance
3.2.1. In‐scanner behavioral results
Each participant completed the same experiment three times. The average interval between the prereading and beginning reading stages was 11.8 months (9.7–14.3 months), whereas the interval between the beginning reading and emergent reading stages was 18.1 months (10.7–39.1 months). Due to technical issues, behavioral responses failed to be recorded for two children during the first year, five participants at the final point, and one at both the first and final years. All these children were still included in the analyses because (a) they demonstrated above‐chance performance accuracies during the practice session and (b) they responded during the experiment, as confirmed by the monitoring experimenter.
Based on the available behavioral data, participants demonstrated a significant developmental effect for response accuracies, while the main effect of task and their interaction were not significant (developmental stage: F (2,38) = 11.0, p < .001; task: F (1,19) = 0.02, p = .90; interaction: F (2,38) = 0.24, p = .79). Simple effect analyses on accuracies revealed significantly higher response accuracies for the emergent reading stage compared to both the pre‐reading and the beginning reading stages (emergent reading stage vs prereading stage: t 19 = 4.40, p < .001; emergent reading stage vs beginning reading stage: t 19 = 3.65, p = .005, Bonferroni corrected for multiple comparisons), while the two early stages did not differ from each other (t 19 = 1.36, p = .57). Response time decreased over the developmental stages, but the ANOVA analysis did not reveal any significant main or interaction effects (developmental stage: F(2,38) = 2.96, p = .06; task: F(1,19) = 1.47, p = .24; interaction: F(2,38) = .35, p = .71, Table 1).
3.2.2. Univariate whole‐brain results (Figure 1 and Table 2)
Figure 1.
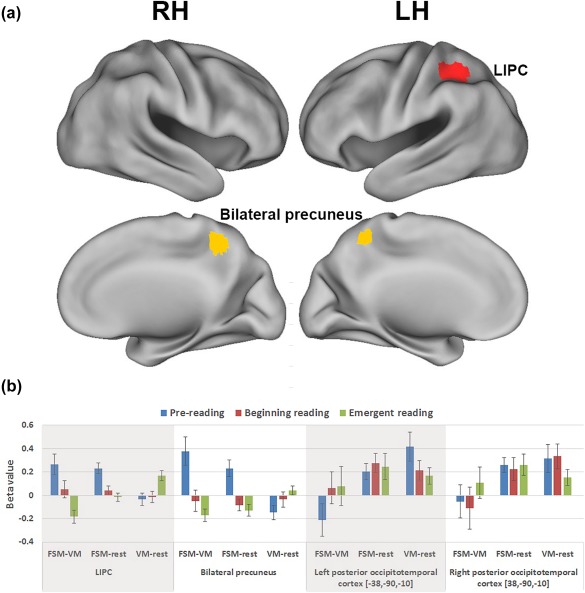
Developmental effects in the activation magnitude for phonological processing. (a) Univariate whole‐brain analyses revealed increased activation in the left inferior parietal cortex (LIPC, red) and bilateral precuneus (yellow) for prereading compared to emergent reading stages, whereas no significant difference was identified for the opposite direction or other contrasts (prereading vs beginning reading, beginning reading vs emergent reading). Results are reported at voxel‐level p uncorrected < .001, k ≥ 29, corresponding to the cluster‐level threshold at p < .05, Monte‐Carlo corrected for multiple comparisons. RH: right hemisphere; LH: left hemisphere. (b) Post‐hoc analyses in the LIPC and bilateral precuneus revealed significant decreases in activation for the contrast FSM > rest, whereas significant increase in activation for the contrast VM > rest was observed. Moreover, ROI analyses in the bilateral primary visual cortices, derived from Brem et al. (2010), did not reveal any significant developmental changes for any of the contrasts [Color figure can be viewed at http://www.wileyonlinelibrary.com]
Table 2.
Summary of the whole‐brain results
| Peak coordinates | ||||||
|---|---|---|---|---|---|---|
| Region | Brodmann area (BA) | x | y | z | T value | Cluster size |
| Univariate analyses: prereading > emergent reading | ||||||
| Left inferior parietal cortex (LIPC) | BA 40 | −36 | −45 | 45 | 4.5 | 57 |
| Bilateral precuneus | BA 5 | 6 | −51 | 54 | 4.3 | 76 |
| FC analyses ‐ LIPC seed: correlation analyses | ||||||
| Left inferior frontal cortex | BA 44, 45 | −57 | 24 | 15 | 5.6 | 40 |
| Left posterior occipitotemporal cortex | BA 18 | −30 | −96 | −9 | 4.4 | 74 |
| Right angular gyrus | BA 39 | 45 | −66 | 39 | 4.5 | 44 |
At the cluster‐level threshold of p < .05 (Monte‐Carlo corrected for multiple comparisons), the contrast of prereading > emergent reading stages revealed significant differences in left inferior parietal cortex (LIPC, spanning the left inferior parietal and supramarginal gyri), and bilateral precuneus, whereas no region was observed for the opposite contrast (emergent reading > prereading) or for any other comparison (i.e., prereading vs beginning reading and beginning reading vs emergent reading). The post‐hoc analyses in both LIPC and bilateral precuneus further showed significant decreases in the contrast FSM > rest (LIPC: F (2, 54) = 9.0, p < .001; bilateral precuneus: F (2, 54) = 11.2, p < .001), while a significant increase for the contrast VM > rest (LIPC: F (2,54) = 7.74, p < .001; bilateral precuneus: F (2,54) = 3.2, p = .049) was observed. Yet, ANOVA analyses with neural activation in the bilateral posterior occipitotemporal regions did not reveal any developmental effect in the contrasts FSM > VM (Left: F (2, 54) = 1.2, p = .32; Right: F (2, 54) = 0.55, p = .58), FSM > rest (left: F (2, 54) = .14, p = .87; right: F (2, 54) = 0.06, p = .94), or VM > rest (left: F (2, 54) = 2.0, p = .15; right: F (2, 54) = 1.1, p = .35).
3.2.3. FC results
Given the key role of the LIPC for reading activities (e.g., Houdé, Rossi, Lubin, & Joliot, 2010; Martin, Schurz, Kronbichler, & Richlan, 2015; Pugh et al., 2001; Schlaggar & McCandliss, 2007), this neural region, as functionally defined based on the univariate results, was employed as the seed for the whole‐brain FC analyses. Comparisons of the whole‐brain FC maps between the three different reading stages over the entire group did not reveal any neural regions that showed a significant developmental effect in FC to the LIPC. However, significant positive correlations between longitudinal differences in connection strength from the prereading to emergent reading stages and the phonological‐gain index were observed for the functional pathways connecting the LIPC to the left inferior frontal cortex (LIFC, BA45), left posterior occipitotemporal cortex (LpOTC, BA 18), and right angular gyrus (RAG, BA 39), respectively (Figure 3a,c and Table 2).
Figure 3.
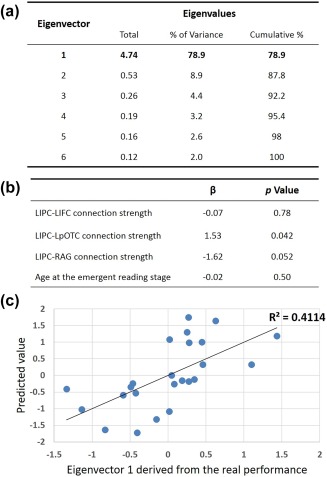
The regression results of prereading functional connectivity strength on long‐term reading achievement. (a) PCA on the six reading assessments revealed one major component (eigenvector 1), which explained 78.9% of the total variance. (b) A linear regression analysis revealed that the LIPC–LpOTC connection strength estimated at the prereading stage could significantly predict reading abilities assessed at the second or later grade (β = 1.53, p = .042). The predictive power of the connection strength between the LIPC and the RAG did not reach significance, but marginally significant results were observed (β = −1.62, p = .052). (c) A leave‐one‐out‐cross‐validate analysis demonstrated a significant correlation between the real reading outcomes and the predicted values (r (26) = .64, p < .001). LIPC: left inferior parietal cortex; LIFC: left inferior frontal cortex; LpOTC: left lingual gyrus; RAG: right angular gyrus [Color figure can be viewed at http://www.wileyonlinelibrary.com]
To further characterize the complex relationship between the phonological‐gain index and the observed changes in the connection strength in the three pathways, LIPC‐LIFC, LIPC‐LpOTC and LIPC‐RAG, subjects were divided into two subgroups using their phonological‐gain indices. Fourteen children with phonological‐gain indices higher than the group mean were grouped as an “above‐average phonological‐gain subgroup” (mean = 7.9, SD = 1.5, range = 6.3∼11.7), and the remaining fourteen children were grouped as the “below‐average phonological‐gain subgroup” (mean = 4.3, SD = 1.5, range = 2∼6). Importantly, these two subgroups did not differ in the mean CTOPP raw score at the prereading or beginning reading stages (prereading stage: t 26 = 0.133, p = .89; beginning reading stage: t 26 = 1.53, p = .14), whereas the above‐average phonological‐gain subgroup scored significantly higher than the below‐average phonological‐gain subgroup at the emergent‐reading stage (t 26 = 4.21, p < .001, Figure 3b). FC values of the identified pathways, LIPC‐LIFC, LIPC‐LpOTC, and LIPC‐RAG, were extracted and first entered into a three‐way ANOVA with pathway and developmental stage as the within‐subject factors and subgroup as the between‐subject variable. Significant effects were demonstrated for the interactions between developmental stage and subgroup (F (2,52) = 12.48, p < .001), as well as between pathway and developmental stage (F (4,104) = 2.75, p = .032), while all the other effects were not significant. Given our interests in the association between gains in phonological skills and pathway development, the interaction effect between developmental stage and subgroup (above‐average phonological‐gain subgroup and below‐average phonological‐gain subgroup) was further explored through a one‐way ANOVA conducted in each subgroup with developmental stage as the within‐subject factor. FC values were recalculated by averaging across all the three pathways due to an insignificant three‐way interaction effect. The ANOVA in the subgroup with below‐average gains in phonological processing revealed a significant developmental decrease in connection strength (F (2,26) = 9.8, p < .001), while an opposite pattern was observed in subjects with above‐average gains in phonological processing (F (2,26) = 3.3, p = .05, see the pathway‐specific development for each subgroup in Figure 3d).
3.2.4. Regression results (Figure 2)
Figure 2.
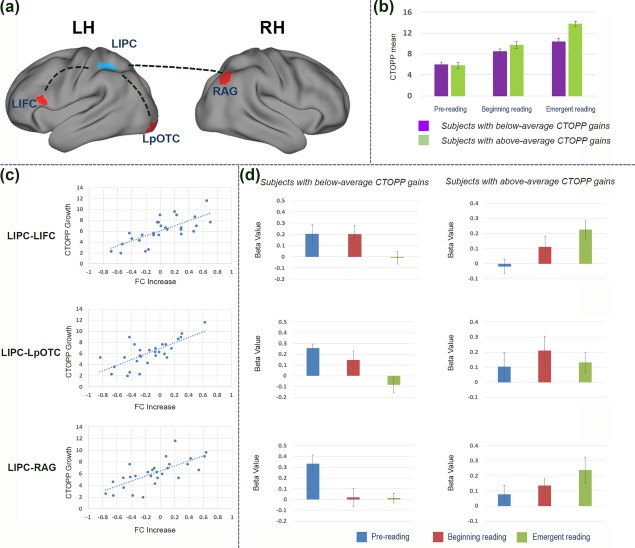
Functional pathways critical for the development of phonological abilities. (a) Whole‐brain regression analyses with the FC map revealed positive associations between mean CTOPP gain and the FC increase in pathways connecting left inferior parietal cortex (LIPC, seed region, blue) to several neural regions (red) including left inferior frontal cortex (LIFC), left posterior occipitotemporal cortex (LpOTC), and right angular gyrus (RAG). Results are reported at voxel‐level p uncorrected < .001, k ≥ 29, corresponding to the cluster‐level threshold at p < .05, Monte‐Carlo corrected for multiple comparisons. RH: right hemisphere; LH: left hemisphere. (b) The subgroup with above‐average CTOPP gains scored significantly higher than the subgroup with below‐average CTOPP gains at the emergent reading stage, although these two subgroups started off with similar phonological skills at the prereading stage. *p < .05; **p < .01; ***p < .001. (c) The scatter plots applied here illustrate the significantly positive correlations between the gains in phonological processing skills and FC increase from the prereading to the emergent reading stages across participants. (d) Bar figures show the dichotomous developmental patterns for subjects with different levels of gains in phonological processing in each neural pathway [Color figure can be viewed at http://www.wileyonlinelibrary.com]
The PCA analysis with the six psychometric reading assessments revealed one major component, which explained 78.9% of the total variance in participants' reading abilities. The second largest component accounted for only 8% of the variance, and thus was not included in the following prediction analyses. Therefore, a multiple linear regression model was built using the first principal component derived from the PCA analyses as the outcome measure. Based on the results of the neuroimaging analyses, the prereading FC values of the three identified pathways LIPC‐LIFC, LIPC‐LpOTC, and LIPC‐RAG, and the age of children at the emergent reading stage, were entered into the regression model as predictive variables. Among all predictors, the LIPC‐LpOTC connection strength significantly predicted reading abilities assessed at the second or later grade (LIPC‐LpOTC: β = 1.53, p = .042), whereas the LIPC‐RAG pathway showed marginally significant predictive power (β = −1.62, p = .052). Finally, the LOOCV analysis demonstrated a significant correlation between the true reading outcomes and predicted values (r (26) = .64, p < .001).
4. DISCUSSION
To our knowledge, this study is the first to examine longitudinal changes in the neural network for phonological processing during the initial process of learning to read. Developmental decreases in activation magnitudes were observed in the LIPC and bilateral precuneus during phonological processing, a prerequisite skill for reading acquisition, from the prereading to the emergent reading stage. Given the critical role of the LIPC in reading and phonological processing (e.g., Houdé et al., 2010; Martin et al., 2015; Pugh et al., 2001; Schlaggar & McCandliss, 2007), this region was further employed as a seed, and its functional connectivity with other brain regions during the phonological processing task (i.e., FSM) were evaluated. Three separate neural pathways connecting the LIPC to the LIFC, LpOTC, and RAG were identified, and correlations between changes in network strengths over time and developmental increases in phonological abilities were observed. More specifically, significant increases in the connection strength in these pathways were observed in participants with above‐average gains in phonological processing, while participants with below‐average gains in phonological processing showed decreased connection strengths. Furthermore, connection strength between the LIPC and the LpOTC at the prereading stage significantly predicted reading skills at the emergent reading stage, emphasizing its critical role during the initial stages of reading development. In summary, this study is the first longitudinal investigation of the maturation of the phonological network in relation to reading development, and thus lays the foundation for future longitudinal investigations of the neural trajectories underlying literacy acquisition.
Specifically, using a univariate analysis approach, greater activation within the LIPC was observed during the audiovisual phonological task (FSM) compared to the control task (VM) at the prereading stage compared to the later stages, suggesting an increasingly efficient processing module for phonological processing within the LIPC. Various studies have reported activation of the LIPC during phonological processing (e.g., Cattinelli, Borghese, Gallucci, & Paulesu, 2013; Pugh et al., 2001; Schlaggar & McCandliss, 2007), but its developmental time course had not yet been studied. Based on our results, we hypothesize that the activation decreases in the LIPC may reflect a fine‐tuning specialization mechanism during the time course of reading development, which is usually accompanied by intensive instruction targeting phonological processing and grapheme‐phoneme mapping in the school setting. Our interpretation is in line with previous cross‐sectional findings, which demonstrated lower activation in mature readers (age 18–23) compared to children (age 7–10) in a variety of (pre) literacy tasks, such as rhyming, repetition, and silent reading, even when their task performances (RTs and accuracies) were matched (Brown et al., 2005; Church et al., 2008). Moreover, post‐hoc analyses further demonstrated that the observed developmental decrease of the contrast FSM > VM was driven both by a significant decrease in the contrast FSM > rest and a significant increase in the contrast VM > rest. While the developmental decrease for the FSM condition confirms that the hypothesized fine‐tuning process in the LIPC is specific to phonological processing, the activation increases in the LIPC for the VM > rest contrast might suggest a different neural mechanism and/or developmental trajectory underlying the voice perception in the LIPC. However, due to the lack of longitudinal investigations of the neural mechanisms underlying development of voice perception, the role of the LIPC in the current VM task is difficult to specify and needs further investigation. In summary, using a longitudinal approach, this study suggests that the LIPC is a hub for phonological processing prior to reading onset and that activation decreases over the developmental trajectory of learning to read.
In addition to the univariate findings, our FC analyses further revealed significant correlations between developmental changes in phonological processing skills over the time course of learning to read and longitudinal changes in the connection strength of the LIPC‐LpOTC, LIPC‐LIFC, and LIPC‐RAG pathways. The development of the LIPC‐LpOTC functional pathway may represent the maturation of auditory‐visual integration, as the initial formation stage of the VWFS during the time course of learning to read. The VWFS is located in the left occipitotemporal cortex, and a posterior‐to‐anterior hierarchical gradient for the representation of increasingly larger word fragments from simple letters in the posterior fusiform/inferior occipital gyri to whole words in the middle fusiform gyrus has been reported (Vinckier et al., 2007). Recent developmental studies have further suggested that the specialization process of the VWFS starts in the posterior area, as the print‐sensitive activation has been shown to emerge in this region (Brem et al., 2010; James, 2010) and correlate with electrophysiological responses associated with letter‐sound congruency effects (Karipidis et al., 2017) in prereaders after preliteracy training. In line with these findings, the functional network between the LIPC and the posterior VWFS (i.e., LpOTC) observed in the current study may reflect the establishment of the neural pathway for letter‐sound correspondence in our very young participant sample, following their decoding/reading experience over the developmental time course of reading acquisition. Interestingly, a developmental decrease in cortical thickness has also been reported in a similar region (the left lingual gyrus) for typically developing children longitudinally from ages of 6 to 11 years (Clark et al., 2014). Cortical thinning in developing brains is primarily thought to result from synaptic pruning and myelination (Dosenbach et al., 2010; Sowell et al., 2004; Toga, Thompson, & Sowell, 2006), and has shown significant correlations with age‐related improvement in cognitive function, such as executive function (Kharitonova, Martin, Gabrieli, & Sheridan, 2013). Therefore, the decrease in the cortical thickness of the left lingual gyrus and the pathway development between the LIPC and LpOTC might reflect the experience‐induced functional specialization and integration in the posterior VWFS, respectively, during the course of learning to read.
Furthermore, the correlations between gains in phonological processing skills and changes in connection strength within the LIPC‐LIFC pathway seem to reflect the maturational process in the pathway between the posterior and anterior components of the reading network. The LIFC is the key region of the anterior reading network (e.g., Pugh et al., 2001), and previous studies have suggested that it plays an important role in various aspects of reading, such as syntactic and semantic processing, processing of lexicality, comprehension, and phonological working memory (e.g., Bonhage, Mueller, Friederici, & Fiebach, 2015; Fiez et al., 1996; Malins et al., 2016; Rimrodt et al., 2009; Rodd, Vitello, Woollams, & Adank, 2015). The positive associations between the increase in the connection strength of the LIPC‐LIFC pathway and the gains in phonological processing most likely reflect the increasing link between decoding/phonological awareness as part of the posterior reading component, and semantic processing and language comprehension as part of the anterior component. Consistent with our interpretation, Scarborough et al. (2001) suggested that both components are critical for reading fluency and comprehension, and that these aspects of language become more strategic over time while word recognition/decoding becomes more automatic. This shift in the association between language processing and reading may therefore be reflected in the increased connection strength between the LIPC and the LIFC observed in this study over the time course of learning to read.
Additionally, an increase in connection strength was observed between the LIPC and RAG, which may reflect the recruitment of additional right‐hemispheric regions that young readers engage during phonological processing. For instance, the RAG has been frequently implicated in lexical‐sematic processing and vocabulary development, which are important components for literacy acquisition (Scarborough, 2001).
A dissociation in maturational patterns of the identified network was further discovered for children with different behavioral profiles of phonological development, reflecting the heterogeneity of the developmental trajectories underlying literacy acquisition, even in typical readers. In the present study, when participants were divided into two subgroups according to their gains in phonological skills, children with above‐average gains in phonological processing showed increased connection strength across all connections (LIPC‐LpOTC, LIPC‐LIFC, and LIPC‐RAG), while those with smaller behavioral improvements exhibited the opposite pattern. These contrasting developmental profiles seem to suggest a different reliance on phonological skills during the course of learning to read. Literacy acquisition is supported by multiple skills. While phonological processing certainly plays a critical role in the initial decoding phase, other abilities, such as skills measured through rapid automatized naming (e.g., automaticity of retrieval), oral language, or orthographic knowledge, might facilitate reading development at a later stage, when automaticity of word recognition and reading fluency begin to emerge (Chall, 1983; Kirby, Parrila, & Pfeiffer, 2003). Therefore, it could be hypothesized that children with below‐average gains in phonological processing may rely more on other skills to support their reading development after they learn to decode words, which may be reflected in the observed decreases in the strength of the phonological network. However, it is important to note that all of the children in this study are exhibiting typical reading skills and therefore it simply seems to reflect a differential processing network which is not qualitatively different. These putative differences in the developmental trajectories of reading, however, seem not to be triggered by initial phonological abilities, as there was no significant difference in the CTOPP performances between the two subgroups at the prereading stage. Future studies should be conducted to investigate the specific neural and behavioral factors that give rise to the observed dichotomous developmental trajectories of successful literacy acquisition.
Interestingly, our findings also parallel the bifurcated trajectories discovered in white matter tract development in 7‐ to 15‐year‐old children (Yeatman et al., 2012), suggesting a strong convergence of structural and functional connectivity during the emergence of the reading network. In their study, children with above‐average reading skills showed developmental increases in FA within the left arcuate fasciculus (LAF) and inferior longitudinal fasciculus (LILF), while those with below‐average reading skills exhibited developmental decreases in FA within the same white matter tracts. The authors of this article interpreted their findings as a result of a dual‐process system governing the white matter development. This system comprises biological processes with opposing effects on white matter integrity, such as axonal myelination (stimulating FA increase) and pruning (dampening FA increase), and the balance between the two processes varies among children, which led to the different developmental trajectories in the fiber tracts observed in their study. The LAF, connecting the prefrontal cortex and LPTC, has been shown to exhibit strong associations with phonological skills (e.g., Vandermosten et al., 2012; Yeatman et al., 2011), even at the prereading stage (Saygin et al., 2013). The LILF spans the inferior occipital and temporal cortices, and has been shown to underlie the development of orthographic processing (Gebauer et al., 2012), which might be facilitated by letter‐sound mapping skills via the LIPC‐LpOTC pathway. Although children with poor reading skills were not investigated in the current study, the white matter tracts identified in Yeatman et al. (2012) connect the same brain regions and/or serve similar function as the functional network identified in the present analyses, in which we compared subjects with below‐average and above‐average gains in phonological processing skills. Therefore, the similarity between the developmental patterns observed in the functional network and the white matter tracts suggests a reciprocal relationship between the functional networks observed here and underlying anatomical infrastructure.
Furthermore, this study implemented a voice matching task as a control condition, during which the children listened to two object words and were asked to indicate whether the gender of the voice of the two words matched. Through the contrast FSM > VM, peripheral processes, such as primary auditory perception and motor responses, could be largely eliminated, and therefore the neural responses specific to phonological processing were isolated. Moreover, as neither the task effect nor the interaction between the reading stages and the tasks was significant, the VM task helped control for the task difficulties across the developmental stages, which would otherwise impact the neural responses (e.g., Casey, Galvan, & Hare, 2005a; Casey, Tottenham, Liston, & Durston, 2005b; D'Esposito et al., 1997; Durston et al., 2006). It is important to note, however, that the two employed tasks (FSM and VM) might still differ in their relevance of the visual information for the target processes. While in the FSM task, the visualization of the object may facilitate the decision of whether the two words start with the same sound, the visual appearance of the objects in the voice matching task is irrelevant for the decision process. One could hypothesize that this difference may lead to differences in the processing depth of the visual stimuli, which could influence the observed developmental effect, especially in visual areas. To empirically address this issue, the additional analyses of the developmental effect were conducted in two ROIs located in the primary visual cortex. No significant developmental effects were reported for the FSM>rest, VM > rest or the FSM > VM contrast, which suggests minimal or no confounding effects of visual processing on the observed effects in this study.
Overall, the early emergence of the neural network and its functional specialization over the time course of learning to read, that is, LIFC and LpOTC, highlights the significance of inter‐regional neural connections for the development of reading skills and their neural correlates, as proposed in the Interactive Specialization Theory (Johnson, 2000, 2001, 2011; Johnson et al., 2002). In the current longitudinal investigation from 5 (prereaders) to 7–9 years of age (emergent readers), our FC analysis revealed strong correlations between gains in phonological skill and developmental increases in the connection strength of the LIPC‐LIFC and the LIPC‐LpOTC pathways. In contrast, the developmental effects in the activation magnitude of the LIFC and the LpOTC regions were not evident in the univariate analysis. However, previous studies in beginning or emergent readers 7 years of age and older reported significant regional maturational effects in the LIFC (e.g., Booth et al., 2004; Cone et al., 2008) and LpOTC (e.g., Brem et al., 2009; Maurer et al., 2006; Olulade, Flowers, Napoliello, & Eden, 2013). One possible explanation for the discrepancy between these studies and ours may be the age of the children studied. Over the developmental timeline, changes in FC may precede regional changes, suggesting that regional specialization is a result of its connectivity with other structures. In line with this, a similar relationship has recently been identified between structural connectivity and the development of functional regions specialized for word recognition over the time course of learning to read (Saygin et al., 2016). These findings, when interpreted within the framework of the Interactive Specialization Theory, suggest that an optimal neural network that dominantly and effectively serves phonological processing and reading development is established through practice and skill development from the prereading to the emergent reading stage and may precede regional changes. Furthermore, it strongly supports the notion that the neural regions for reading do not mature on their own, but that the specialization process is shaped by the activities of the network they form with other neural regions within the reading network.
Furthermore, our findings provide support for the neurodevelopmental models of literacy acquisition proposed by Pugh et al. (2001), Sandak et al. (2004), and Price and Devlin (2011). First, consistent with the proposed predominant role of the dorsal circuit during early reading development, a significant decrease has been shown in the LIPC, reflecting the putative fine‐tuning process in the LIPC underlying phonological development from the prereading to the emergent reading stage. More importantly, the connection between the LIPC and LpOTC at the prereading stage was significantly predictive of later reading achievements highlighting the importance of the phonological decoding region in supporting the specialization of the ventral reading network, as described by the Interactive Account (Price & Devlin, 2011). Higher connection strength between the LIPC and LpOTC might represent increased auditory‐visual integration or increased grapheme‐phoneme mapping skills. This, in turn, may facilitate the fast‐tuning process of areas important for word recognition and decoding, thereby allowing for the development of automaticity and fluency in reading. Furthermore, our present data suggests that a connection between anterior and posterior reading components is formed over the time course of learning to read (in subjects with high gains in phonological processing), supporting the notion of an increasingly automatic integration of oral language components and decoding skills, which are essential for comprehension and fluency skills. Consistent with this conjecture, additional t‐test analyses on the LIPC‐LIFC pathway revealed that the FC was not significantly different from zero at the prereading stage (t 13 = 0.39, p = .70), but became significantly positive at the emergent‐reading stage (t 13 = 3.98, p = .002). Overall, this study provides evidence to support the notion that maturation of the dorsal and ventral circuits and the emergence of the functional pathways among the critical component of the reading network enables children to become skilled readers.
5. LIMITATIONS AND FUTURE DIRECTIONS
There are two limitations in this study. First, no reading task was administered in the scanner, which limits the direct comparison between current results and previous findings examining developmental trajectories associated with reading development. Even though phonological decoding is critical for the initial course of learning to read, the neural characteristics underlying these two skills might not be comparable. The latter process might become more reliant on the ventral word processing system in order to support fast and automatic word recognition in more skilled readers. Therefore, in order to track the emergence of the VWFS and other regions important for successful reading development, future longitudinal studies may have to employ written stimuli for pre‐readers, even though they are unable to decode these. Indeed, previous studies have demonstrated the feasibility of such experimental designs, as the print‐sensitive activation in the ventral visual pathway has been shown in prereaders when they viewed letters (Brem et al., 2010; James, 2010; Saygin et al., 2016). Second, children with a family history of dyslexia and/or reading disabilities were not included in our study. Therefore, it is unknown whether and when the neural network starts to show divergence between typical and atypical children. To understand the emergence of the reading network and the etiology underlying dyslexia, longitudinal studies employing a reading task and incorporating both typical and atypical populations are warranted.
6. CONCLUSIONS
In conclusion, this longitudinal study is the first to characterize the emergence of the phonological processing network from the prereading to the emergent reading stage. Specifically, a developmental decrease in neural activation was observed in the left inferior parietal cortex, suggesting an experience‐induced fine‐tuning of brain regions important for phonological representation and decoding processes. More importantly, a functional network incorporating the dorsal phonological pathway, the ventral visual circuit and the anterior oral lexical/semantic pathway was further captured, with developmental changes in connection strength being strongly associated with longitudinal gains in phonological processing at the behavioral level. The connection strength of the identified neural pathway at the prereading stage was further demonstrated to reliably predict later reading performance. Such findings highlight the importance of the phonological processing network in reading development, and provide direct support for the Interactive Specialization Theory (Johnson 2000, 2001, 2011; Johnson et al., 2002), and neurobiological models of reading development (Price & Devlin, 2011; Pugh et al., 2001; Sandak et al., 2004; Yeatman et al., 2012). Further longitudinal studies are needed to understand the precise role of connectivity changes within the phonological network in facilitating the formation of the reading network and its accompanying behavioral changes from the unskilled to the skilled reading stage.
FUNDING
This study was supported by the Eunice Kennedy Shriver National Institute of Child Health and Human Development #R01HD65762‐01/06 (awarded to NG), the Charles H. Hood Foundation (awarded to NG), the Boston Children's Hospital Pilot Grant (awarded to NG), and a training grant from the National Institute on Deafness and Other Communication Disorders #T32 DC000038‐22 (awarded to JZ).
Supporting information
Additional Supporting Information may be found online in the supporting information tab for this article.
Supporting Information
ACKNOWLEDGMENTS
The authors want to express our greatest gratitude to all the families for their participation in this longitudinal study and acknowledge the effort of Michael Figuccio and Danielle D. Sliva with initial recruitment and data collection. They also want to thank Joseph Sanfilippo, Jade Dunstan, and Ngoc Anh Nguyen for assistance with manuscript revision.
Yu X, Raney T, Perdue MV, et al. Emergence of the neural network underlying phonological processing from the prereading to the emergent reading stage: A longitudinal study. Hum Brain Mapp. 2018;39:2047–2063. 10.1002/hbm.23985
Funding information Eunice Kennedy Shriver National Institute of Child Health and Human Development, Grant/Award Number: R01HD65762‐01/06; Charles H. Hood Foundation; Boston Children's Hospital Pilot Grant; National Institute on Deafness and Other Communication Disorders, Grant/Award Number: T32 DC000038‐22
REFERENCES
- Ashburner, J. (2007). A fast diffeomorphic image registration algorithm. NeuroImage, 38(1), 95–113. [DOI] [PubMed] [Google Scholar]
- Bates, E. , Dale, P. S. , & Thal, D. (1995). Individual differences and their implications for theories of language development. The Handbook of Child Language, 96–151. [Google Scholar]
- Behzadi, Y. , Restom, K. , Liau, J. , & Liu, T. T. (2007). A component based noise correction method (CompCor) for BOLD and perfusion based fMRI. NeuroImage, 37(1), 90–101. [DOI] [PMC free article] [PubMed] [Google Scholar]
- Bitan, T. , Cheon, J. , Lu, D. , Burman, D. D. , & Booth, J. R. (2009). Developmental increase in top‐down and bottom‐up processing in a phonological task: An effective connectivity, fMRI study. Journal of Cognitive Neuroscience, 21(6), 1135–1145. 10.1162/jocn.2009.21065 [DOI] [PMC free article] [PubMed] [Google Scholar]
- Bitan, T. , Cheon, J. , Lu, D. , Burman, D. D. , Gitelman, D. R. , Mesulam, M. M. , & Booth, J. R. (2007). Developmental changes in activation and effective connectivity in phonological processing. NeuroImage, 38(3), 564–575. https://doi.org/S1053-8119(07)00649-0 [pii]10.1016/j.neuroimage.2007.07.048 [DOI] [PMC free article] [PubMed] [Google Scholar]
- Bonhage, C. E. , Mueller, J. L. , Friederici, A. D. , & Fiebach, C. J. (2015). Combined eye tracking and fMRI reveals neural basis of linguistic predictions during sentence comprehension. Cortex, 68, 33–47. [DOI] [PubMed] [Google Scholar]
- Booth, J. R. , Burman, D. D. , Meyer, J. R. , Gitelman, D. R. , Parrish, T. B. , & Mesulam, M. M. (2002). Functional anatomy of intra‐and cross‐modal lexical tasks. NeuroImage, 16(1), 7–22. [DOI] [PubMed] [Google Scholar]
- Booth, J. R. , Burman, D. D. , Meyer, J. R. , Gitelman, D. R. , Parrish, T. B. , & Mesulam, M. M. (2004). Development of brain mechanisms for processing orthographic and phonologic representations. Journal of Cognitive Neuroscience, 16(7), 1234–1249. [DOI] [PMC free article] [PubMed] [Google Scholar]
- Brem, S. , Bach, S. , Kucian, K. , Guttorm, T. K. , Martin, E. , Lyytinen, H. , … Richardson, U. (2010). Brain sensitivity to print emerges when children learn letter‐speech sound correspondences. Proceedings of the National Academy of Sciences of the United States of America, 107(17), 7939–7944. [DOI] [PMC free article] [PubMed] [Google Scholar]
- Brem, S. , Halder, P. , Bucher, K. , Summers, P. , Martin, E. , & Brandeis, D. (2009). Tuning of the visual word processing system: Distinct developmental ERP and fMRI effects. Human Brain Mapping, 30(6), 1833–1844. [DOI] [PMC free article] [PubMed] [Google Scholar]
- Brown, T. T. , Lugar, H. M. , Coalson, R. S. , Miezin, F. M. , Petersen, S. E. , & Schlaggar, B. L. (2005). Developmental changes in human cerebral functional organization for word generation. Cerebral Cortex, 15(3), 275–290. 10.1093/cercor/bhh129bhh129 [pii] [DOI] [PubMed] [Google Scholar]
- Casey, B. J. , Galvan, A. , & Hare, T. A. (2005a). Changes in cerebral functional organization during cognitive development. Current Opinion in Neurobiology, 15(2), 239–244. [DOI] [PubMed] [Google Scholar]
- Casey, B. J. , Tottenham, N. , Liston, C. , & Durston, S. (2005b). Imaging the developing brain: What have we learned about cognitive development? Trends in Cognitive Sciences, 9(3), 104–110. [DOI] [PubMed] [Google Scholar]
- Cattinelli, I. , Borghese, N. A. , Gallucci, M. , & Paulesu, E. (2013). Reading the reading brain: A new meta‐analysis of functional imaging data on reading. Journal of Neurolinguistics, 26(1), 214–238. [Google Scholar]
- Chai, X. J. , Castañón, A. N. , Öngür, D. , & Whitfield‐Gabrieli, S. (2012). Anticorrelations in resting state networks without global signal regression. NeuroImage, 59(2), 1420–1428. [DOI] [PMC free article] [PubMed] [Google Scholar]
- Chall, J. S. (1983). Stages of reading development. New York: McGraw‐Hill. [Google Scholar]
- Church, J. A. , Coalson, R. S. , Lugar, H. M. , Petersen, S. E. , & Schlaggar, B. L. (2008). A developmental fMRI study of reading and repetition reveals changes in phonological and visual mechanisms over age. Cerebral Cortex, 18(9), 2054–2065. [DOI] [PMC free article] [PubMed] [Google Scholar]
- Clark, K. A. , Helland, T. , Specht, K. , Narr, K. L. , Manis, F. R. , Toga, A. W. , & Hugdahl, K. (2014). Neuroanatomical precursors of dyslexia identified from pre‐reading through to age 11. Brain, 137(12), 3136–3141. [DOI] [PMC free article] [PubMed] [Google Scholar]
- Cohen, L. , Dehaene, S. , Naccache, L. , Lehéricy, S. , Dehaene‐Lambertz, G. , Hénaff, M.‐A. , & Michel, F. (2000). The visual word form area. Brain, 123(2), 291–307. [DOI] [PubMed] [Google Scholar]
- Cone, N. E. , Burman, D. D. , Bitan, T. , Bolger, D. J. , & Booth, J. R. (2008). Developmental changes in brain regions involved in phonological and orthographic processing during spoken language processing. NeuroImage, 41(2), 623–635. doi:S1053–8119(08)00194‐8[pii]10.1016/j.neuroimage.2008.02.055 [DOI] [PMC free article] [PubMed] [Google Scholar]
- Crone, E. A. , & Ridderinkhof, K. R. (2011). The developing brain: From theory to neuroimaging and back. Developmental Cognitive Neuroscience, 1(2), 101–109. [DOI] [PMC free article] [PubMed] [Google Scholar]
- Dehaene, S. , Pegado, F. , Braga, L. W. , Ventura, P. , Nunes Filho, G. , Jobert, A. , … Cohen, L. (2010). How learning to read changes the cortical networks for vision and language. Science (New York, N.Y.), 330(6009), 1359–1364. https://doi.org/science.1194140 [pii]10.1126/science.1194140. [DOI] [PubMed] [Google Scholar]
- D'Esposito, M. , Zarahn, E. , Aguirre, G. K. , Shin, R. K. , Auerbach, P. , & Detre, J. A. (1997). The effect of pacing of experimental stimuli on observed functional MRI activity. NeuroImage, 6, 113–121. [DOI] [PubMed] [Google Scholar]
- Dosenbach, N. U. , Nardos, B. , Cohen, A. L. , Fair, D. A. , Power, J. D. , Church, J. A. , … Barnes, K. A. (2010). Prediction of individual brain maturity using fMRI. Science, 329(5997), 1358–1361. [DOI] [PMC free article] [PubMed] [Google Scholar]
- Durston, S. , Davidson, M. C. , Tottenham, N. , Galvan, A. , Spicer, J. , Fossella, J. A. , & Casey, B. (2006). A shift from diffuse to focal cortical activity with development. Developmental Science, 9(1), 1–8. [DOI] [PubMed] [Google Scholar]
- Emerson, R. W. , & Cantlon, J. F. (2015). Continuity and change in children's longitudinal neural responses to numbers. Developmental Science, 18(2), 314–326. [DOI] [PMC free article] [PubMed] [Google Scholar]
- Fiez, J. A. , Raife, E. A. , Balota, D. A. , Schwartz, J. P. , Raichle, M. E. , & Petersen, S. E. (1996). A positron emission tomography study of the short‐term maintenance of verbal information. Journal of Neuroscience, 16(2), 808–822. [DOI] [PMC free article] [PubMed] [Google Scholar]
- Friston, K. J. (1994). Functional and effective connectivity in neuroimaging: A synthesis. Human Brain Mapping, 2(1–2), 56–78. [Google Scholar]
- Friston, K. J. , Harrison, L. , & Penny, W. (2003). Dynamic causal modelling. NeuroImage, 19(4), 1273–1302. [DOI] [PubMed] [Google Scholar]
- Friston, K. J. , & Price, C. J. (2001). Dynamic representations and generative models of brain function. Brain Research Bulletin, 54(3), 275–285. [DOI] [PubMed] [Google Scholar]
- Gaab, N. , Gabrieli, J. D. , & Glover, G. H. (2007a). Assessing the influence of scanner background noise on auditory processing. I. An fMRI study comparing three experimental designs with varying degrees of scanner noise. Human Brain Mapping, 28(8), 703–720. [DOI] [PMC free article] [PubMed] [Google Scholar]
- Gaab, N. , Gabrieli, J. D. , & Glover, G. H. (2007b). Assessing the influence of scanner background noise on auditory processing. II. An fMRI study comparing auditory processing in the absence and presence of recorded scanner noise using a sparse design. Human Brain Mapping, 28(8), 721–732. 10.1002/hbm.20299 [DOI] [PMC free article] [PubMed] [Google Scholar]
- Gaab, N. , Gabrieli, J. D. , & Glover, G. H. (2008). Resting in peace or noise: Scanner background noise suppresses default‐mode network. Human Brain Mapping, 29(7), 858–867. [DOI] [PMC free article] [PubMed] [Google Scholar]
- Gebauer, D. , Fink, A. , Filippini, N. , Johansen‐Berg, H. , Reishofer, G. , Koschutnig, K. , … Enzinger, C. (2012). Differences in integrity of white matter and changes with training in spelling impaired children: A diffusion tensor imaging study. Brain Structure and Function, 217(3), 747–760. [DOI] [PMC free article] [PubMed] [Google Scholar]
- Georgiou, G. K. , Parrila, R. , & Papadopoulos, T. C. (2008). Predictors of word decoding and reading fluency across languages varying in orthographic consistency. Journal of Educational Psychology, 100(3), 566. [Google Scholar]
- Hall, D. A. , Haggard, M. P. , Akeroyd, M. A. , Palmer, A. R. , Summerfield, A. Q. , Elliott, M. R. , … Bowtell, R. W. (1999). Sparse" temporal sampling in auditory fMRI. Human Brain Mapping, 7(3), 213–223. [DOI] [PMC free article] [PubMed] [Google Scholar]
- Houdé, O. , Rossi, S. , Lubin, A. , & Joliot, M. (2010). Mapping numerical processing, reading, and executive functions in the developing brain: An fMRI meta‐analysis of 52 studies including 842 children. Developmental Science, 13(6), 876–885. [DOI] [PubMed] [Google Scholar]
- Ihaka, R. , & Gentleman, R. (1996). R: A language for data analysis and graphics. Journal of Computational and Graphical Statistics, 5(3), 299–314. [Google Scholar]
- James, K. H. (2010). Sensori‐motor experience leads to changes in visual processing in the developing brain. Developmental Science, 13(2), 279–288. [DOI] [PMC free article] [PubMed] [Google Scholar]
- Johnson, M. H. (2000). Functional brain development in infants: Elements of an interactive specialization framework. Child Development, 71(1), 75–81. [DOI] [PubMed] [Google Scholar]
- Johnson, M. H. (2001). Functional brain development in humans. Nature Reviews. Neuroscience, 2(7), 475–483. [DOI] [PubMed] [Google Scholar]
- Johnson, M. H. (2011). Interactive specialization: A domain‐general framework for human functional brain development?. Developmental Cognitive Neuroscience, 1(1), 7–21. [DOI] [PMC free article] [PubMed] [Google Scholar]
- Johnson, M. H. , Halit, H. , Grice, S. J. , & Karmiloff–Smith, A. (2002). Neuroimaging of typical and atypical development: A perspective from multiple levels of analysis. Development and Psychopathology, 14(03), 521–536. [DOI] [PubMed] [Google Scholar]
- Kahan, J. , & Foltynie, T. (2013). Understanding DCM: Ten simple rules for the clinician. NeuroImage, 83, 542–549. [DOI] [PubMed] [Google Scholar]
- Karipidis, I. , Pleisch, G. , Röthlisberger, M. , Hofstetter, C. , Dornbierer, D. , Stämpfli, P. , & Brem, S. (2017). Neural initialization of audiovisual integration in prereaders at varying risk for developmental dyslexia. Human Brain Mapping, 38(2), 1038–1055. [DOI] [PMC free article] [PubMed] [Google Scholar]
- Karmiloff‐Smith, A. (2010). Neuroimaging of the developing brain: Taking “developing” seriously. Human Brain Mapping, 31(6), 934–941. [DOI] [PMC free article] [PubMed] [Google Scholar]
- Kaufman, A. S. , & Kaufman, N. L. (2004). Kaufman brief intelligence test. Wiley Online Library. [Google Scholar]
- Kharitonova, M. , Martin, R. E. , Gabrieli, J. D. , & Sheridan, M. A. (2013). Cortical gray‐matter thinning is associated with age‐related improvements on executive function tasks. Developmental Cognitive Neuroscience, 6, 61–71. [DOI] [PMC free article] [PubMed] [Google Scholar]
- Kraemer, H. C. , Yesavage, J. A. , Taylor, J. L. , & Kupfer, D. (2000). How can we learn about developmental processes from cross‐sectional studies, or can we? American Journal of Psychiatry, 157(2), 163–171. [DOI] [PubMed] [Google Scholar]
- Kirby, J. R. , Parrila, R. K. , & Pfeiffer, S. L. (2003). Naming speed and phonological awareness as predictors of reading development. Journal of Educational Psychology, 95(3), 453. [Google Scholar]
- Lenroot, R. K. , & Giedd, J. N. (2006). Brain development in children and adolescents: Insights from anatomical magnetic resonance imaging. Neuroscience & Biobehavioral Reviews, 30(6), 718–729. [DOI] [PubMed] [Google Scholar]
- Liberman, A. M. (1992). The relation of speech to reading and writing. Advances in Psychology, 94, 167–178. [Google Scholar]
- Malins, J. G. , Gumkowski, N. , Buis, B. , Molfese, P. , Rueckl, J. G. , Frost, S. J. , … Mencl, W. E. (2016). Dough, tough, cough, rough: A “fast” fMRI localizer of component processes in reading. Neuropsychologia, 91, 394–406. [DOI] [PMC free article] [PubMed] [Google Scholar]
- Martin, A. , Schurz, M. , Kronbichler, M. , & Richlan, F. (2015). Reading in the brain of children and adults: A meta‐analysis of 40 functional magnetic resonance imaging studies. Human Brain Mapping, 36(5), 1963–1981. [DOI] [PMC free article] [PubMed] [Google Scholar]
- Maurer, U. , Brem, S. , Kranz, F. , Bucher, K. , Benz, R. , Halder, P. , … Brandeis, D. (2006). Coarse neural tuning for print peaks when children learn to read. NeuroImage, 33(2), 749–758. [DOI] [PubMed] [Google Scholar]
- McCandliss, B. D. , Cohen, L. , & Dehaene, S. (2003). The visual word form area: Expertise for reading in the fusiform gyrus. Trends in Cognitive Sciences, 7(7), 293–299. https://doi.org/S1364661303001347 [pii]. [DOI] [PubMed] [Google Scholar]
- Melby‐Lervåg, M. , Lyster, S.‐A. H. , & Hulme, C. (2012). Phonological skills and their role in learning to read: A meta‐analytic review. Psychological Bulletin, 138(2), 322. [DOI] [PubMed] [Google Scholar]
- Olulade, O. A. , Flowers, D. L. , Napoliello, E. M. , & Eden, G. F. (2013). Developmental differences for word processing in the ventral stream. Brain and Language, 125(2), 134–145. [DOI] [PMC free article] [PubMed] [Google Scholar]
- Perfetti, C. A. , Beck, I. , Bell, L. C. , & Hughes, C. (1987). Phonemic knowledge and learning to read are reciprocal: A longitudinal study of first grade children. Merrill‐Palmer Quarterly (1982), 283–319. [Google Scholar]
- Poldrack, R. A. (2000). Imaging brain plasticity: Conceptual and methodological issues—a theoretical review. NeuroImage, 12(1), 1–13. [DOI] [PubMed] [Google Scholar]
- Price, C. J. , & Devlin, J. T. (2011). The interactive account of ventral occipitotemporal contributions to reading. Trends in Cognitive Sciences, 15(6), 246–253. [DOI] [PMC free article] [PubMed] [Google Scholar]
- Pugh, K. R. , Mencl, W. E. , Jenner, A. R. , Katz, L. , Frost, S. J. , Lee, J. R. , … Shaywitz, B. A. (2001). Neurobiological studies of reading and reading disability. Journal of Communication Disorders, 34(6), 479–492. [DOI] [PubMed] [Google Scholar]
- Rajapakse, J. C. , Giedd, J. N. , & Rapoport, J. L. (1997). Statistical approach to segmentation of single‐channel cerebral MR images. IEEE Transactions on Medical Imaging, 16(2), 176–186. [DOI] [PubMed] [Google Scholar]
- Raschle, N. , Zuk, J. , Ortiz‐Mantilla, S. , Sliva, D. D. , Franceschi, A. , Grant, P. E. , … Gaab, N. (2012a). Pediatric neuroimaging in early childhood and infancy: Challenges and practical guidelines. Annals of the New York Academy of Sciences, 1252(1), 43–50. 10.1111/j.1749-6632.2012.06457.x [DOI] [PMC free article] [PubMed] [Google Scholar]
- Raschle, N. M. , Lee, M. , Buechler, R. , Christodoulou, J. A. , Chang, M. , & Vakil, M. (2009). Making MR imaging child's play ‐ Pediatric neuroimaging protocol. Guidelines and procedure. JoVE, 29. [DOI] [PMC free article] [PubMed] [Google Scholar]
- Raschle, N. M. , Stering, P. L. , Meissner, S. N. , & Gaab, N. (2014). Altered neuronal response during rapid auditory processing and its relation to phonological processing in prereading children at familial risk for dyslexia. Cerebral Cortex, 24(9), 2489–2501. 10.1093/cercor/bht104bht104 [pii] [DOI] [PMC free article] [PubMed] [Google Scholar]
- Raschle, N. M. , Zuk, J. , & Gaab, N. (2012b). Functional characteristics of developmental dyslexia in left‐hemispheric posterior brain regions predate reading onset. Proceedings of the National Academy of Sciences of the United States of America, 109(6), 2156–2161. [DOI] [PMC free article] [PubMed] [Google Scholar]
- Raz, N. , Lindenberger, U. , Rodrigue, K. M. , Kennedy, K. M. , Head, D. , Williamson, A. , … Acker, J. D. (2005). Regional brain changes in aging healthy adults: General trends, individual differences and modifiers. Cerebral Cortex, 15(11), 1676–1689. [DOI] [PubMed] [Google Scholar]
- Rimrodt, S. , Clements‐Stephens, A. , Pugh, K. , Courtney, S. , Gaur, P. , Pekar, J. , & Cutting, L. (2009). Functional MRI of sentence comprehension in children with dyslexia: Beyond word recognition. Cerebral Cortex, 19(2), 402–413. [DOI] [PMC free article] [PubMed] [Google Scholar]
- Rodd, J. M. , Vitello, S. , Woollams, A. M. , & Adank, P. (2015). Localising semantic and syntactic processing in spoken and written language comprehension: An Activation Likelihood Estimation meta‐analysis. Brain and Language, 141, 89–102. [DOI] [PubMed] [Google Scholar]
- Sandak, R. , Mencl, W. E. , Frost, S. J. , & Pugh, K. R. (2004). The neurobiological basis of skilled and impaired reading: Recent findings and new directions. Scientific Studies of Reading, 8(3), 273–292. [Google Scholar]
- Saygin, Z. M. , Norton, E. S. , Osher, D. E. , Beach, S. D. , Cyr, A. B. , Ozernov‐Palchik, O. , … Gabrieli, J. D. (2013). Tracking the roots of reading ability: White matter volume and integrity correlate with phonological awareness in prereading and early‐reading kindergarten children. Journal of Neuroscience, 33(33), 13251–13258. [DOI] [PMC free article] [PubMed] [Google Scholar]
- Saygin, Z. M. , Osher, D. E. , Norton, E. S. , Youssoufian, D. A. , Beach, S. D. , Feather, J. , … Kanwisher, N. (2016). Connectivity precedes function in the development of the visual word form area. Nature Neuroscience, 19, 1250–1255. [DOI] [PMC free article] [PubMed] [Google Scholar]
- Scarborough, H. S. (1998). Early identification of children at risk for reading disabilities: Phonological awareness and some other promising predictors In Shapiro B., Accardo P., & Capute A. (Eds.), Specific reading disability: A view of the spectrum (pp. 75–119). Timonium, MD: York Press. [Google Scholar]
- Scarborough, H. S. (2001). Connecting early language and literacy to later reading (dis)abilities: Evidence, theory, and practice In Dickinson S. B. N. a. D. K. (Ed.), Handbook of early literacy research (pp. 97–110). New York: Guilford Press. [Google Scholar]
- Schatschneider, C. , Fletcher, J. M. , Francis, D. J. , Carlson, C. D. , & Foorman, B. R. (2004). Kindergarten prediction of reading skills: A longitudinal comparative analysis. Journal of Educational Psychology, 96(2), 265. [Google Scholar]
- Schlaggar, B. L. , & McCandliss, B. D. (2007). Development of neural systems for reading. Annual Review of Neuroscience, 30, 475–503. [DOI] [PubMed] [Google Scholar]
- Seidenberg, M. S. (2005). Connectionist models of word reading. Current Directions in Psychological Science, 14(5), 238–242. [Google Scholar]
- Semel, E. , Wiig, E. H. , & Secord, W. (1986). The clinical evaluation of language fundamentals ‐ Revised. New York: The Psychological Corporation. [Google Scholar]
- Shaywitz, B. A. , Shaywitz, S. E. , Pugh, K. R. , Mencl, W. E. , Fulbright, R. K. , Skudlarski, P. , … Lyon, G. R. (2002). Disruption of posterior brain systems for reading in children with developmental dyslexia. Biological Psychiatry, 52(2), 101–110. [DOI] [PubMed] [Google Scholar]
- Siegel, J. S. , Power, J. D. , Dubis, J. W. , Vogel, A. C. , Church, J. A. , Schlaggar, B. L. , & Petersen, S. E. (2014). Statistical improvements in functional magnetic resonance imaging analyses produced by censoring high‐motion data points. Human Brain Mapping, 35(5), 1981–1996. [DOI] [PMC free article] [PubMed] [Google Scholar]
- Sowell, E. R. , Thompson, P. M. , Leonard, C. M. , Welcome, S. E. , Kan, E. , & Toga, A. W. (2004). Longitudinal mapping of cortical thickness and brain growth in normal children. Journal of Neuroscience, 24(38), 8223–8231. [DOI] [PMC free article] [PubMed] [Google Scholar]
- Swanson, H. L. , Trainin, G. , Necoechea, D. M. , & Hammill, D. D. (2003). Rapid naming, phonological awareness, and reading: A meta‐analysis of the correlation evidence. Review of Educational Research, 73(4), 407–440. [Google Scholar]
- Szaflarski, J. P. , Altaye, M. , Rajagopal, A. , Eaton, K. , Meng, X. , Plante, E. , & Holland, S. K. (2012). A 10‐year longitudinal fMRI study of narrative comprehension in children and adolescents. NeuroImage, 63(3), 1188–1195. [DOI] [PMC free article] [PubMed] [Google Scholar]
- Szaflarski, J. P. , Schmithorst, V. J. , Ryars, A. W. , Ret, J. , Plante, E. , Holland, S. K. , & Altaye, M. (2006). A longitudinal fMRI study of language development in children. Neurology, 66(5), A328. [DOI] [PMC free article] [PubMed] [Google Scholar]
- Toga, A. W. , Thompson, P. M. , & Sowell, E. R. (2006). Mapping brain maturation. Trends in Neurosciences, 29(3), 148–159. [DOI] [PMC free article] [PubMed] [Google Scholar]
- Torgesen, J. K. , Wagner, R. K. , & Rashotte, C. A. (1999). TOWRE: Test of word reading efficiency. Austin, TX: PRO‐ED, Inc. [Google Scholar]
- Tzourio‐Mazoyer, N. , Landeau, B. , Papathanassiou, D. , Crivello, F. , Etard, O. , Delcroix, N. , … Joliot, M. (2002). Automated anatomical labeling of activations in SPM using a macroscopic anatomical parcellation of the MNI MRI single‐subject brain. NeuroImage, 15(1), 273–289. 10.1006/nimg.2001.0978S10 53811901909784 [pii]. [DOI] [PubMed] [Google Scholar]
- Vandermosten, M. , Boets, B. , Poelmans, H. , Sunaert, S. , Wouters, J. , & Ghesquière, P. (2012). A tractography study in dyslexia: Neuroanatomic correlates of orthographic, phonological and speech processing. Brain, 135(3), 935–948. [DOI] [PubMed] [Google Scholar]
- Vinckier, F. , Dehaene, S. , Jobert, A. , Dubus, J. P. , Sigman, M. , & Cohen, L. (2007). Hierarchical coding of letter strings in the ventral stream: Dissecting the inner organization of the visual word‐form system. Neuron, 55(1), 143–156. [DOI] [PubMed] [Google Scholar]
- Wagner, R. K. , & Torgesen, J. K. (1987). The nature of phonological processing and its causal role in the acquisition of reading skills. Psychological Bulletin, 101(2), 192. [Google Scholar]
- Wagner, R. K. , Torgesen, J. K. , & Rashotte, C. A. (1994). Development of reading‐related phonological processing abilities: New evidence of bidirectional causality from a latent variable longitudinal study. Developmental Psychology, 30(1), 73. [Google Scholar]
- Wagner, R. K. , Torgesen, J. K. , & Rashotte, C. A. (1999). The comprehensive test of phonological processing. Austin: PRO‐ED, Inc. [Google Scholar]
- Whitfield‐Gabrieli, S. , & Nieto‐Castanon, A. (2012). Conn: A functional connectivity toolbox for correlated and anticorrelated brain networks. Brain Connectivity, 2(3), 125–141. 10.1089/brain.2012.0073 [DOI] [PubMed] [Google Scholar]
- Wilke, M. , Holland, S. K. , Altaye, M. , & Gaser, C. (2008). Template‐O‐Matic: A toolbox for creating customized pediatric templates. NeuroImage, 41(3), 903–913. [DOI] [PubMed] [Google Scholar]
- Wolf, M. , & Denckla, M. (2005). RAN/RAS: Rapid automatized naming and rapid alternating. Austin, TX: PRO‐ED: Inc. [Google Scholar]
- Wolf, M. , & Katzir‐Cohen, T. (2001). Reading fluency and its intervention. Scientific Studies of Reading, 5(3), 211–239. [Google Scholar]
- Woodcock, R. W. (1987). Woodcock reading mastery test: Revised. Circle Pines, MN: American Guidance Service. [Google Scholar]
- Woodcock, R. W. , McGrew, K. S. , & Mather, N. (2001). Woodcock‐Johnson III tests of cognitive ability. Itasca, IL: Riverside Publishing. [Google Scholar]
- Yeatman, J. D. , Dougherty, R. F. , Ben‐Shachar, M. , & Wandell, B. A. (2012). Development of white matter and reading skills. Proceedings of the National Academy of Sciences of the United States of America, 109(44), E3045–E3053. [DOI] [PMC free article] [PubMed] [Google Scholar]
- Yeatman, J. D. , Dougherty, R. F. , Rykhlevskaia, E. , Sherbondy, A. J. , Deutsch, G. K. , Wandell, B. A. , & Ben‐Shachar, M. (2011). Anatomical properties of the arcuate fasciculus predict phonological and reading skills in children. Journal of Cognitive Neuroscience, 23(11), 3304–3317. [DOI] [PMC free article] [PubMed] [Google Scholar]
Associated Data
This section collects any data citations, data availability statements, or supplementary materials included in this article.
Supplementary Materials
Additional Supporting Information may be found online in the supporting information tab for this article.
Supporting Information