

Abstract
Two basic neuroimaging‐based characterizations of white matter tracts are the magnitude of water diffusion along the principal tract orientation (axial diffusivity, AD) and water diffusion perpendicular to the principal orientation (radial diffusivity, RD). It is generally accepted that decreases in AD reflect disorganization, damage, or loss of axons, whereas increases in RD are indicative of disruptions to the myelin sheath. Previous reports have detailed the heritability of individual AD and RD measures, but have not examined the extent to which the same or different genetic or environmental factors influence these two phenotypes (except for corpus callosum). We implemented bivariate twin analyses to examine the shared and independent genetic influences on AD and RD. In the Vietnam Era Twin Study of Aging, 393 men (mean age = 61.8 years, SD = 2.6) underwent diffusion‐weighted magnetic resonance imaging. We derived fractional anisotropy (FA), mean diffusivity (MD), AD, and RD estimates for 11 major bilateral white matter tracts and the mid‐hemispheric corpus callosum, forceps major, and forceps minor. Separately, AD and RD were each highly heritable. In about three‐quarters of the tracts, genetic correlations between AD and RD were >.50 (median = .67) and showed both unique and common variance. Genetic variance of FA and MD were predominately explained by RD over AD. These findings are important for informing genetic association studies of axonal coherence/damage and myelination/demyelination. Thus, genetic studies would benefit from examining the shared and unique contributions of AD and RD.
Keywords: axial diffusivity, genetic correlation, heritability, magnetic resonance imaging, radial diffusivity, twin study, white matter
1. INTRODUCTION
White matter consists of thousands of neuronal fibers (axons), glial cells, and myelin sheaths that comprise oligodendrocytes that envelop the axons, ensuring efficient electrical signal transmission. Throughout late childhood and adolescence, white matter volume increases in a generally linear trajectory (Giedd et al., 1999; Giedd, 2004; Lebel, Walker, Leemans, Phillips, & Beaulieu, 2008; Lebel and Beaulieu, 2011; Paus et al., 2001; Sowell, Trauner, Gamst, & Jernigan, 2002), peaking in the fourth or fifth decade of life before steadily declining in later life (Bartzokis et al., 2001; Sowell et al., 2003; Walhovd et al., 2005; Westlye et al., 2010). The extent of directionality of water diffusion along white matters tracts can be expressed by the fractional anisotropy (FA) measure that is broadly used to describe the density and coherence of a white matter region. White matter organization can be further described as nonfractional measures of axial diffusivity (AD) and radial (RD) diffusivity, which reflect water diffusion along (eigenvalue λ1) or across axons (average of eigenvalues λ2 + λ3), respectively (reviewed in Alexander et al., 2011).
The neuroanatomical constituents that alter diffusion directionality have been investigated in experimental preclinical animal models and clinical observational studies of neuronal development and degeneration. A seminal investigation of AD and RD in a mouse model of dysmyelination found that reduced myelin was associated with increased RD (Song et al., 2002). Subsequent preclinical investigations have confirmed increased RD in models of dysmyelination (Tyszka, Readhead, Bearer, Pautler, & Jacobs, 2006) and demyelination (Harsan et al., 2006; Song et al., 2005), with a few studies suggesting minor concomitant reductions in AD within these pathologies (Song et al., 2005; Tyszka et al., 2006). Using mouse models of reversible dysmyelination (Harsan et al., 2006; Sun et al., 2006), decreases in AD were associated with reduced axonal caliber and increased expression of the cytoskeletal protein III β‐tubulin protein, whereas increases in AD were associated with increases in axonal number and caliber. Subsequent clinical investigations in neuronal development and degeneration showed significant impairments in white matter microstructure as indexed by increased RD and decreased AD when myelin is damaged or absent (Horsfield, Larsson, Jones, & Gass, 1998; Huppi et al., 1998; Mukherjee et al., 2001; Werring, Clark, Barker, Thompson, & Miller, 1999), though understanding the precise contribution of myelin to the diffusion signal in these conditions is hampered by other factors including axon diameter, neurofibril degeneration and/or demyelination, extracellular matrix volume and composition, edema, microbleeds, and infarcts (Assaf & Pasternak, 2008). Thus, while there is more to understand about the neurobiological components that underpin changes in the diffusion signal, it is generally accepted that decreases in AD reflect disorganization, damage, or loss of axons (Freund et al., 2012; Zhang et al., 2009), whereas increases in RD are indicative of disruptions to the myelin sheath (Chen, Mar, Brown, Song, & Benzinger, 2011; Klawiter et al., 2012; Naismith et al., 2010).
To explicate the genetic and environmental influences on diffusivity measurements, univariate behavior genetic/twin analysis approaches can provide an estimate of heritability, that is, the relative proportion of the phenotypic variance attributed to genetic influences. Several studies have demonstrated significant heritability for whole brain and tract‐wise average FA across various age groups, geographic locations, and ethnic backgrounds (Chiang et al., 2008, 2011; Duarte‐Carvajalino et al., 2012; Jahanshad et al., 2013a, 2010; Kochunov et al., 2010, 2015). Importantly, the eigenvalues that comprise AD (λ1) and RD [(λ2 + λ3)/2] are orthogonal and distinct from each other, but both are mathematical components of the composite metrics mean diffusivity (MD = (λ1 + λ2 + λ3)/3) and
Only a limited number of studies have investigated the heritability of AD and RD using univariate analysis approaches. An extended family pedigrees study of 467 adults (average age 47.9 years, range 19–85 years of age) found that whole brain FA and RD were each significantly heritable (a 2 = .52 and .37, respectively) and genetically correlated (genetic correlation r g = −.68). Whole brain AD was not significantly heritable (Kochunov et al., 2010). These findings indicate that RD is under strong genetic control and these genetic effects have substantial contribution to the heritability of FA. In contrast, this study suggested that AD is more influenced by environmental factors. Recently, our group (Vuoksimaa et al., 2017) reported on the heritability of diffusivity measures in middle‐aged male twins as part of the ongoing Vietnam Era Twin Study of Aging (VETSA; Kremen, Franz, & Lyons, 2013a, 2013b; Kremen et al., 2006). We showed that despite the narrow age range of these nondemented, community‐dwelling individuals age was correlated with the global average for each diffusion index measured (FA, AD, RD, and MD), and older age was related to poorer white matter microstructural properties even in middle age (Vuoksimaa et al., 2017). Contrary to the observations of Kochunov et al. (2010), most tracts measured were significantly heritable for both RD (a 2 = .74 for all tracts combined) and AD (a 2 = .72 for all tracts combined) similar to findings in neonate (Lee et al., 2015) and pediatric twins (Brouwer et al., 2010). The differences between Kochunov et al. and Vuoksimaa et al. could be due to study design (family pedigree vs twins), gender balance (mixed sex vs males only), age range (19–85 years vs 56–66 years), white matter atlas (JHU atlas vs AtlasTract atlas), and regions of interest (whole brain white matter vs major white matter pathways). Thus, there are conflicting results about the genetic contributions to AD and RD.
While there are limited reports on the heritability of AD and RD, virtually no research has been conducted concerning the genetic relationship between diffusivity phenotypes. If the AD and RD of a given tract are influenced by a shared set of genetic factors, then there will be a significant genetic correlation (r g) between them. If there are no shared genetic influences underlying AD and RD, then r g would not be significantly different from zero (Figure 1). As is the case for any phenotypic correlation, a genetic correlation represents the shared variance between two phenotypes. However, it represents only the shared genetic variance. Genetic correlations can be determined in twin analyses because the twin method makes it possible to decompose genetic and environmental variance for each phenotype (Neale & Cardon, 1992). Environmental correlations similarly reflect shared environmental influences. We are aware of only one study that examined this relationship in one neuroanatomical structure, reporting that AD and RD had a strong genetic correlation (r g = 0.61) within the corpus callosum (Kanchibhotla et al., 2014).
Figure 1.
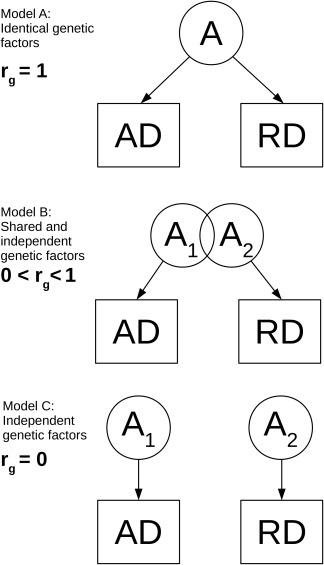
Genetic correlations between phenotypes. The genetic correlation (r g) between two phenotypes (AD and RD) can explain whether additive genetic factors (A, A 1, A 2) are identical (Model A), share some factors (Model B), or are wholly independent (Model C)
In this study, we performed bivariate twin analyses to determine the extent to which AD and RD share genetic and environmental influences in 15 white matter tracts. We also investigated what proportion of genetic variance in FA and MD is explained by AD and RD. Determining the extent of shared or independent genetic influences on AD and RD will be informative regarding genetic, shared environmental, and independent mechanisms underlying axonal morphometry and myelination.
2. MATERIALS AND METHODS
2.1. Participants
Participants in the VETSA MRI cohort (Kremen et al., 2010) were recruited from the Vietnam Era Twin Registry, a nationally distributed sample of male–male twin pairs who served in the United States military at some time between 1965 and 1975 (Goldberg, Curran, Vitek, Henderson, & Boyko, 2002; Tsai et al., 2013). Participants have similar health and lifestyle characteristics to American men in their age range (Schoenborn & Heyman, 2009). Although all VETSA participants are veterans, most (≈80%) did not experience combat situations. The present sample comprised 393 participants with a mean age of 61.8 (±2.6; range, 56.7–65.6) the majority of whom were white (88.8%), with an average education of 13.8 (SD, 2.1) years. This is the same cohort as previously reported by our group (Vuoksimaa et al., 2017). The sample included 85 full pairs of monozygotic (MZ) and 58 full pairs of dizygotic (DZ) twins, as well as 107 unpaired individuals. Zygosity was determined from DNA as previously described (Eyler et al., 2012). The study was conducted under local institutional review board supervision at the participating institutions, and all participants provided signed informed consent prior to their participation.
2.2. Magnetic resonance imaging acquisition and analysis
T1‐weighted and diffusion‐weighted images were acquired on 3 T scanners at University of California, San Diego (UCSD) and Massachusetts General Hospital (MGH) as previously reported (McEvoy et al., 2015; Vuoksimaa et al., 2017). At UCSD, images were acquired on a GE 3 T Discovery 750 scanner (GE Healthcare, Waukesha, WI, USA) with an eight‐channel phased array head coil. The imaging protocol included a sagittal 3D fast spoiled gradient echo (FSPGR) T1‐weighted image (TE = 3.164 ms, TR = 8.084 ms, TI = 600 ms, flip angle = 8°, pixel bandwidth = 244.141, FOV = 24 cm, frequency = 256, phase = 192, slices = 172, slice thickness = 1.2 mm), and a diffusion‐weighted image with 51 diffusion directions, b value = 1000 s/mm2, integrated with a pair of b = 0 images with opposite phase‐encode polarity, TR = 9700 ms, TE 80–84 ms, pixel bandwidth 3906.25. At MGH, images were acquired with a Siemens Tim Trio, (Siemens USA, Washington, D.C.) with a 32‐channel head coil. The imaging protocol included a 3D magnetization‐prepared rapid gradient echo (MPRAGE) T1‐weighted image (TE = 4.33 ms, TR = 2170 ms, TI = 1100 ms, flip angle = 7°, pixel bandwidth = 140, slices = 160, slice thickness = 1.2 mm), and a diffusion‐weighted image consisting two separate b = 0 images with opposite phase‐encode polarity, followed by two scans with 30 diffusion directions, b value = 1000 s/mm2 (and one b = 0 image), TR = 9500 ms, TE = 94 ms, and pixel bandwidth = 1371.
Raw image files were processed with an automated stream written in MATLAB and C++ by the UCSD Center for Multimodal Imaging and Genetics. Data with severe scanner artifacts or excessive head motion were excluded from the analysis. T1‐weighted structural images were corrected for gradient distortions (Jovicich et al., 2006) and N3 intensity normalisation (Sled, Zijdenbos, & Evans, 1998). Diffusion‐weighted images were corrected for eddy current distortion (Zhuang et al., 2006), head motion (Hagler et al., 2009), B0‐susceptibility distortions (Holland, Kuperman, & Dale, 2010), then registered to T1 images using mutual information (Wells, Viola, Atsumi, Nakajima, & Kikinis, 1996) and then rigidly resampled into the standard T1‐based orientation at a 2 × 2 × 2 mm resolution using cubic interpolation at all resampling steps.
Diffusivity measurements were derived from major white matter tracts using a probabilistic diffusion tensor atlas of fiber tract locations and orientations (Hagler et al., 2009). To ensure that tracts are only reconstructed within white matter regions, grey matter regions of the basal ganglia and thalamus as well as regions of cerebrospinal fluid were used as exclusion masks based on their anatomical location derived from FreeSurfer version 5.1 (Fischl, 2012). Average AD and RD were calculated for each fiber tract, weighted by the fiber probability at each voxel. We averaged diffusion indices from homologous tracts in left and right hemispheres and examined 11 major tracts: (a) anterior thalamic radiation, (b) cingulum, and (c) hippocampal portions of the cingulate bundle, (d) fornix, (e) interior frontal superior frontal cortex, (f) inferior fronto‐occipital fasciculus, (g) inferior longitudinal fasciculus, (h) striatal interior frontal cortex, (i) superior longitudinal fasciculi (SLF, also reporting the temporal and parietal portions), (j) superior corticostriate tract (also reporting the frontal and parietal portions), and (k) uncinate fasciculus. Three additional mid‐hemispheric structures did not require averaging, namely, the corpus callosum, forceps minor, and forceps major. Two compound measures are also provided: all fibers averaged (referred to as “total tracts”) and all fibers excluding the corpus callosum averaged (referred to as “total tracts excluding the corpus callosum”). The corticospinal tracts were excluded from the present investigation due to reports of very low heritability (Jahanshad et al., 2013a).
2.3. Statistical analysis
To examine the effect of scanner and age on diffusivity measures, we use linear mixed models implemented within the R (R Core Team, 2017) package nlme version 3.1–131 (Pinheiro, Bates, DebRoy, Sarkar, & Team, 2017), setting the relatedness of the twins as a random effect.
Bivariate biometrical models were fit to the data using the maximum‐likelihood based structural equation modeling program OpenMx in R (Boker et al., 2011; Neale et al., 2016). In univariate twin analyses, the variance of a phenotype is decomposed into additive genetic (A), common environmental (C), and unique environmental (E) effects. The resulting model is widely referred to as the ACE model. In MZ twin pairs, the A effects are set to correlate 1.0 as MZ pairs are assumed to share all of their DNA, whereas DZ twin pairs share approximately half of their segregating genes; therefore, the assumed correlation of A effects is accordingly set at 0.5. The C effects correlate 1.0 in both MZ and DZ twin pairs, as these effects refer to all environmental effects that make members of a twin pair alike. The E effects are uncorrelated in all twin pairs because these refer to all environmental effects that make members of twin pair different from one another, together with measurement error. Twin modeling assumes that the means and variances do not differ between MZ and DZ or between first and second members of a twin pair.
Bivariate analyses extend the ACE model by decomposing both the variance of a phenotype into genetic and environmental components and the covariance estimates between phenotypes, thereby permitting the estimation of genetic and environment correlations.
All diffusivity measures were initially adjusted for age and scanner (UCSD or MGH) to facilitate the estimation of means, variances, and model parameters, without changing the inherent relationships between variables and members of a twin pair. It is important to note that the twin method does not depend on mean level differences, but rather the covariances between MZ and DZ twin pairs. Members of a twin pair were always scanned on the same scanner and pairs of each zygosity type were equally represented at both sites. Therefore, heritabilities or genetic correlations will be unaffected by the scanner differences. All diffusivity measures were standardized to a mean of 0 and a standard deviation of 1. Bivariate ACE models were fit to the diffusivity measures. The significance of the genetic and environmental correlations was determined through examination of their 95% confidence intervals (CIs), as well as by constraining the genetic covariance parameter to zero (i.e., r g = 0; Figure 1, Model C) and evaluating the resulting change in model fit via the likelihood‐ratio test (i.e., the change in −2 log‐likelihood between the full model and the model with the constrained parameter). Nonsignificant values (p > .05) indicate that the constrained model does not yield a significant change in the model fit relative to the full model, and therefore indicates that the parameter in question is not significantly different from zero (i.e., there are not distinctly separate genetic factors underlying each phenotype). Conversely, constraining the genetic covariance parameter to r g = 1 tests if the two phenotypes are influenced by the same genetic factors (Figure 1, Model A).
To determine the genetic variance of either FA or MD that is accounted for by AD and RD, we ran follow‐up bivariate analysis of only the total tracts measure for AD vs FA, RD vs FA, AD vs MD, and RD vs MD.
3. RESULTS
The mean and standard deviation of AD and RD in most tracts were significantly affected by scanner and/or age (Table 1), and subsequent analysis adjusted for these covariates. The genetic, common, and unique environmental standardized variance components for AD and RD are presented in Table 2. Bilateral AD and RD measures demonstrated moderate to high heritability (.72 for total tracts for both AD and RD). Heritability of AD for individual tracts ranged from .47 (95% CI: .24; .62) for the parahippocampal portion of the cingulum to .82 (95% CI: .54; .87) for the ILF. Similarly, the heritability of RD for individual tracts ranged from .42 (95% CI: .06; .73) for the parahippocampal portion of the cingulum to .82 (95% CI: .66; .87) for the inferior longitudinal fasciculus. Common environmental influences accounted for .00 (95% CI: .00; .12) of the variance in all fiber tract AD and .02 (95% CI: .00; .27) of the variance in all fiber tract RD. All of the C estimates for AD were at or near zero, the highest being .05 for the uncinate. Five regions had higher C estimates for RD: the frontal superior corticostriate (.14, 95% CI: .00; .40), a subcomponent of the superior corticostriate (.07, 95% CI: .00; .36), parahippocampal portion of the cingulum (.22, 95% CI: .00; .52), uncinate (.32, 95% CI: .00; .62), and total tracts excluding the corpus callosum (.08, 95% CI: .00; .36). However, none of these were statistically significant and the median C estimate for RD was only .02. Accordingly, subsequent correlational analysis used AE–AE models with the exception of the above mentioned regions which used AE–ACE models. Separate ACE–ACE and AE–AE model tables are provided in Supporting Information.
Table 1.
Mean diffusion measures for all fiber tracts and association with scanner and age
| Axial diffusivity (×10−3/s) | Radial diffusivity (×10−4/s) | |||||||||||
|---|---|---|---|---|---|---|---|---|---|---|---|---|
| Scanner effect | Age effect | Scanner effect | Age effect | |||||||||
| Fiber tract e | Mean | SD | t | p | r | p | Mean | SD | t | p | r | p |
| Total tracts | 1.30 | 0.03 | −7.51 | <.001 | 4.15 | <.001 | 0.61 | 0.03 | −2.72 | .007 | 4.21 | <.001 |
| Total tracts (excluding corpus callosum) | 1.22 | 0.03 | −1.11 | .269 | 3.88 | <.001 | 0.61 | 0.03 | −0.82 | .416 | 3.90 | <.001 |
| Anterior thalamic radiation | 1.18 | 0.05 | −1.66 | .099 | 4.19 | <.001 | 0.64 | 0.05 | 2.92 | .004 | 4.68 | <.001 |
| Cingulate portion of cingulum | 1.21 | 0.05 | −2.17 | .031 | −0.47 | .640 | 0.52 | 0.03 | −0.99 | .325 | 2.38 | .019 |
| Parahippocampal portion of cingulum | 1.15 | 0.07 | −12.06 | <.001 | 2.12 | .036 | 0.67 | 0.05 | −6.95 | <.001 | 1.37 | .172 |
| Corpus callosum | 1.46 | 0.05 | −12.98 | <.001 | 3.02 | .003 | 0.61 | 0.05 | −4.33 | <.001 | 3.49 | .001 |
| Forceps major | 1.55 | 0.13 | −28.03 | <.001 | 0.8 | .423 | 0.59 | 0.10 | −13.11 | <.001 | 1.30 | .194 |
| Forceps minor | 1.37 | 0.08 | 9.26 | <.001 | 2.63 | .009 | 0.65 | 0.06 | 5.77 | <.001 | 3.32 | .001 |
| Fornix | 1.78 | 0.14 | −5.50 | <.001 | 4.48 | <.001 | 1.14 | 0.13 | −7.15 | <.001 | 4.48 | <.001 |
| Inferior frontal superior frontal cortex | 1.09 | 0.04 | 1.89 | .060 | 2.22 | .028 | 0.58 | 0.04 | −0.05 | .957 | 2.80 | .006 |
| Inferior longitudinal fasciculus | 1.29 | 0.05 | 1.39 | .167 | 2.94 | .004 | 0.61 | 0.04 | 0.93 | .354 | 2.53 | .012 |
| Inferior fronto‐occipital fasciculus | 1.33 | 0.04 | 3.80 | <.001 | 3.11 | .002 | 0.62 | 0.04 | 2.48 | .014 | 3.38 | .001 |
| Superior longitudinal fasciculus (SLF) | 1.15 | 0.03 | −1.86 | .064 | 2.03 | .044 | 0.56 | 0.04 | −1.17 | .243 | 1.88 | .063 |
| Temporal SLF | 1.17 | 0.04 | −3.94 | <.001 | 1.98 | .050 | 0.55 | 0.04 | −1.74 | .083 | 1.44 | .153 |
| Parietal SLF | 1.13 | 0.03 | −1.43 | .154 | 1.94 | .054 | 0.57 | 0.04 | −1.38 | .168 | 2.27 | .025 |
| Superior corticostriate | 1.16 | 0.04 | 0.07 | .945 | 1.82 | .071 | 0.55 | 0.03 | −4.50 | <.001 | 2.17 | .032 |
| Frontal superior corticostriate | 1.12 | 0.04 | 2.12 | .035 | 1.96 | .052 | 0.55 | 0.03 | −3.17 | .002 | 2.70 | .008 |
| Parietal superior corticostriate | 1.19 | 0.04 | −1.25 | .213 | 1.60 | .111 | 0.54 | 0.03 | −4.63 | <.001 | 1.78 | .077 |
| Striatal inferior frontal cortex | 1.13 | 0.04 | 5.27 | <.001 | 3.16 | .002 | 0.60 | 0.04 | 1.84 | .067 | 3.59 | <.001 |
| Uncinate | 1.21 | 0.04 | 3.43 | .001 | 2.67 | .009 | 0.62 | 0.04 | −1.23 | .222 | 3.33 | .001 |
Table 2.
Standardized variance components for axial and radial diffusivity
| Axial diffusivity (AD) | Radial diffusivity (RD) | |||||
|---|---|---|---|---|---|---|
| Fiber Tract | a 2 (95% CI) | c 2 (95% CI) | e 2 (95% CI) | a 2 (95% CI) | c 2 (95% CI) | e 2 (95% CI) |
| Total tracts | .72 (.55; .80) | .00 (.00; .12) | .28 (.20; .41) | .72 (.43; .81) | .02 (.00; .27) | .26 (.19; .38) |
| Total tracts (excluding corpus callosum) | .79 (.63; .86) | .01 (.00; .16) | .20 (.14; .29) | .70 (.39; .84) | .08 (.00; .36) | .22 (.16; .32) |
| Anterior thalamic radiation | .69 (.49; .78) | .00 (.00; .17) | .31 (.22; .43) | .60 (.32; .71) | .00 (.00; .23) | .40 (.29; .55) |
| Cingulate portion of cingulum | .69 (.40; .79) | .01 (.00; .25) | .30 (.21; .43) | .74 (.41; .84) | .03 (.00; .34) | .23 (.16; .32) |
| Parahippocampal portion of cingulum | .47 (.24; .62) | .00 (.00; .14) | .53 (.37; .73) | .42 (.06; .73) | .22 (.00; .52) | .36 (.25; .50) |
| Corpus callosum | .66 (.39; .76) | .01 (.00; .24) | .33 (.24; .47) | .68 (.40; .79) | .03 (.00; .29) | .28 (.20; .40) |
| Forceps major | .56 (.24; .68) | .00 (.00; .27) | .44 (.32; .59) | .78 (.56; .84) | .00 (.00; .19) | .22 (.16; .32) |
| Forceps minor | .51 (.06; .66) | .02 (.00; .39) | .47 (.34; .64) | .70 (.32; .80) | .02 (.00; .36) | .28 (.20; .39) |
| Fornix | .48 (.08; .62) | .01 (.00; .36) | .50 (.38; .66) | .42 (.00; .59) | .05 (.00; .43) | .53 (.40; .69) |
| Inferior frontal superior frontal cortex | .78 (.58; .86) | .04 (.00; .22) | .18 (.13; .26) | .74 (.53; .85) | .05 (.00; .24) | .21 (.15; .30) |
| Inferior longitudinal fasciculus | .82 (.54; .87) | .00 (.00; .26) | .18 (.13; .26) | .82 (.66; .87) | .00 (.00; .14) | .18 (.13; .27) |
| Inferior fronto‐occipital fasciculus | .80 (.65; .86) | .00 (.00; .13) | .20 (.14; .29) | .76 (.56; .83) | .00 (.00; .18) | .24 (.17; .34) |
| Superior longitudinal fasciculus (SLF) | .77 (.50; .84) | .00 (.00; .25) | .23 (.16; .32) | .81 (.58; .87) | .00 (.00; .22) | .19 (.13; .27) |
| Temporal SLF | .77 (.47; .83) | .00 (.00; .27) | .23 (.17; .33) | .82 (.61; .87) | .00 (.00; .21) | .18 (.13; .25) |
| Parietal SLF | .76 (.55; .83) | .00 (.00; .19) | .24 (.17; .34) | .80 (.60; .86) | .00 (.00; .18) | .20 (.14; .29) |
| Superior corticostriate | .75 (.54; .83) | .01 (.00; .19) | .24 (.17; .35) | .72 (.42; .85) | .07 (.00; .36) | .21 (.15; .30) |
| Frontal superior corticostriate | .74 (.56; .83) | .02 (.00; .18) | .23 (.16; .34) | .65 (.37; .84) | .14 (.00; .40) | .21 (.15; .30) |
| Parietal superior corticostriate | .73 (.51; .82) | .00 (.00; .20) | .26 (.18; .38) | .77 (.44; .84) | .01 (.00; .32) | .22 (.16; .31) |
| Striatal inferior frontal cortex | .76 (.52; .83) | .00 (.00; .22) | .24 (.17; .34) | .71 (.40; .81) | .02 (.00; .30) | .27 (.19; .38) |
| Uncinate | .56 (.24; .70) | .05 (.00; .29) | .40 (.28; .56) | .42 (.09; .80) | .32 (.00; .62) | .25 (.18; .35) |
a 2 = additive genetic influences; c 2 = common environmental influences; e 2 = unique environmental influences. All estimates were derived from the bivariate Cholesky decomposition.
The phenotypic, genetic, common, and unique environment correlations for AD and RD for the best fit models are presented in Table 3. The genetic correlation between AD and RD was high in total tracts (r g = .67, 95% CI: .57; .75). All individual tracts showed significant genetic correlations between AD and RD except the cingulate portion of the cingulum and the superior corticostriate. Projection fibers showed little genetic correlation between AD and RD (superior corticostriate = .15, 95% CI: −.02; .32). The cingulate portion of the cingulum showed little genetic correlation (−.24, 95% CI: −.40; −.07), whereas the parahippocampal portion of the cingulum showed the highest genetic correlation (.85, 95% CI: .58; 1.0). Constraining the genetic correlation to either 0 or 1 (Table 3) showed significant changes in model fit in the majority of tracts, indicating that AD and RD in the majority of the tracts are influenced by both shared and unique genetic factors. However, when the genetic correlation was constrained to equal 0, there was not a significant reduction in model fit for the superior corticostriate (p = .0752), specifically the parietal subset of the superior corticostriate (p = .7025), indicating that AD and RD for this region may have entirely distinct genetic influences. Conversely, constraining the genetic correlation to equal 1 showed nonsignificant changes in model fit in the parahippocampal portion of the cingulum (p = .4240), indicating that AD and RD in this portion of this tract have the same genetic influences.
Table 3.
Best fit models of phenotypic, genetic, common, and environmental correlations among measures of axial and radial diffusivity
| Correlations (95% CI) | Significance tests | ||||||
|---|---|---|---|---|---|---|---|
| Fiber tract | r p | r g | r e | r g = 0 | r g = 1 | r e = 0 | r p = 0 |
| Total tracts | .70 (.64; .76) | .67 (.57; .75) | .79 (.69; .86) | <.0001 | <.0001 | <.0001 | <.0001 |
| Total tracts (excluding corpus callosum)* | .74 (.69; .79) | .74 (.67; .85) | .75 (.63; .83) | <.0001 | <.0001 | <.0001 | <.0001 |
| Anterior thalamic radiation | .76 (.71; .80) | .73 (.63; .81) | .82 (.73; .88) | <.0001 | <.0001 | <.0001 | <.0001 |
| Cingulate portion of cingulum | −.18 (−.28; −.07) | −.24 (−.40; −.07) | −.01 (−.23; .20) | .0055 | <.0001 | .9042 | .0064 |
| Parahippocampal portion of cingulum* | .61 (.54; .68) | .85 (.58; 1.0) | .50 (.31; .66) | <.0001 | .4240 | <.0001 | <.0001 |
| Corpus callosum | .61 (.54; .68) | .56 (.42; .66) | .74 (.63; .82) | <.0001 | <.0001 | <.0001 | <.0001 |
| Forceps major | .58 (.50; .65) | .65 (.52; .77) | .47 (.27; .62) | <.0001 | <.0001 | <.0001 | <.0001 |
| Forceps minor | .64 (.57; .70) | .66 (.53; .77) | .63 (.48; .74) | <.0001 | <.0001 | <.0001 | <.0001 |
| Fornix | .91 (.89; .93) | .88 (.81; .92) | .95 (.92; .96) | <.0001 | <.0001 | <.0001 | <.0001 |
| Inferior frontal superior frontal cortex | .68 (.61; .73) | .68 (.6; .76) | .65 (.50; .76) | <.0001 | <.0001 | <.0001 | <.0001 |
| Inferior longitudinal fasciculus | .64 (.57; .70) | .68 (.59; .76) | .48 (.29; .63) | <.0001 | <.0001 | <.0001 | <.0001 |
| Inferior fronto‐occipital fasciculus | .70 (.64; .75) | .74 (.65; .81) | .57 (.41; .70) | <.0001 | <.0001 | <.0001 | <.0001 |
| Superior longitudinal fasciculus (SLF) | .51 (.42; .59) | .51 (.39; .61) | .51 (.34; .66) | <.0001 | <.0001 | <.0001 | <.0001 |
| Temporal SLF | .52 (.43; .60) | .52 (.40; .62) | .54 (.37; .67) | <.0001 | <.0001 | <.0001 | <.0001 |
| Parietal SLF | .51 (.43; .59) | .52 (.40; .63) | .47 (.28; .62) | <.0001 | <.0001 | <.0001 | <.0001 |
| Superior corticostriate* | .20 (.09; .31) | .15 (−.02; .32) | .39 (.19; .56) | .0752 | <.0001 | .0003 | <.0001 |
| Frontal superior corticostriate* | .29 (.18; .39) | .25 (.08; .44) | .46 (.27; .62) | .0049 | <.0001 | <.0001 | <.0001 |
| Parietal superior corticostriate | .09 (−.02; .20) | .03 (−.14; .19) | .29 (.07; .48) | .7025 | <.0001 | .0092 | .0095 |
| Striatal inferior frontal cortex | .64 (.56; .70) | .64 (.53; .72) | .63 (.49; .74) | <.0001 | <.0001 | <.0001 | <.0001 |
| Uncinate* | .48 (.39; .56) | .63 (.42; .96) | .37 (.17; .54) | <.0001 | .0333 | <.0001 | <.0001 |
r p = phenotypic correlation; r g = genetic correlation; r e = unique environment correlation. All AD and the majority of RD measures did not indicate significant common environmental influences (refer to Table 2), and the AE–AE model is shown. Where there were significant common environmental influences (Table 2, c 2 > .05) the AE–ACE models are shown (denoted by *). Separate ACE–ACE and AE–AE model tables are provided in Supporting Information.
We followed this core analysis up with an investigation into the degree to which AD and RD separately account for the genetic variance in FA and MD. Comparing all‐tract measures of FA and AD, we found that both were highly heritable (FA a 2 = .73 CI: .42,.86; AD a 2 = .75 CI: .59,.83), and showed moderate genetic and phenotypic correlations (r g = −.41 CI: −.60, −.19; r p = −.41 CI: .50, .32). AD explained 16.4% of the genetic variance in FA. The negative genetic correlation here indicates that the shared genetic factors between these diffusivity measures produce opposing changes in magnitude (i.e., genes that cause increases in AD also tend to cause decreases in FA). Comparing all‐tract measures of FA and RD, both were highly heritable (FA a 2 = .72 CI: .42,.86; RD a 2 = .70 CI: .44,.82), and showed strong genetic and phenotypic correlations (r g = −.91 CI: −.94,−.84; r p = −.91 CI: −.93,−.89). In this pairing, however, RD explained 82.3% of the genetic variance in FA. Although a similar pattern of effects was observed for all‐tracts MD, the variance accounted for by the AD and RD measures was greater. Comparing MD and AD, both were highly heritable (MD a 2 = .74 CI: .53, .83; AD a 2 = .75 CI: .59, .83), and showed strong genetic and phenotypic correlations (r g = .86 CI: .80, .92; r p = .86 CI: .83, .89). AD explained 74.1% of the genetic variance in MD. Comparing MD and RD, both were highly heritable (MD a 2 = .73 CI: .47, .83; RD a 2 = .72 CI: .45, .83), and showed very high genetic and phenotypic correlations (r g = .97 CI: .96, .98; r p = .98 CI: .97, .98). RD explained 95.0% of the genetic variance in MD.
4. DISCUSSION
We sought to clarify whether the same or different genetic and environmental factors contribute to AD and RD. We report that AD and RD exhibit significant heritability estimates of generally similar magnitude in most of the bilateral tracts measured, consistent with our prior report of diffusivity heritability estimates separately for left and right hemispheres (Vuoksimaa et al., 2017). The core novel finding is that there are strong genetic correlations between AD and RD in the majority of tracts measured. Genetic correlations for the two total tracts measures plus 14 of 18 individual tract measures were ≥.50 (median = .67; range: .50–.89; Table 3) in line with the previous report of r g = 0.61 for the corpus callosum (Kanchibhotla et al., 2014). These results indicate substantial shared genetic influences underlying AD and RD that would play a role in the neurobiological mechanisms that underpin these two measures. On the other hand, the genetic correlations were all significantly different from 1 indicating that there are also distinct genetic influences specific to AD and RD for most tracts.
We showed that the genetic variance of FA—the most widely used DTI metric—is predominately explained by RD (82%) over AD (16%). Similarly, the genetic variance of MD was predominately explained by RD (95%) over AD (74%). These findings are in line with a family pedigrees study of whole brain diffusivity (Kochunov et al., 2010). It is perhaps not surprising that more of the genetic variance in FA or MD is accounted for by RD rather than AD because RD is based on two eigenvectors, whereas AD is based on only one.
We can potentially identify the shared and unique genes influencing AD and RD measures through genome‐wide association studies (GWAS) or a meta‐GWAS across multiple sites. Several GWAS of FA have identified single nucleotide polymorphisms (SNPs) located within genes involved in neural growth and cell adhesion (SPON1), lipid metabolism (LPIN2, HADH), cell adhesion (OPCML, KAZN) and trafficking (CCDC91), serotonin receptor (HTR7), g‐protein coupled receptor (GNA13), and several intergenic SNPs (Chiang et al., 2012; Jahanshad et al., 2013b; Sprooten et al., 2014). Although this research highlights that white matter cellular processes give rise to diffusion variations, these GWAS of FA do not replicate the same SNPs between studies. Our results are informative to subsequent GWAS since we show that AD and RD, subcomponents of FA, have shared and distinct genetic factors. Inconsistencies in FA GWAS results may be due to some studies identifying distinctly AD genes and other studies identifying distinctly RD genes, and this discrepancy may be obscured when looking at FA alone. Indeed, a study of over 6,000 individuals was not able to replicate any candidate genes previously associated with FA (Jahanshad et al., 2017). To clarify the canonical genetic factors influencing diffusivity measures, it would be very informative to perform separate GWAS/meta‐GWAS to determine if significant SNPs in FA, AD, and RD are shared and/or unique.
Although most tracts demonstrated shared and unique genetic influences between AD and RD, there were a few notable exceptions. The parahippocampal portion of the cingulum showed some of the lowest heritability concomitant with higher common environmental influences in agreement with neonate twins findings (Lee et al., 2015). For this tract, the model fit did not change when constraining r g = 1, indicating that the two traits are under the influence of the same genes. Conversely, the parietal portion of the superior corticostriate showed high heritability and the model fit did not change when constraining r g = 0 indicating that the two traits are under entirely different genetic influences resulting in low phenotypic and genetic correlation. Finally, while the majority of tracts showed positive correlations, the cingulate portion of the cingulum had negative genetic and phenotypic correlations suggesting that the shared and unique genetic influences on AD and RD within this tract are operating in opposite direction.
5. LIMITATIONS
It is important to note the inherent problems of diffusion microstructure metrics and interpretations of AD and RD (Jones, Knosche, & Turner, 2013). The initial AD and RD metrics were derived from an experimental rodent species (Song et al., 2002, 2005) that may not accurately reflect the microstructural changes that occur in humans in normal brain development and aging. For example, normal age‐related neuropathology such as inflammation, lacunar infarctions, and atrophy may introduce additional fluid/tissue partial volume estimates that alter the magnitude of individual eigenvectors and associated eigenvalues (Basser & Pajevic, 2000; Field et al., 2004). This issue is relevant for all studies of AD and RD, and is not specific to this study.
This study has several specific limitations. The present investigation was restricted to men and may not be applicable to women. This is particularly relevant given a recent investigation using the Human Connectome Project database (n = 481; 194 male, 287 female) showing that sex was the only covariate evaluated that significantly contributed to the phenotypic variance in heritability of whole‐brain averaged FA (Kochunov et al., 2015). Our study also included participants in a relatively narrow age range. With well‐known age‐related changes in white matter, it will be important to examine the genetic and environmental associations between AD and RD in samples of different ages. On the other hand, it is of value to have specific age ranges well characterized. Moreover, as noted, our heritability estimates were similar to those of prior reports, suggesting that our results may, in fact, be generalizable to other age groups or mixed‐sex samples. Finally, future studies should acquire a retest diffusivity dataset to confirm that unique environmental correlations are not significantly skewed by measurement error (i.e., image acquisition variations due to variations in head placement, subject hydration and movement, etc.) as well as examining whether AD and RD heritability is differentially affected by measurement error.
6. CONCLUSIONS
Using bivariate twin models, we have shown here that AD and RD are influenced to a large extent by shared genetic factors in most major white matter pathways of the brain, but there are also significant unique genetic factors influencing each of these diffusivity indices. A GWAS of FA, AD, and RD in the same individuals would help to identify the shared and unique “white matter microarchitecture genes” that give rise to diffusivity alterations seen in routine MRI exams. Based on the genetic correlations we observed, we hypothesize that there should be significant overlap of SNPs that are associated with FA, AD, and RD in the majority of tracts, with the exception of the cingulum and superior corticostriate. This information will help further our understanding of neuronal development, healthy brain aging, brain evolution, the neuropathological origins of common psychiatric disorders, and neurodegenerative disorders. Finally, the fact that there are some distinct genetic influences on each diffusivity measure suggests that genetic studies should examine the individual contributions of AD and RD to the composite measures FA and MD.
FUNDING
This work was supported by National Institutes of Health Grants NIA R01 AG018384, R01 AG018386, R01 AG022381, R03 AG046413, R01 AG022982, K08 AG047903, and, in part, with resources of the VA San Diego Center of Excellence for Stress and Mental Health. The Cooperative Studies Program of the Office of Research & Development of the U.S. Department of Veterans Affairs has provided financial support for the development and maintenance of the Vietnam Era Twin (VET) Registry.
CONFLICTS OF INTEREST
Anders M. Dale is a founder and holds equity in CorTechs Laboratories, Inc., and also serves on its Scientific Advisory Board. The terms of this arrangement have been reviewed and approved by the University of California, San Diego, in accordance with its conflict of interest policies. All other authors report no potential conflicts of interest.
Supporting information
Additional Supporting Information may be found online in the supporting information tab for this article.
Supporting Information
ACKNOWLEDGMENTS
The content of this article is the responsibility of the authors and does not represent official views of NIA/NIH, or the VA. The Cooperative Studies Program of the U.S. Department of Veterans Affairs provided financial support for development and maintenance of the Vietnam Era Twin Registry. The authors would also like to acknowledge the continued cooperation and participation of the members of the VET Registry and their families.
Hatton SN, Panizzon MS, Vuoksimaa E, et al. Genetic relatedness of axial and radial diffusivity indices of cerebral white matter microstructure in late middle age. Hum Brain Mapp. 2018;39:2235–2245. 10.1002/hbm.24002
Funding information National Institutes of Health, Grant/Award Numbers: NIA R01 AG018384, R01 AG018386, R01 AG022381, R03 AG046413, R01 AG022982, K08 AG047903; VA San Diego Center of Excellence for Stress and Mental Health; Cooperative Studies Program of the Office of Research & Development of the U.S. Department of Veterans Affairs
REFERENCES
- Alexander, A. L. , Hurley, S. A. , Samsonov, A. A. , Adluru, N. , Hosseinbor, A. P. , Mossahebi, P. , … Field, A. S. (2011). Characterization of cerebral white matter properties using quantitative magnetic resonance imaging stains. Brain Connectivity, 1(6), 423–446. [DOI] [PMC free article] [PubMed] [Google Scholar]
- Assaf, Y. , & Pasternak, O. (2008). Diffusion tensor imaging (DTI)‐based white matter mapping in brain research: A review. Journal of Molecular Neuroscience, 34(1), 51–61. [DOI] [PubMed] [Google Scholar]
- Bartzokis, G. , Beckson, M. , Lu, P. H. , Nuechterlein, K. H. , Edwards, N. , & Mintz, J. (2001). Age‐related changes in frontal and temporal lobe volumes in men: A magnetic resonance imaging study. Archives of General Psychiatry, 58(5), 461–465. [DOI] [PubMed] [Google Scholar]
- Basser, P. J. , & Pajevic, S. (2000). Statistical artifacts in diffusion tensor MRI (DT‐MRI) caused by background noise. Magnetic Resonance in Medicine, 44(1), 41–50. [DOI] [PubMed] [Google Scholar]
- Boker, S. , Neale, M. , Maes, H. , Wilde, M. , Spiegel, M. , Brick, T. , … Fox, J. (2011). OpenMx: An open source extended structural equation modeling framework. Psychometrika, 76(2), 306–317. [DOI] [PMC free article] [PubMed] [Google Scholar]
- Brouwer, R. M. , Mandl, R. C. , Peper, J. S. , van Baal, G. C. , Kahn, R. S. , Boomsma, D. I. , & Hulshoff Pol, H. E. (2010). Heritability of DTI and MTR in nine‐year‐old children. NeuroImage, 53(3), 1085–1092. [DOI] [PubMed] [Google Scholar]
- Chen, C. I. , Mar, S. , Brown, S. , Song, S. K. , & Benzinger, T. L. (2011). Neuropathologic correlates for diffusion tensor imaging in postinfectious encephalopathy. Pediatric Neurology, 44(5), 389–393. [DOI] [PMC free article] [PubMed] [Google Scholar]
- Chiang, M. C. , Barysheva, M. , Lee, A. D. , Madsen, S. , Klunder, A. D. , Toga, A. W. , … Thompson, P. M. (2008). Brain fiber architecture, genetics, and intelligence: A high angular resolution diffusion imaging (HARDI) study. Medical Image Computing and Computer‐Assisted Intervention, 11, 1060–1067. [DOI] [PMC free article] [PubMed] [Google Scholar]
- Chiang, M. C. , Barysheva, M. , McMahon, K. L. , de Zubicaray, G. I. , Johnson, K. , Montgomery, G. W. , … Thompson, P. M. (2012). Gene network effects on brain microstructure and intellectual performance identified in 472 twins. Journal of Neuroscience, 32(25), 8732–8745. [DOI] [PMC free article] [PubMed] [Google Scholar]
- Chiang, M. C. , McMahon, K. L. , de Zubicaray, G. I. , Martin, N. G. , Hickie, I. , Toga, A. W. , … Thompson, P. M. (2011). Genetics of white matter development: A DTI study of 705 twins and their siblings aged 12 to 29. NeuroImage, 54(3), 2308–2317. [DOI] [PMC free article] [PubMed] [Google Scholar]
- Duarte‐Carvajalino, J. M. , Jahanshad, N. , Lenglet, C. , McMahon, K. L. , de Zubicaray, G. I. , Martin, N. G. , … Sapiro, G. (2012). Hierarchical topological network analysis of anatomical human brain connectivity and differences related to sex and kinship. NeuroImage, 59(4), 3784–3804. [DOI] [PMC free article] [PubMed] [Google Scholar]
- Eyler, L. T. , Chen, C. H. , Panizzon, M. S. , Fennema‐Notestine, C. , Neale, M. C. , Jak, A. , … Kremen, W. S. (2012). A comparison of heritability maps of cortical surface area and thickness and the influence of adjustment for whole brain measures: A magnetic resonance imaging twin study. Twin Research and Human Genetics, 15(03), 304–314. [DOI] [PMC free article] [PubMed] [Google Scholar]
- Field, A. S. , Alexander, A. L. , Wu, Y. C. , Hasan, K. M. , Witwer, B. , & Badie, B. (2004). Diffusion tensor eigenvector directional color imaging patterns in the evaluation of cerebral white matter tracts altered by tumor. Journal of Magnetic Resonance Imaging, 20(4), 555–562. [DOI] [PubMed] [Google Scholar]
- Fischl, B. (2012). FreeSurfer. NeuroImage, 62(2), 774–781. [DOI] [PMC free article] [PubMed] [Google Scholar]
- Freund, P. , Wheeler‐Kingshott, C. A. , Nagy, Z. , Gorgoraptis, N. , Weiskopf, N. , Friston, K. , … Hutton, C. (2012). Axonal integrity predicts cortical reorganisation following cervical injury. Journal of Neurology, Neurosurgery & Psychiatry, 83(6), 629–637. [DOI] [PMC free article] [PubMed] [Google Scholar]
- Giedd, J.N. (2004). Structural magnetic resonance imaging of the adolescent brain. Ann N Y Acad Sci, 1021, 77–85. [DOI] [PubMed] [Google Scholar]
- Giedd, J.N. , Blumenthal, J. , Jeffries, N.O. , Castellanos, F.X. , Liu, H. , Zijdenbos, A. , … Rapoport, J.L. (1999). Brain development during childhood and adolescence: a longitudinal MRI study. Nature neuroscience, 2, 861–863. [DOI] [PubMed] [Google Scholar]
- Goldberg, J. , Curran, B. , Vitek, M. E. , Henderson, W. G. , & Boyko, E. J. (2002). The Vietnam Era Twin Registry. Twin Research, 5(5), 476–481. [DOI] [PubMed] [Google Scholar]
- Hagler, D. J., Jr. , Ahmadi, M. E. , Kuperman, J. , Holland, D. , McDonald, C. R. , Halgren, E. , & Dale, A. M. (2009). Automated white‐matter tractography using a probabilistic diffusion tensor atlas: Application to temporal lobe epilepsy. Human Brain Mapping, 30(5), 1535–1547. [DOI] [PMC free article] [PubMed] [Google Scholar]
- Harsan, L. A. , Poulet, P. , Guignard, B. , Steibel, J. , Parizel, N. , de Sousa, P. L. , … Ghandour, M. S. (2006). Brain dysmyelination and recovery assessment by noninvasive in vivo diffusion tensor magnetic resonance imaging. Journal of Neuroscience Research, 83(3), 392–402. [DOI] [PubMed] [Google Scholar]
- Holland, D. , Kuperman, J. M. , & Dale, A. M. (2010). Efficient correction of inhomogeneous static magnetic field‐induced distortion in Echo Planar Imaging. NeuroImage, 50(1), 175–183. [DOI] [PMC free article] [PubMed] [Google Scholar]
- Horsfield, M. A. , Larsson, H. B. , Jones, D. K. , & Gass, A. (1998). Diffusion magnetic resonance imaging in multiple sclerosis. Journal of Neurology, Neurosurgery, & Psychiatry, 64 Suppl 1, S80–S84. [PubMed] [Google Scholar]
- Huppi, P. S. , Maier, S. E. , Peled, S. , Zientara, G. P. , Barnes, P. D. , Jolesz, F. A. , & Volpe, J. J. (1998). Microstructural development of human newborn cerebral white matter assessed in vivo by diffusion tensor magnetic resonance imaging. Pediatric Research, 44(4), 584–590. [DOI] [PubMed] [Google Scholar]
- Jahanshad, N. , Ganjgahi, H. , Bralten, J. , den Braber, A. , Faskowitz, J. , Knodt, A. , … Kochunov, P. (2017). Do candidate genes affect the brain's white matter microstructure? Large‐scale evaluation of 6,165 diffusion MRI scans. BioRxiv. [Google Scholar]
- Jahanshad, N. , Kochunov, P. V. , Sprooten, E. , Mandl, R. C. , Nichols, T. E. , Almasy, L. , … Glahn, D. C. (2013a). Multi‐site genetic analysis of diffusion images and voxelwise heritability analysis: A pilot project of the ENIGMA‐DTI working group. NeuroImage, 81, 455–469. [DOI] [PMC free article] [PubMed] [Google Scholar]
- Jahanshad, N. , Lee, A. D. , Barysheva, M. , McMahon, K. L. , de Zubicaray, G. I. , Martin, N. G. , … Thompson, P. M. (2010). Genetic influences on brain asymmetry: A DTI study of 374 twins and siblings. NeuroImage, 52(2), 455–469. [DOI] [PMC free article] [PubMed] [Google Scholar]
- Jahanshad, N. , Rajagopalan, P. , Hua, X. , Hibar, D. P. , Nir, T. M. , Toga, A. W. , … Thompson, P. M. Alzheimer's Disease Neuroimaging, I . (2013b). Genome‐wide scan of healthy human connectome discovers SPON1 gene variant influencing dementia severity. Proc Natl Acad Sci U S A, 110, 4768–4773. [DOI] [PMC free article] [PubMed] [Google Scholar]
- Jones, D. K. , Knosche, T. R. , & Turner, R. (2013). White matter integrity, fiber count, and other fallacies: The do's and don'ts of diffusion MRI. NeuroImage, 73, 239–254. [DOI] [PubMed] [Google Scholar]
- Jovicich, J. , Czanner, S. , Greve, D. , Haley, E. , van der Kouwe, A. , Gollub, R. , … Dale, A. (2006). Reliability in multi‐site structural MRI studies: Effects of gradient non‐linearity correction on phantom and human data. NeuroImage, 30(2), 436–443. [DOI] [PubMed] [Google Scholar]
- Kanchibhotla, S. C. , Mather, K. A. , Thalamuthu, A. , Zhuang, L. , Schofield, P. R. , Kwok, J. B. , … Sachdev, P. S. (2014). Genetics of microstructure of the corpus callosum in older adults. PLoS One, 9(12), e113181. [DOI] [PMC free article] [PubMed] [Google Scholar]
- Klawiter, E. C. , Xu, J. , Naismith, R. T. , Benzinger, T. L. , Shimony, J. S. , Lancia, S. , … Cross, A. H. (2012). Increased radial diffusivity in spinal cord lesions in neuromyelitis optica compared with multiple sclerosis. Multiple Sclerosis Journal, 18(9), 1259–1268. [DOI] [PMC free article] [PubMed] [Google Scholar]
- Kochunov, P. , Glahn, D. C. , Lancaster, J. L. , Winkler, A. M. , Smith, S. , Thompson, P. M. , … Blangero, J. (2010). Genetics of microstructure of cerebral white matter using diffusion tensor imaging. NeuroImage, 53(3), 1109–1116. [DOI] [PMC free article] [PubMed] [Google Scholar]
- Kochunov, P. , Jahanshad, N. , Marcus, D. , Winkler, A. , Sprooten, E. , Nichols, T. E. , … Van Essen, D. C. (2015). Heritability of fractional anisotropy in human white matter: A comparison of Human Connectome Project and ENIGMA‐DTI data. NeuroImage, 111, 300–311. [DOI] [PMC free article] [PubMed] [Google Scholar]
- Kremen, W. S. , Franz, C. E. , & Lyons, M. J. (2013a). VETSA: The Vietnam Era Twin Study of Aging. Twin Research and Human Genetics, 16, 399–402. [DOI] [PMC free article] [PubMed] [Google Scholar]
- Kremen, W. S. , Franz, C. E. , & Lyons, M. J. (2013b). VETSA: The Vietnam Era Twin Study of Aging ‐ Addendum. Twin Research and Human Genetics, 16(1), 403. [DOI] [PMC free article] [PubMed] [Google Scholar]
- Kremen, W. S. , Prom‐Wormley, E. , Panizzon, M. S. , Eyler, L. T. , Fischl, B. , Neale, M. C. , … Fennema‐Notestine, C. (2010). Genetic and environmental influences on the size of specific brain regions in midlife: The VETSA MRI study. NeuroImage, 49(2), 1213–1223. [DOI] [PMC free article] [PubMed] [Google Scholar]
- Kremen, W. S. , Thompson‐Brenner, H. , Leung, Y. M. , Grant, M. D. , Franz, C. E. , Eisen, S. A. , … Lyons, M. J. (2006). Genes, environment, and time: The Vietnam Era Twin Study of Aging (VETSA). Twin Research and Human Genetics, 9(06), 1009–1022. [DOI] [PubMed] [Google Scholar]
- Lebel, C. , Beaulieu, C. (2011). Longitudinal development of human brain wiring continues from childhood into adulthood. J Neurosci, 31, 10937–10947. [DOI] [PMC free article] [PubMed] [Google Scholar]
- Lebel, C. , Walker, L. , Leemans, A. , Phillips, L. , & Beaulieu, C. (2008). Microstructural maturation of the human brain from childhood to adulthood. Neuroimage, 40, 1044–1055. [DOI] [PubMed] [Google Scholar]
- Lee, S. J. , Steiner, R. J. , Luo, S. , Neale, M. C. , Styner, M. , Zhu, H. , & Gilmore, J. H. (2015). Quantitative tract‐based white matter heritability in twin neonates. NeuroImage, 111, 123–135. [DOI] [PMC free article] [PubMed] [Google Scholar]
- McEvoy, L. K. , Fennema‐Notestine, C. , Eyler, L. T. , Franz, C. E. , Hagler, D. J., Jr. , Lyons, M. J. , … Kremen, W. S. (2015). Hypertension‐related alterations in white matter microstructure detectable in middle age. Hypertension, 66(2), 317–323. [DOI] [PMC free article] [PubMed] [Google Scholar]
- Mukherjee, P. , Miller, J. H. , Shimony, J. S. , Conturo, T. E. , Lee, B. C. , Almli, C. R. , & McKinstry, R. C. (2001). Normal brain maturation during childhood: Developmental trends characterized with diffusion‐tensor MR imaging. Radiology, 221(2), 349–358. [DOI] [PubMed] [Google Scholar]
- Naismith, R. T. , Xu, J. , Tutlam, N. T. , Scully, P. T. , Trinkaus, K. , Snyder, A. Z. , … Cross, A. H. (2010). Increased diffusivity in acute multiple sclerosis lesions predicts risk of black hole. Neurology, 74(21), 1694–1701. [DOI] [PMC free article] [PubMed] [Google Scholar]
- Neale, M. C. , & Cardon, L. R. (1992). Methodology for genetic studies of twins and families. Dordrecht, The Netherlands: Kluwer Academic Publishers. [Google Scholar]
- Neale, M. C. , Hunter, M. D. , Pritikin, J. N. , Zahery, M. , Brick, T. R. , Kirkpatrick, R. M. , … Boker, S. M. (2016). OpenMx 2.0: Extended structural equation and statistical modeling. Psychometrika, 81(2), 535–549. [DOI] [PMC free article] [PubMed] [Google Scholar]
- Paus, T. , Collins, D.L. , Evans, A.C. , Leonard, G. , Pike, B. , & Zijdenbos, A. (2001). Maturation of white matter in the human brain: a review of magnetic resonance studies. Brain research bulletin, 54, 255–266. [DOI] [PubMed] [Google Scholar]
- Pinheiro, J. , Bates, D. , DebRoy, S. , Sarkar, D. , & Team, R. C. (2017). nlme: Linear and Nonlinear Mixed Effects Models. 3.1–131 ed.
- R Core Team . (2017). R: A language and environment for statistical computing. Vienna, Austria: R Foundation for Statistical Computing. [Google Scholar]
- Schoenborn, C. A. , & Heyman, K. M. (2009). Health characteristics of adults aged 55 years and over: United States, 2004–2007. National Health Statistics Reports, 1–31. [PubMed] [Google Scholar]
- Sled, J. G. , Zijdenbos, A. P. , & Evans, A. C. (1998). A nonparametric method for automatic correction of intensity nonuniformity in MRI data. IEEE Transactions on Medical Imaging, 17(1), 87–97. [DOI] [PubMed] [Google Scholar]
- Song, S. K. , Sun, S. W. , Ramsbottom, M. J. , Chang, C. , Russell, J. , & Cross, A. H. (2002). Dysmyelination revealed through MRI as increased radial (but unchanged axial) diffusion of water. NeuroImage, 17(3), 1429–1436. [DOI] [PubMed] [Google Scholar]
- Song, S. K. , Yoshino, J. , Le, T. Q. , Lin, S. J. , Sun, S. W. , Cross, A. H. , & Armstrong, R. C. (2005). Demyelination increases radial diffusivity in corpus callosum of mouse brain. NeuroImage, 26(1), 132–140. [DOI] [PubMed] [Google Scholar]
- Sowell, E. R. , Peterson, B. S. , Thompson, P. M. , Welcome, S. E. , Henkenius, A. L. , & Toga, A. W. (2003). Mapping cortical change across the human life span. Nature Neuroscience, 6(3), 309–315. [DOI] [PubMed] [Google Scholar]
- Sowell, E. R. , Trauner, D. A. , Gamst, A. , & Jernigan, T.L. (2002). Development of cortical and subcortical brain structures in childhood and adolescence: a structural MRI study. Developmental medicine and child neurology, 44, 4–16. [DOI] [PubMed] [Google Scholar]
- Sprooten, E. , Knowles, E. E. , McKay, D. R. , Goring, H. H. , Curran, J. E. , Kent, J. W., Jr. , … Glahn, D. C. (2014). Common genetic variants and gene expression associated with white matter microstructure in the human brain. NeuroImage, 97, 252–261. [DOI] [PMC free article] [PubMed] [Google Scholar]
- Sun, S. W. , Liang, H. F. , Trinkaus, K. , Cross, A. H. , Armstrong, R. C. , & Song, S. K. (2006). Noninvasive detection of cuprizone induced axonal damage and demyelination in the mouse corpus callosum. Magnetic Resonance in Medicine, 55(2), 302–308. [DOI] [PubMed] [Google Scholar]
- Tsai, M. , Mori, A. M. , Forsberg, C. W. , Waiss, N. , Sporleder, J. L. , Smith, N. L. , & Goldberg, J. (2013). The Vietnam Era Twin Registry: A quarter century of progress. Twin Research and Human Genetics, 16(01), 429–436. [DOI] [PubMed] [Google Scholar]
- Tyszka, J. M. , Readhead, C. , Bearer, E. L. , Pautler, R. G. , & Jacobs, R. E. (2006). Statistical diffusion tensor histology reveals regional dysmyelination effects in the shiverer mouse mutant. NeuroImage, 29(4), 1058–1065. [DOI] [PMC free article] [PubMed] [Google Scholar]
- Vuoksimaa, E. , Panizzon, M. S. , Hagler, D. J., Jr. , Hatton, S. N. , Fennema‐Notestine, C. , Rinker, D. , … Kremen, W. S. (2017). Heritability of white matter microstructure in late middle age: A twin study of tract‐based fractional anisotropy and absolute diffusivity indices. Human Brain Mapping, 38(4), 2026–2036. [DOI] [PMC free article] [PubMed] [Google Scholar]
- Walhovd, K. B. , Fjell, A. M. , Reinvang, I. , Lundervold, A. , Dale, A. M. , Eilertsen, D. E. , … Fischl, B. (2005). Effects of age on volumes of cortex, white matter and subcortical structures. Neurobiology of Aging, 26(9), 1261–1270. discussion 1275‐8. [DOI] [PubMed] [Google Scholar]
- Wells, W. M. , Viola, P. , Atsumi, H. , Nakajima, S. , & Kikinis, R. (1996). Multi‐modal volume registration by maximization of mutual information. Medical Image Analysis, 1(1), 35–51. [DOI] [PubMed] [Google Scholar]
- Werring, D. J. , Clark, C. A. , Barker, G. J. , Thompson, A. J. , & Miller, D. H. (1999). Diffusion tensor imaging of lesions and normal‐appearing white matter in multiple sclerosis. Neurology, 52(8), 1626–1632. [DOI] [PubMed] [Google Scholar]
- Westlye, L. T. , Walhovd, K. B. , Dale, A. M. , Bjornerud, A. , Due‐Tonnessen, P. , Engvig, A. , … Fjell, A. M. (2010). Life‐span changes of the human brain white matter: Diffusion tensor imaging (DTI) and volumetry. Cerebral Cortex, 20(9), 2055–2068. [DOI] [PubMed] [Google Scholar]
- Zhang, J. , Jones, M. , DeBoy, C. A. , Reich, D. S. , Farrell, J. A. , Hoffman, P. N. , … Calabresi, P. A. (2009). Diffusion tensor magnetic resonance imaging of Wallerian degeneration in rat spinal cord after dorsal root axotomy. Journal of Neuroscience, 29(10), 3160–3171. [DOI] [PMC free article] [PubMed] [Google Scholar]
- Zhuang, J. , Hrabe, J. , Kangarlu, A. , Xu, D. , Bansal, R. , Branch, C. A. , & Peterson, B. S. (2006). Correction of eddy‐current distortions in diffusion tensor images using the known directions and strengths of diffusion gradients. Journal of Magnetic Resonance Imaging, 24(5), 1188–1193. [DOI] [PMC free article] [PubMed] [Google Scholar]
Associated Data
This section collects any data citations, data availability statements, or supplementary materials included in this article.
Supplementary Materials
Additional Supporting Information may be found online in the supporting information tab for this article.
Supporting Information