

Abstract
Inhibitory interneurons sculpt the outputs of excitatory circuits to expand the dynamic range of information processing. In mammalian retina, >30 types of amacrine cells provide lateral inhibition to vertical, excitatory bipolar cell circuits, but functional roles for only a few amacrine cells are well established. Here, we elucidate the function of corticotropin-releasing hormone (CRH)-expressing amacrine cells labeled in Cre-transgenic mice of either sex. CRH cells costratify with the ON alpha ganglion cell, a neuron highly sensitive to positive contrast. Electrophysiological and optogenetic analyses demonstrate that two CRH types (CRH-1 and CRH-3) make GABAergic synapses with ON alpha cells. CRH-1 cells signal via graded membrane potential changes, whereas CRH-3 cells fire action potentials. Both types show sustained ON-type responses to positive contrast over a range of stimulus conditions. Optogenetic control of transmission at CRH-1 synapses demonstrates that these synapses are tuned to low temporal frequencies, maintaining GABA release during fast hyperpolarizations during brief periods of negative contrast. CRH amacrine cell output is suppressed by prolonged negative contrast, when ON alpha ganglion cells continue to receive inhibitory input from converging OFF-pathway amacrine cells; the converging ON- and OFF-pathway inhibition balances tonic excitatory drive to ON alpha cells. Previously, it was demonstrated that CRH-1 cells inhibit firing by suppressed-by-contrast (SbC) ganglion cells during positive contrast. Therefore, divergent outputs of CRH-1 cells inhibit two ganglion cell types with opposite responses to positive contrast. The opposing responses of ON alpha and SbC ganglion cells are explained by differing excitation/inhibition balance in the two circuits.
SIGNIFICANCE STATEMENT A goal of neuroscience research is to explain the function of neural circuits at the level of specific cell types. Here, we studied the function of specific types of inhibitory interneurons, corticotropin-releasing hormone (CRH) amacrine cells, in the mouse retina. Genetic tools were used to identify and manipulate CRH cells, which make GABAergic synapses with a well studied ganglion cell type, the ON alpha cell. CRH cells converge with other types of amacrine cells to tonically inhibit ON alpha cells and balance their high level of excitation. CRH cells diverge to different types of ganglion cell, the unique properties of which depend on their balance of excitation and inhibition.
Keywords: amacrine cell, corticotropin-releasing hormone, GABA, mouse retina, optogenetics, retinal ganglion cell
Introduction
The mammalian retina implements the first stage of visual processing via ∼35 parallel circuits that drive the same number of ganglion cell types, each of which encodes a different feature of the visual scene (Demb and Singer, 2015; Baden et al., 2016). At its core, each parallel circuit comprises one or more of the ∼15 types of excitatory bipolar cell converging on the ganglion cell (Helmstaedter et al., 2013; Sanes and Masland, 2015; Baden et al., 2016). Bipolar cells are glutamatergic interneurons depolarized by either light increments (ON bipolar cells) or decrements (OFF bipolar cells) (Wässle et al., 2009; Euler et al., 2014; Shekhar et al., 2016; Franke et al., 2017). Bipolar cell outputs are shaped by >30 types of amacrine cells, which make synapses with bipolar cell axon terminals and ganglion cell dendrites (MacNeil and Masland, 1998; Demb and Singer, 2015; Diamond, 2017). Amacrine cells are primarily inhibitory, releasing either GABA or glycine (Zhang and McCall, 2012). In addition, many types corelease a neuromodulator, peptide, or fast excitatory neurotransmitter (Bagnoli et al., 2003; Lee et al., 2014; Zhu et al., 2014; Hirasawa et al., 2015).
The functional roles of only a few types of amacrine cells are well established. These types include the starburst amacrine cell, which mediates a direction-selective computation (Vaney et al., 2012), and the AII and A17 amacrine cells, which play important roles in night vision (Grimes et al., 2010; Demb and Singer, 2012; Diamond, 2017). Additional amacrine cell types now can be studied functionally using Cre-transgenic mouse lines (Taniguchi et al., 2011; Lee et al., 2014; Zhu et al., 2014; Akrouh et al., 2015; Krishnaswamy et al., 2015; Park et al., 2015; Tien et al., 2016).
Two types of amacrine cell were identified in the corticotropin-releasing hormone (CRH)-ires-Cre-transgenic mouse (Zhu et al., 2014). One of these, CRH-1, makes synapses with a suppressed-by-contrast (SbC) ganglion cell that exhibits suppressed firing in response to either positive or negative contrast (Sivyer et al., 2010; Jacoby et al., 2015; Tien et al., 2015; Lee et al., 2016). CRH-1 provides GABAergic inhibition to suppress SbC firing during positive contrast (Jacoby et al., 2015). Another well studied ganglion cell type, the ON alpha cell, costratifies with CRH cells, suggesting that it also receives synaptic input from them. However, unlike the SbC cell, the ON alpha cell responds to positive contrast with increased firing. Here, we identify a third type of CRH cell and show that two CRH types (CRH-1 and CRH-3) make synapses with ON alpha cells. Outputs from CRH cells and OFF-pathway amacrine cells converge at ON alpha cells to control the gain of responses to tonic excitation from continuously active bipolar cell synapses. CRH-1 output diverges to two circuits, SbC and ON alpha ganglion cells, with opposite responses to positive contrast, demonstrating that a single inhibitory interneuron can contribute to diverse retinal outputs. The distinct contrast responses of SbC and ON alpha ganglion cells are explained by differences in the balance of excitation and inhibition in the two circuits.
Materials and Methods
Animals.
All animal procedures were approved by the Institutional Animal Care and Use Committees at Yale University or the University of Maryland and were in compliance with National Institutes of Health guidelines. Mice of either sex, maintained on C57BL/6J backgrounds, were studied at ages between 2 weeks and 6 months.
In CRH-ires-Cre mice [B6(Cg)-CRHtm1(cre)Zjh/J; The Jackson Laboratory #012704, RRID:IMSR_JAX:012704], expression of Cre recombinase is driven by endogenous CRH regulatory elements (Taniguchi et al., 2011). In nNOS-CreER mice (B6; 129S-Nos1tm1.1(cre/ERT2)/Zjh/J; The Jackson Laboratory #014541, RRID:IMSR_JAX:014541), expression of Cre recombinase is driven by endogenous Nos1 regulatory elements (Taniguchi et al., 2011). For nNOS-CreER mice, Cre expression was induced by tamoxifen (2 mg delivered on 2 consecutive days) administered by either intraperitoneal injection or gavage at approximately postnatal day 30 (P30) at least 2 weeks before the experiment.
Cre-expressing cells were labeled by mating a Cre mouse described above with one of two reporter strains: Ai14 mice (B6;129S6-Gt(ROSA)26Sortm14(CAG-tdTomato)Hze/J; The Jackson Laboratory #007914, RRID:IMSR_JAX:007914) express a Cre-dependent red fluorescent protein (tdTomato; Madisen et al., 2010) and Ai32 mice (B6;129S-Gt(ROSA)26Sortm32(CAG-COP4*H134R/EYFP)Hze/J; The Jackson Laboratory #024109, RRID:IMSR_JAX:024109) express a Cre-dependent channelrhodopsin-2 (ChR2)/enhanced yellow fluorescent protein (EYFP) fusion protein (Madisen et al., 2012). Mice studied were heterozygous for one of the Cre alleles and either Ai14 or Ai32 reporter alleles.
Electrophysiology.
For most experiments, a mouse aged between 1 and 6 months was dark adapted for 1 h and, after death, the eye was enucleated and prepared for recording in Ames medium (Sigma-Aldrich) under infrared light using night vision goggles connected to a dissection microscope (Park et al., 2015). In the recording chamber, the retina was perfused (∼4–6 ml/min) with warmed (31–34°C), carbogenated (95% O2-5% CO2) Ames medium (light response and optogenetic experiments). The retina was imaged using a custom-built two-photon fluorescence microscope controlled with ScanImage software (RRID:SCR_014307; Pologruto et al., 2003; Borghuis et al., 2011, 2013). Fluorescent cells were targeted for whole-cell patch-clamp recording with a Coherent Technologies Ultra II laser tuned to 910 nm (Park et al., 2015). For paired-recording experiments, dissection was performed in normal room light and the retina was maintained in artificial CSF as described previously (Jarsky et al., 2011). Cells were visualized using transmitted light and fluorescent Cre-expressing amacrine cells were identified by epifluorescent illumination.
Electrophysiological measurements were made by whole-cell recordings with patch pipettes (tip resistance 4–11 MΩ). Membrane current or potential was amplified, digitized at 10–20 kHz, and stored (MultiClamp 700B amplifier; ITC-18 or Digidata 1440A A-D board) using either pClamp 10.0 (Molecular Devices) or IGOR Pro software (Wavemetrics). For light-evoked responses and optogenetic experiments, pipettes contained the following (in mm): 120 Cs-methanesulfonate, 5 TEA-Cl, 10 HEPES, 10 BAPTA, 3 NaCl, 2 QX-314-Cl, 4 ATP-Mg, 0.4 GTP-Na2, and 10 phosphocreatine-Tris2, pH 7.3, 280 mOsm, for voltage-clamp recording and 120 K-methanesulfonate, 10 HEPES, 0.1 EGTA, 5 NaCl, 4 ATP-Mg, 0.4 GTP-Na2, and 10 phosphocreatine-Tris2, pH 7.3, 280 mOsm, for current-clamp recording. For paired-cell recording experiments, pipettes contained the following (in mm): 90 Cs-methanesulfonate, 20 TEA-Cl, 1 4-AP, 10 HEPES, 1 BAPTA, 4 ATP-Mg, 0.4 GTP- Na2, and 8 phosphocreatine-Tris2.
Either Lucifer yellow (0.1%) or red fluorophores (sulfarhodamine, 10 μm or Alexa Fluor 568, 60 μm) were added to the pipette solution for visualizing the cell. All drugs used for electrophysiology experiments were purchased from Tocris Biosciences, Alomone Laboratories, or Sigma-Aldrich. Excitatory and inhibitory currents were recorded at holding potentials near the estimated reversal for either chloride (ECl, −67 mV) or cations (Ecation, 0 mV) after correcting for the liquid junction potential (−9 mV). Series resistance (∼10–50 MΩ) was compensated by up to 50%. After the recording, an image of the filled cell was acquired using the two-photon microscope.
ON alpha ganglion cells were targeted based on a soma size of ∼20–25 μm diameter (Pang et al., 2003; Murphy and Rieke, 2006; Estevez et al., 2012; Borghuis et al., 2013). Cell identity was confirmed by the characteristic spike response to light stimuli (loose-patch recording, Ames-filled pipette) and by the dendritic morphology imaged after the whole-cell recording (Margolis and Detwiler, 2007; Borghuis et al., 2014). For optogenetic experiments, ON alpha cell identity was additionally confirmed in most cases by measuring a slow melanopsin-mediated excitatory current in response to a blue ChR2-activating stimulus in the presence of synaptic blockers (Ecker et al., 2010; Estevez et al., 2012; Beier et al., 2013).
Light stimuli were presented using a modified video projector (peak output, 397 nm; full-width-at-half-maximum, 20 nm; Borghuis et al., 2013, 2014) focused onto the retina through the microscope condenser. The stimulus wavelength stimulates rod photoreceptors and also approximately equally stimulates cone photoreceptors along the retina's dorsal/ventral gradient (Borghuis et al., 2014), which coexpress varying ratios of middle- and short-wavelength-sensitive opsins (Applebury et al., 2000; Nikonov et al., 2006; Wang et al., 2011; Baden et al., 2013). Therefore, amacrine and ganglion cells were recorded at variable positions in the retina and assumed to have a similar level of cone stimulation. Stimuli were presented within a 4 × 3 mm area on the retina. Stimuli included contrast-reversing spots of variable diameter to measure spatial tuning (Zhang et al., 2012). For most experiments, stimuli were presented with 1 Hz temporal square-wave modulations (100% Michelson contrast) relative to a background of mean luminance that evoked ∼104 photoisomerizations (R*) cone−1 sec−1 (Borghuis et al., 2014). In some cases, the contrast and/or mean luminance was reduced.
Optogenetics.
ChR2-mediated responses were recorded in the presence of drugs to block conventional photoreceptor-mediated light responses. Recordings were made in a mixture containing the following (in μm): L-AP4 (20); either UBP310 (50) or ACET (1–5); DNQX (50–100); and D-AP5 (50–100) (Park et al., 2015). ChR2 was activated by a high-power blue LED (λpeak, 450 or 470 nm; maximum intensity of ∼5 × 10¹⁷ photons s−1 cm−2) focused through the condenser onto a square (220 μm side) or circular (400 μm diameter) area as described previously (Park et al., 2015).
Histology.
For immunohistochemistry, the animal was perfused at age 2–9 weeks, except in two cases in which an older animal was used (28 weeks). The retinas were dissected and fixed with 4% paraformaldehyde for 1 h at 4°C. For whole-mount staining, retinas were incubated with 6% donkey serum and 0.5% Triton X-100 in PBS for 1 h at room temperature and then incubated with 2% donkey serum and 0.5% Triton X-100 in PBS with primary antibodies for 1–4 d at 4°C, and with secondary antibodies for 1–2 h at room temperature. For morphological analysis of recorded cells, the retina was fixed for 1 h at room temperature and reacted as described previously (Manookin et al., 2008).
Primary antibodies were used at the following concentrations: goat anti-ChAT, 1:200 (Millipore AB144P, RRID:AB_2079751); rabbit anti-Lucifer yellow, 1:2000 (Thermo Fisher Scientific A-5750, RRID:AB_2536190), rabbit anti-human/rat CRH serum, 1:40,000 (Code #PBL rC68; gift from Dr. Paul Sawchenko, Salk Institute), and rabbit anti-nNOS, 1:500 (Thermo Fisher Scientific 61–7000, RRID:AB_2533937). Secondary antibodies were conjugated to Alexa Fluor 488, Cy3, and Cy5 (Jackson ImmunoResearch) and diluted at 1:500.
Dendritic tree size and stratification analysis.
Confocal imaging was performed using Zeiss laser scanning confocal microscopes (510, 710, or 800 models). For filled cells, a whole-mount image of the dendritic tree was acquired using a 20× air objective (numerical aperture, NA = 0.8); in some cases, multiple images were combined as a montage. Dendritic tree diameter was determined using ImageJ by measuring the area of a convex polygon that included all dendrites; below, we report the diameter of a circle with an area equivalent to the polygon. A high-resolution z-stack of the ChAT bands (i.e., cholinergic starburst amacrine cell processes labeled by the ChAT antibody) and the filled amacrine or ganglion cell was obtained to determine their relative depth in the inner plexiform layer using a 40× oil objective (NA = 1.4). Analysis of CRH and nNOS antibody labeling was performed either with the 40× oil objective, a 40× air objective (NA = 0.75) or a 63× oil objective (NA = 1.4).
Custom software written in MATLAB (The MathWorks) was used to determine dendrite stratification relative to the ChAT bands. The program and methods used were similar to those described previously (Manookin et al., 2008; Farrow et al., 2013; Sümbül et al., 2014; Park et al., 2015; Beaudoin et al., 2017). The depth of labeled processes is reported relative to the fluorescence peaks of the ChAT bands, in the z dimension, aligned to 0 (peak of inner ChAT band) and 1 (peak of outer ChAT band) in normalized units.
Experimental design and statistical analysis.
Based on conventions in the field and our previous experience, most experiments tested between four and eight cells from at least two animals of either sex. Experiments were performed on specific cell types that could be identified based on genetic labels or well defined anatomical or physiological properties, as described in the Results. Data are reported as mean ± SEM and statistical comparisons were based on two-tailed t tests. We report exact p-values up to the level of p < 10−3.
Results
Cells labeled in the CRH-ires-Cre line express CRH and costratify with ON alpha ganglion cells
We first evaluated the overlap between a Cre-dependent reporter and CRH expression in the CRH-ires-Cre-transgenic mouse retina. The Cre line was crossed with the Cre-dependent ChR2/YFP Ai32 reporter line. At P14, CRH antibody marked regions in both somas (Fig. 1A) and dendritic processes (Fig. 1B) of YFP-expressing (YFP+) cells. In the ganglion cell layer (GCL), 94.2% of YFP+ amacrine cell somas (n = 130/138 cells, two retinas) were labeled by the CRH antibody. The antibody did not overlap the sparse YFP+ ganglion cell bodies (n = 0/7 cells; Fig. 1A), which were identified based on their axons in the nerve fiber layer. Therefore, most Cre+ amacrine cells in the GCL express CRH and are referred to as CRH cells below.
Figure 1.

Amacrine cells in the CRH-ires-Cre mouse line express CRH and costratify with ON alpha ganglion cells. A, Left, CRH-ires-Cre mouse line crossed to a ChR2/YFP reporter line (Ai32) labels mostly amacrine cell bodies (arrows) in the GCL, along with sparse labeling of ganglion cells (arrowhead). Images show average of three confocal sections in a z-stack (1 μm spacing; 40× air lens, NA = 0.75). Center, Antibody labeling for CRH protein. Right, Antibody labeling overlaps with the majority of YFP-expressing amacrine cells. B, Same format as A illustrating overlap between YFP+ dendrites and CRH expression. Images show a single confocal section (40× air lens, NA = 0.75). C, Filled ON alpha ganglion cell (GC). Shown is a collapsed image of multiple confocal sections (20× air lens, NA = 0.8). Dashed box shows area expanded in D. D, Expanded area from C showing an ON alpha ganglion cell dendrite (red) overlaid with CRH amacrine cell dendrites labeled in the CRH-ires-Cre::Ai32 retina (green). Image shows a single confocal section (40× oil lens, NA = 1.4). E, Fluorescence profile of ON alpha dendrites (n = 4 cells) with YFP+ processes in the CRH-ires-Cre::Ai32 retina normalized to the positions of peak fluorescence for the inner and outer ChAT bands (i.e., processes labeled by antibody against ChAT; see Materials and Methods). Fluorescence was normalized to the maximum value in the range of the inner plexiform layer (IPL) (−1.2 to 1.8 in normalized units of the x-axis) before averaging across cells. Error bars indicate ± SEM of normalized fluorescence across cells. The approximate locations of the GCL and inner nuclear layer (INL) are illustrated (gray bars) and align with peaks in the ChAT label (near −2 and +2 normalized units), reflecting the position of ChAT+ cell bodies. A small peak in the CRH-Cre signal around +0.8 reflects the position of OFF alpha ganglion cell dendrites, which are labeled sparsely in this Cre line (Zhu et al., 2014).
The dendrites of CRH cells stratify with ON alpha ganglion cells, as revealed by dye-filling individual ON alpha ganglion cells (n = 4) in the CRH-ires-Cre::Ai32 retina (Fig. 1C). We compared the fluorescence profiles of YFP-labeled CRH cell processes and ON alpha cell dendrites in a confocal z-stack (Fig. 1D). Two bands of cholinergic starburst amacrine cell processes were also labeled, as markers of stratification depth, using an antibody against choline acetyltransferase (ChAT) bands (see Materials and Methods). The dendrites of ON alpha ganglion cells stratified between the inner ChAT band and the GCL and costratified with CRH cell processes (Fig. 1E), leading us to evaluate whether the CRH cells provide synaptic input to ON alpha cells.
CRH cells make GABAergic synapses with ON alpha cells
We first assessed connections between CRH amacrine cells and ON alpha ganglion cells using optogenetics. ChR2-mediated responses were studied in the CRH-ires-Cre::Ai32 retina in the presence of a drug mixture (20 μm L-AP4; 1–5 μm ACET, or 50 μm UBP310; 100 μm DNQX; 100 μm D-AP5) that suppresses photoreceptor-mediated input to retinal circuitry (see Materials and Methods; Park et al., 2015). Blue ChR2-stimulating light evoked IPSCs in ON alpha cells at Vhold = 0 mV (Fig. 2A, top); IPSCs increased in amplitude systematically with increasing light intensity (Fig. 2B, top) and were blocked by the GABAA receptor antagonist SR95531 (gabazine, 50 μm; Fig. 2C). Two other ganglion cell types, ON-OFF direction-selective cells and OFF delta cells, did not respond to ChR2 stimulation, demonstrating the specificity of the ON alpha cell response and the effectiveness of photoreceptor output blockade (Fig. 2A,B).
Figure 2.

CRH amacrine cells make GABAergic synapses with ON alpha ganglion cells. A, Optogenetic experiment showing that CRH cells make synapses with ON alpha cells. A blue light (450 nm peak, 5.3 × 10¹⁷ quanta [Q] s−1 cm−2) was presented to stimulate ChR2 expressed in CRH cells while recording inhibitory current (Vhold = 0 mV) in an ON alpha ganglion cell. Responses were averaged over the time period indicated by the gray bar. The IPSC was blocked by SR95531 (50 μm). There were no responses in a direction-selective ganglion cell (DSGC) or an OFF delta ganglion cell. B, Optogenetically evoked current increased with light intensity for ON alpha cells, but not DSGC (middle row) or OFF delta ganglion cells (bottom row). Error bars indicate ± SEM across cells. C, SR95531 blocked the response in four ON alpha cells. Data from individual cells are shown in both conditions connected by a line. Error bars on the average data points indicate ± SEM across cells. D, Paired-cell recording of a CRH-1 cell and an ON alpha cell. Top trace shows the voltage command in the CRH-1 cell. Middle trace shows the CRH-1 cell current, which includes a transient inward Ca current after depolarization to 0 mV and a sustained outward leak current. Bottom trace shows the IPSC in an ON alpha cell (Vhold = ECl) during and after the depolarizing voltage step. The response was measured over the time period indicated by the gray bar.
To establish further a direct synaptic connection between CRH cells and ON alpha ganglion cells, we performed dual patch-clamp recordings. In 8/14 pairs, depolarizing the CRH cell with a voltage step from −60 mV to +40 mV (Jacoby et al. 2015) elicited an IPSC in the ON alpha cell. In ganglion cells with detectable IPSCs, the peak amplitude was 30.1 ± 5 pA (Fig. 2D). In all connected pairs, the CRH cell had a medium dendritic field (∼300 μm diameter), consistent with the CRH-1 type described earlier (Zhu et al., 2014). These paired recordings confirm direct synaptic transmission between CRH-1 and ON alpha ganglion cells. In six connected pairs, maximal stimulation of ChR2 with blue light evoked compound IPSCs in ON alpha cells of 190 ± 34 pA, or ∼6× larger than the response from depolarizing a single CRH-1 cell, suggesting that ON alpha cells receive inputs from several CRH-1 cells.
CRH cells comprise at least three cell types
To better interpret the optogenetic experiment described above, we identified CRH cell types based on light responses and morphology. In agreement with previous studies, the population included, most commonly, a medium-field (∼300 μm diameter), monostratified cell (CRH-1, Fig. 3A) and a rarer wide-field, axon-bearing cell (>1 mm diameter, CRH-2, Fig. 3B) with a few processes near the soma, which extended to the OFF sublaminae adjacent to the inner nuclear layer (INL; Fig. 3Di,Dii); CRH-2 is therefore bistratified proximal to its soma (Zhu et al., 2014; Jacoby et al., 2015).
Figure 3.

CRH amacrine cells are divided into three cell types. A, Left, CRH-1 cell has a medium-field dendritic tree that typically exhibits an irregular branching pattern. Image shows the collapsed confocal z-stack of a cell filled with Lucifer yellow; this image has been converted to grayscale with inverted contrast. Middle, CRH-1 cell responds to modulations in contrast (spot stimulus, 800 μm diameter) via graded changes in membrane potential, with hyperpolarization to negative contrast (relative to the mean luminance) and depolarization to positive contrast. Right, Average depolarizing and hyperpolarizing responses for a population of cells. Responses were measured in a 50 ms time window near the peak depolarizing or hyperpolarizing response before averaging across cells. Error bars indicate ± SEM across cells. B, Same format as A for CRH-2 cells. Left, Image showing a drawing of the large-field of processes based on confocal images. Some processes extended off the field of view. Middle, CRH-2 cell fires action potentials to positive contrast. Right, Firing rate to positive and negative contrast measured across cells. C, Same format as B for CRH-3 cells. Di, Dii, Confocal image (single sections, 40× oil, NA = 1.4) showing inner (Di) and outer (Dii) processes of the CRH-2 cell in B, which costratify with ON and OFF bipolar cell terminals, respectively. Scale bar applies to both images. E, Confocal image showing processes of the CRH-3 cell in C. F, Dendritic tree versus stratification for CRH-1, CRH-2, and CRH-3 cells and the four ON alpha cells from Figure 1. Stratification was defined by the peak fluorescence, as in Figure 1. CRH-1, CRH-3, and the inner processes of CRH-2 cells stratified at a similar depth in the inner plexiform layer (IPL) between the inner ChAT band and the GCL. CRH-2 outer processes are stratified near the INL. The dendritic tree diameter for CRH-2 and CRH-3 cells was not measured accurately because of incomplete fills in most cases, but all cells were apparently > 1000 μm diameter. G, Small number of YFP+ cells in the CRH-ires-Cre::Ai32 line were colabeled by the nNOS antibody (arrow) and were presumed to be CRH-2 cells (Zhu et al., 2014).
In addition, we identified a third type of cell, CRH-3, as a monostratified axon-bearing cell (Fig. 3C,E). Both CRH-2 and CRH-3 fire action potentials in response to positive contrast, whereas CRH-1 responds with graded membrane potential changes (Fig. 3A–C) (see Jacoby et al., 2015). All three exhibited ON responses that increased with spot size and therefore are tuned to large stimuli (Fig. 3A–C) and all three hyperpolarized or reduced firing during the OFF phase of a contrast-modulated spot, suggesting that their GABAergic output would be reduced during periods of negative contrast (Fig. 3A–C).
Processes from all CRH cells stratified with ON alpha ganglion cell dendrites (Fig. 3F; see also Fig. 1E). In addition, the outer dendrites of bistratified CRH-2 were found between the OFF ChAT band and the INL (Fig. 3F). Because CRH-2 expresses neuronal nitric oxide synthase (nNOS; Zhu et al., 2014), we sought to determine the relative abundance of this cell type by immunohistochemical labeling of YFP+ neurons in the CRH-ires-Cre:Ai32 with a nNOS antibody. We found that CRH-2 is relatively rare: only 6/463 YFP+ cells (or 1.30%; 3 retinas) were nNOS+ (Fig. 3G). nNOS+, reporter-expressing (tdTomato+) cells were slightly more common in the CRH-ires-Cre::Ai14 retina: 32/789 cells (4.06%; 3 retinas; data not shown). Therefore, CRH-2 appears to comprise a small fraction of the total cell population labeled in the CRH-ires-Cre line.
CRH-3 but not CRH-2 provides input to the ON alpha ganglion cell
To assess the contributions of the spiking CRH-2 and CRH-3 to ChR2-evoked IPSCs recorded in the ON alpha ganglion cells, we repeated the optogenetic experiment and tested the effects of blocking voltage-gated Na channels (TTX, 1 μm) on the IPSCs. Blocking voltage-gated Na channels attenuated the IPSC by 140 ± 48 pA or 42 ± 6.5% (t = 2.88, p = 0.034, n = 6; Fig. 4A), suggesting partial dependence on a spiking mechanism. This spiking-dependent mechanism would not include CRH-1 cells because their graded membrane response was not blocked by TTX (n = 3; Fig. 4B), implicating instead CRH-2 and/or CRH-3 cells.
Figure 4.
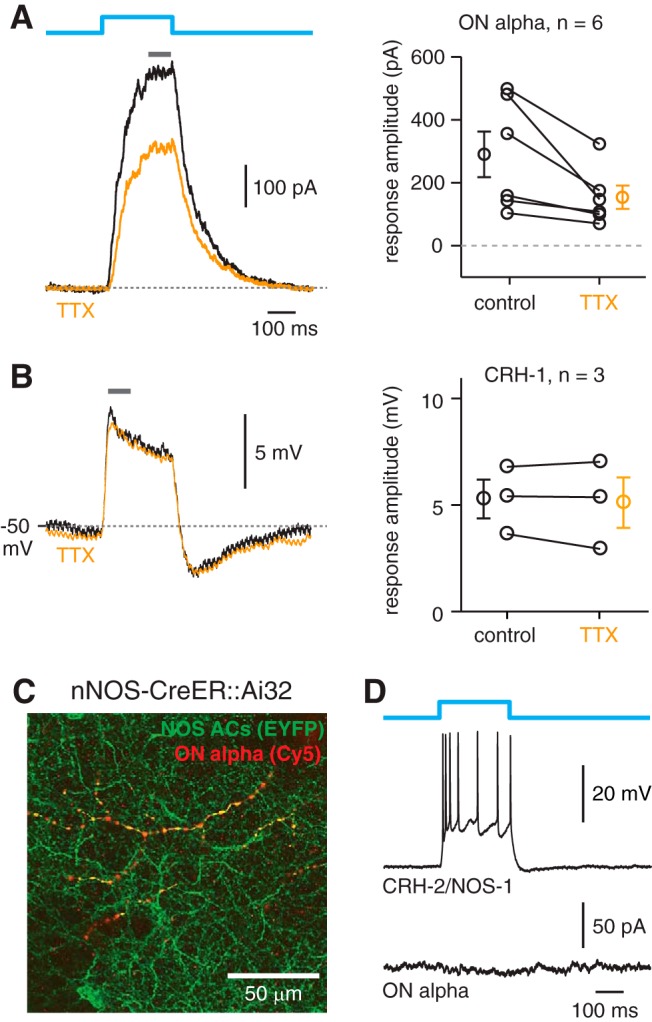
Evidence that ON alpha cells make synapses with CRH-3 but not CRH-2 cells. A, Optogenetically evoked IPSCs in ON alpha cells in the CRH-ires-Cre::Ai32 line are partially sensitive to blocking sodium channels with TTX (1 μm). Responses to blue light stimulation (5.3 × 10¹⁷ Q s−1 cm−2) were averaged over a 50 ms time window near the peak (gray bar). Results from six ON alpha cells are shown at right. Individual cells are shown with lines connecting the control and TTX conditions. Population data show mean ± SEM. B, CRH-1 cell voltage responses, measured over a 50 ms time window (gray bar), were not affected by TTX. Results from three CRH-1 cells are shown at right (same format as A). C, An ON alpha cell dendrite (red) costratifies with YFP+ processes in the nNOS-CreER::Ai32 retina. The ganglion cell was filled with Lucifer yellow (LY) followed by reaction with LY primary antibody and a Cy5 secondary antibody (converted to red); the double labeling of the ganglion cell dendrite reflects colabeling with Lucifer yellow and Cy5 (single confocal section, 40× oil, NA = 1.4). D, Optogenetic stimulation (5.3 × 10¹⁷ Q s−1 cm−2) drove depolarization and spiking in a CRH-2/NOS-1 cell recorded in current-clamp (top trace), but failed to evoke an IPSC in an ON alpha ganglion cell (bottom trace).
Given the scarcity of CRH-2 in the CRH-ires-Cre::Ai32 retina, it would seem that the majority of the TTX-sensitive IPSC reflects transmission from CRH-3. To confirm this, we performed the optogenetic experiment in nNOS-ires-CreER::Ai32 mice. The nNOS-ires-CreER line labels multiple amacrine cell types including nNOS-1, which is a bistratified, axon-bearing amacrine cell apparently identical to CRH-2 (Zhu et al., 2014). YFP-labeled processes in the nNOS-Cre-ER::Ai32 retina costratified with the dendrites of ON alpha cells (Fig. 4C). Stimulation of ChR2 evoked a depolarization and spiking in CRH-2/NOS-1 cells (n = 5), but failed to evoke IPSCs in ON alpha ganglion cells (n = 4; Fig. 4D). Therefore, CRH-2/NOS-1 does not make synapses with ON alpha cells. The collected results from optogenetic experiments indicate that ON alpha ganglion cells receive GABAergic inputs from CRH-1 and CRH-3.
CRH-1 and CRH-3 cells respond over a range of contrast and mean luminance levels
CRH-1 and CRH-3 cells costratify with ON alpha cells (Figs. 1, 3). All three types exhibit sustained responses to positive contrast, suggesting that at least some of the excitatory input to the CRH and ON alpha cells originates with common presynaptic bipolar cells. Therefore, we expected that CRH cells, like ON alpha cells, respond to a wide range of luminance levels and exhibit high contrast sensitivity (Grimes et al., 2014; Ke et al., 2014). We measured responses of CRH-1 and CRH-3 cells to 25–100% contrast modulation of a spot (0.4 to 1 mm diameter) at a mean luminance of either ∼104 R* cone−1 s−1, as above, to stimulate primarily cones, or 102 R* cone−1 s−1, stimulating both rods and cones (Wang et al., 2011). Lower mean levels were avoided because the targeting of CRH cells using pulsed IR-laser stimulation decreases the sensitivity of rods and affects high-sensitivity rod pathways (Borghuis et al., 2013). Responses (peak-to-trough amplitudes) of both CRH-1 and CRH-3 cells increased as a function of contrast, with clear responses at 25% contrast (Fig. 5A–D). Responses of CRH-1 cells were very similar at the two levels of mean luminance, whereas responses of CRH-3 cells showed higher contrast sensitivity at the lower mean luminance (Fig. 5C,D). In CRH-3 cells, mean luminance did not alter the increased firing rate during positive contrast steps (i.e., the ON response), but we did observe a trend toward decreased firing rate during negative contrast (i.e., the OFF response) at high mean luminance (25% contrast: t = −2.2, p = 0.09, n = 5; Fig. 5E). In summary, these results suggest that CRH-1 and CRH-3 cells primarily signal the contrast of the stimulus independently of the mean luminance and contribute to retinal function across a range of stimulus conditions (Troy and Enroth-Cugell, 1993).
Figure 5.

CRH-1 and CRH-3 cells respond over a range of stimulus conditions. A, Responses of a CRH-1 cell to two levels of stimulus contrast presented at two levels of mean luminance. The stimulus was a contrast-modulated spot (0.4 mm diameter), and the responses show an average of two trials. B, Same format as A for a CRH-3 cell (1 mm diameter spot; single trials). C, Average contrast response function for a sample of CRH-1 cells (n = 5). Response were quantified by measuring the peak-to-trough amplitude of voltage modulations, with extreme depolarizing and hyperpolarizing periods averaged over 200 ms time windows. Error bars indicate SEM across cells. D, Same as C for CRH-3 cells (n = 5). Responses were quantified by measuring the modulation of the firing rate and subtracting a minimum rate from a maximum rate averaged over 500 ms time windows. CRH-3 response amplitudes were more sensitive to contrast at the lower mean luminance. E, Same as D showing the firing rate at positive contrast (ON response; open symbols) and negative contrast (OFF response; filled symbols). The rate plotted at 0% contrast (gray-filled symbols) indicates baseline firing at mean luminance.
ON alpha ganglion cells receive tonic inhibition during negative contrast when CRH responses are suppressed
We next wanted to understand whether CRH cells provide the majority of inhibition to the ON alpha ganglion cell. To answer this question, we compared the time course of the light-evoked voltage response of CRH cells with the synaptic conductance of ON alpha cells. We presented contrast-modulated spots (1.0 mm diameter) at 2 temporal frequencies (0.5 and 5 Hz), followed by a switch from the mean luminance to a dark background. The dark background hyperpolarized CRH-1 cells by 9.8 ± 1.5 mV, to −64 ± 3 mV from −55 ± 2 mV at the mean luminance (n = 6) and hyperpolarized CRH-3 cells by 9.4 ± 1.6 mV, to −67.5 ± 3.0 mV from −58.1 ± 1.9 mV at the mean luminance; it also suppressed spiking (n = 4). We refer to the maximum hyperpolarization at the switch to darkness as the dark potential. For the OFF response to negative contrast, we calculated a negative modulation index (NMI) by normalizing the response relative to the resting potential at mean luminance (0) and the dark potential (1.0) as follows:
where ROFF is the OFF response to negative contrast, Vdark is the dark potential, and Vrest is the resting potential at mean luminance. For both CRH-1 and CRH-3 cells, the OFF response was a hyperpolarization close to the dark potential for both 0.5 and 5 Hz temporal modulation (Fig. 6A,B), resulting in NMIs near one (Fig. 6E). Therefore, the CRH membrane potential could be hyperpolarized near the dark potential during the OFF response at both temporal frequencies, although the hyperpolarization was less complete (i.e., NMI < 1) at 5 Hz relative to 0.5 Hz for both CRH-1 and CRH-3 cells (Fig. 6A,B,E).
Figure 6.

ON alpha cells receive feedforward inhibition at both positive and negative contrast. A, CRH-1 cell voltage response to two stimuli followed by a switch to darkness. Stimulus was a contrast-modulated spot (100% contrast, 1000 μm diameter) at 2 temporal frequencies (0.5 or 5 Hz) with a background set to the mean luminance. Inset in the middle column shows an expanded view of the 5 Hz response. Relative to the resting potential (solid horizontal line), the cell hyperpolarized near the dark potential (dashed horizontal line; i.e., membrane potential after the switch from mean luminance to dark background measured over 50 ms) during periods of negative contrast at both temporal frequencies. B, Same format as A for a CRH-3 cell recording. C, Same format as A for excitatory current recorded in an ON alpha cell. The current is suppressed (i.e., moves outward) near the dark current (dashed line) during periods of negative contrast at both temporal frequencies. D, Same format as C for inhibitory current recorded in the same ON alpha cell. During periods of negative contrast, the inhibition persisted and was not fully suppressed to the level near the dark current (dashed line). E, Summary data of NMI across cells showing that CRH-1 and CRH-3 voltage and ON alpha cell excitatory current are suppressed near the dark voltage/current in normalized coordinates (where 1 = dark current/potential; and 0 = resting current/potential). The ON alpha cell inhibitory current NMI was significantly less than the values measured in CRH-1 voltage, CRH-3 voltage, or ON alpha excitatory current at both 0.5 and 5 Hz. For 0.5 Hz stimulation, responses were measured within a 200 ms time window positioned within 500 ms after the transition to negative contrast. For 5 Hz stimulation, responses were measured within 15–20 ms time windows positioned within 100 ms after the transition to negative contrast. Population data show mean ± SEM across cells. F, Voltage-clamp recording of a CRH-1 cell. During negative contrast, the tonic excitatory current was suppressed, whereas the inhibitory current did not increase above baseline. Inhibition instead increased during positive contrast. G, Same format as F for a CRH-3 cell, which showed a similar pattern of synaptic input as the CRH-1 cell.
To determine whether hyperpolarization during the OFF response was mediated by suppressed excitation versus increased inhibition, we performed a voltage-clamp analysis. For both CRH-1 and CRH-3 cells, the OFF response was dominated by a suppression of excitatory current rather than an increased inhibitory current (Fig. 6F,G). Indeed, both CRH cell types received a feedforward inhibitory current at light onset (Fig. 6F,G). Therefore, both CRH cell types apparently receive excitatory input from an ON bipolar cell with a high baseline release rate that is actively suppressed during negative contrast; this resembles the excitatory input to ON alpha cells (Margolis and Detwiler, 2007; Borghuis et al., 2013). Suppression of excitation explains the large hyperpolarizations of both CRH cell types during negative contrast.
Analysis of synaptic input to ON alpha cells showed distinct patterns of the NMI for excitation and inhibition (n = 10; Fig. 6C,D). In these cases, measures of membrane current at the mean luminance and of the initial response to darkness replaced the related measures of membrane potential in the NMI equation above. During the OFF response, the excitatory input to ON alpha cells was strongly suppressed to the level of the dark current (NMI near one), resembling the pattern in CRH-1 and CRH-3 voltage responses (Fig. 6A,B). The same, however, was not true for the inhibitory input to ON alpha cells (Fig. 6D). For inhibition, the OFF response at both temporal frequencies showed an NMI < 0.5 on average and significantly less than the NMIs measured in CRH-1 voltage responses (0.5 Hz: t = 13.0, p < 10−3; 5 Hz: t = 11.0, p < 10−3), CRH-3 voltage responses (0.5 Hz: t = 7.8, p < 10−3; 5 Hz: t = 8.6, p < 10−3), and ON alpha cell excitatory currents (0.5 Hz: t = 10.4, p < 10−3; 5 Hz: t = 15.4, p < 10−3; Fig. 6E). Therefore, inhibition onto ON alpha cells persisted during the OFF response, that is, when CRH-1 and CRH-3 cells were strongly hyperpolarized. In absolute terms, this tonic inhibition during the OFF response was 290 ± 38 pA, approximately the same as the peak current response (i.e., relative to the initial holding current) during positive contrast at either 0.5 Hz (330 ± 40 pA) or 5 Hz (300 ± 40 pA; n = 6). These results show that CRH voltage responses are not sufficient to explain the pattern of inhibition in an ON alpha ganglion cell.
The persistent inhibition of ON alpha cells during negative contrast suggests either that CRH cell synapses show persistent release at negative contrast despite membrane hyperpolarization or that additional convergent circuits inhibit ON alpha cells during negative contrast when CRH cells are hyperpolarized. Both of these mechanisms were tested and are discussed below.
CRH-1 cell synapses show low-pass filtering
Optogenetic experiments were used to elucidate intrinsic properties of CRH cell synapses. We stimulated ChR2 for a 50 s period, alternating steady light with sinusoidal modulation of intensity at 0.5 or 5 Hz (in alternating order separated by 10 s of constant illumination; Fig. 7A) and recorded IPSCs in the ON alpha cell. Both temporal frequencies are within the physiological range of conventional light responses (Fig. 6). The switch to steady light evoked a tonic current in ON alpha cells that attenuated slowly over 50 s (Fig. 7A). Modulation at both frequencies was reflected in the IPSCs, primarily at the input frequency (Fig. 7A). The modulation, however, was notably weaker at 5 Hz, at which release was not suppressed to baseline during the negative phase of ChR2 stimulation (Fig. 7A). We quantified this by calculating an NMI comparable to the measures above for light-evoked suppression of membrane potential or synaptic input during the OFF response. There was a significant difference in NMI between the two temporal frequencies: the postsynaptic GABA current was suppressed almost completely at 0.5 Hz (NMI = 0.94 ± 0.04, n = 5), whereas the reduction was less than half as large at 5 Hz (NMI = 0.35 ± 0.06; difference of 0.60 ± 0.09, t = 6.91, p = 0.0023, n = 5; Fig. 7A,F). The experiment was repeated after blocking sodium channels with TTX to suppress CRH-3 firing. The pattern in the NMI was similar to the control condition (n = 4; Fig. 7B1) and did not depend on the presentation order of the two temporal frequencies (Fig. 7B2,F). These results suggest that the inability to completely suppress ON alpha IPSCs at 5 Hz reflects the behavior of CRH-1 cell synapses.
Figure 7.

CRH cell GABA release onto ON alpha cells does not fully modulate at a high temporal frequency. A, Optogenetically evoked inhibition in an ON alpha cell (Vhold = 0 mV) evoked by blue light stimulation in the CRH-ires-Cre::Ai32 retina. In this control (con) condition, drugs were applied to block glutamate signaling and thereby suppress photoreceptor-mediated responses (see Results). The light switched from darkness to a mean level followed by sinusoidal modulation at either 5 or 0.5 Hz. Inset for trace at left shows the modulation at 5 Hz. During the negative phase at 5 Hz, the IPSC in the ON alpha cell persisted (arrowhead, dotted line) and did not modulate to the baseline level measured before stimulus onset (dashed line). Mean light intensity = 2.4 × 10¹⁷ Q s−1 cm−2. Sinusoidal modulation varied from darkness to twice the mean. B1, Same format as A for a second cell recorded with TTX (1 μm) applied to block voltage-gated Na channels and thereby suppressing spikes in presynaptic CRH-3 cells. B2, Same format as B1 but with the order of the two frequencies reversed. C, Same format as A but for a voltage recording of a CRH-3 cell. D, Same format as C but for a voltage recording of a CRH-1 cell. E, Same format as D but for an excitatory current recording of a CRH-1 cell. F, NMI calculated as in Figure 6E, where 1 = baseline current before stimulus onset and 0 = average current measured over 1 s before the sinusoidal stimulus. The 0.5 and 5 Hz temporal frequencies (fstim) were presented in two orders (blue points: 5 Hz followed by 0.5 Hz; red points: 0.5 Hz followed by 5 Hz; data from the same cell are connected by a line), which had no obvious effect on the results. Black points and error bars indicate mean ± SEM across cells (combined across both stimulus orders). For the ON alpha cell IPSC, the index is near 1 for the 0.5 Hz modulation, indicating that the synapse could completely suppress release, whereas the index was significantly lower at 5 Hz modulation. The low NMI of ON alpha IPSCs at 5 Hz persisted with TTX application, implicating a low-pass filtering of CRH-1 synapses; this was only partially explained at the level of CRH-1 voltage responses.
To test this idea further, we recorded from CRH cells directly. In CRH-3 cells, complete modulation of presynaptic membrane potential was observed at both 0.5 and 5 Hz stimulus frequencies and the NMI was close to 1 in both cases (n = 5; Fig. 7C,F). In CRH-1 cells, however, membrane potential modulation was incomplete, with an NMI significantly <1 at 5 Hz (NMI = 0.73 ± 0.05; t = 5.51, p = 0.0015, n = 7; Fig. 7D,F). To test whether the reduced NMI in the CRH-1 membrane potential could be explained at the level of ChR2 channels, we performed voltage-clamp experiments. CRH-1 membrane currents also showed a NMI significantly <1 at 5 Hz (NMI = 0.88 ± 0.02; t = 5.27, p = 0.0019, n = 7; Fig. 7E,F), but the NMI in membrane current was significantly greater than the NMI in membrane potential (t = 2.68, p = 0.020).
These experiments show that GABA release from CRH-1 cell synapses is not suppressed fully by brief periods of membrane hyperpolarization. This is explained partly by an intrinsic membrane property, the membrane potential is not fully modulated at 5 Hz (Fig. 7D,F), and it is further explained by a property of the synapses, IPSCs are modulated more weakly than the membrane potential (t = 4.95, p < 10−3; Fig. 7F). Therefore, CRH-1 synapses are tuned to encode contrast modulation at low temporal frequencies. This feature of CRH-1 synapses partially explains why ON alpha ganglion cells experience persistent inhibition during negative contrast at a high temporal frequency (5 Hz), but it cannot explain the same feature of ON alpha ganglion cells at a lower temporal frequency (0.5 Hz; Fig. 6).
CRH cells converge with OFF-pathway amacrine cells to inhibit ON alpha cells
Light-evoked and optogenetic stimulation of CRH cell synapses suggests that they are tuned to low temporal frequencies and can be suppressed completely during negative contrast at 0.5 Hz (Figs. 6, 7). However, at 0.5 Hz, ON alpha cells continue to receive tonic inhibition from presynaptic amacrine cells (Fig. 6C,D). To better understand the mechanism for tonic inhibition in the ON alpha cell circuit, we tested the possibility that ON alpha cells receive so-called crossover inhibition from the OFF pathway. Indeed, ON alpha cells apparently receive inhibitory input from an OFF-pathway amacrine cell during negative contrast under dim lighting conditions (van Wyk et al., 2009).
In the presence of L-AP4, which blocks ON bipolar cell responses and isolates OFF-pathway synaptic inputs (Slaughter and Miller, 1981), the ON inhibitory response in ON alpha cells was blocked whereas an OFF inhibitory response to negative contrast persisted (Fig. 8). This OFF-pathway inhibition presumably was present under control conditions and explains why inhibition would persist at negative contrast when the ON pathway is suppressed. With the ON pathway blocked, the OFF-pathway inhibition at negative contrast is enhanced relative to the control condition (Fig. 8A,B). A simple model that explains the enhanced OFF-pathway inhibition in L-AP4 is presented in Figure 8D.
Figure 8.

OFF-pathway inhibition converges with ON-pathway inhibition onto ON alpha cells. A, Voltage-clamp measurements of excitation and inhibition in an ON alpha cell under control conditions and after applying L-AP4 (20 μm), followed by L-AP4 + SR95531 (SR, 50 μm), followed by L-AP4 + SR + strychnine (STRY, 1 μm). Traces are shown on the same current scale (y-axis). A horizontal line shows the level where current is apparently most suppressed across conditions (see final drug condition). B, Same format as A except SR and STRY were added in the reverse order. In both A and B, the inhibitory response converts from ON-dominated to OFF-dominated in the presence of L-AP4. The OFF-pathway inhibition persists in either SR (A) or STRY (B), but is blocked in the presence of both drugs. In both A and B, a small OFF-dominant modulation of excitation is present in the final drug condition (inset). C, Summary showing inhibition measured in the ON and OFF phase in all drug conditions and for both drug orders. ON-pathway inhibition was blocked by L-AP4 and remained blocked when additional drugs were added. OFF-pathway inhibition emerged in L-AP4 and persisted when either SR or STRY was added alone; the combination of all drugs blocked OFF-pathway inhibition. Responses were measured within a 50–100 ms time window relative to the holding current before stimulus onset. D, Model for pharmacology effects showing ON and OFF bipolar cells (BCs) and amacrine cells (ACs) and the recorded ganglion cell (GC) with presumed connectivity. Excitatory synapses are black; inhibitory synapses are green. L-AP4 blocks all ON-pathway synapses by hyperpolarizing ON BCs, which apparently relieves inhibition of OFF-pathway cells and thereby increase inhibition of the ON alpha GC during negative contrast relative to the control condition.
After blocking the ON pathway, the OFF-pathway inhibition was sensitive to blockers of both GABAA (SR95531, 50 μm; Fig. 8A) and glycine (strychnine, 1 μm; Fig. 8B) receptors, indicating that both GABAergic and glycinergic amacrine cells, driven by OFF bipolar cells, converge onto ON alpha ganglion cells. L-AP4 combined with the two inhibitory blockers revealed in some ON alpha cells a small excitatory current at light offset (Fig. 8A,B), but this phenomenon was not studied further.
Relative to L-AP4 alone, the peak inhibitory current was unchanged or slightly increased by either SR95531 (157 ± 19%) or strychnine (111 ± 29%) alone, whereas a combination of the two blocked inhibition entirely (Fig. 8C). This pattern reflects inhibitory interactions between amacrine cells that give rise to nonlinear effects of pharmacological agents. Nevertheless, the GABAA- and glycine receptor-mediated IPSCs in ON alpha cells recorded in the presence of L-AP4 demonstrates that at least two OFF-pathway amacrine cells converge, along with CRH cells and possibly other ON-pathway amacrine cells, on ON alpha ganglion cells.
Discussion
Here, we describe amacrine cells identified by Cre expression driven by the CRH promoter in the mouse retina. These cells indeed express CRH protein (Fig. 1) and comprise three morphological and functional types (CRH-1, CRH-2, and CRH-3), two of which (CRH-1 and CRH-3) provide input to the ON alpha ganglion cell (Figs. 3, 4) and respond over a range of stimulus conditions (Fig. 5). CRH-1, the synapses of which are tuned to encode low temporal frequencies, and CRH-3 are components of a circuit that converges with OFF-pathway GABAergic and glycinergic amacrine cells to provide tonic inhibition to the ON alpha cell in the presence of background light (Figs. 7, 8). The tonic inhibition helps to maintain the ON alpha cell's spike response in the presence of the high release rate of presynaptic ON bipolar cells (Fig. 6).
CRH cells diverge to two ganglion cell circuits with opposite responses to positive contrast
CRH-1 makes synapses with both ON alpha cells (Fig. 2) and SbC ganglion cells (Jacoby et al., 2015). In both cases, CRH-1 inhibits the postsynaptic ganglion cell during an increase in positive contrast (Fig. 9). In addition, the synaptic output of CRH-1 is combined at the ganglion cell level with OFF pathway-mediated GABAergic and glycinergic input (Jacoby et al., 2015; Lee et al., 2016; Tien et al., 2016; Fig. 8). However, despite having similar presynaptic inputs, ON alpha and SbC ganglion cells exhibit opposite responses to positive contrast: positive contrast excites ON alpha cells (Murphy and Rieke, 2006; Krieger et al., 2017) while inhibiting SbC cells; SbC cells also are inhibited by negative contrast (Jacoby et al., 2015; Lee et al., 2016; Tien et al., 2016).
Figure 9.
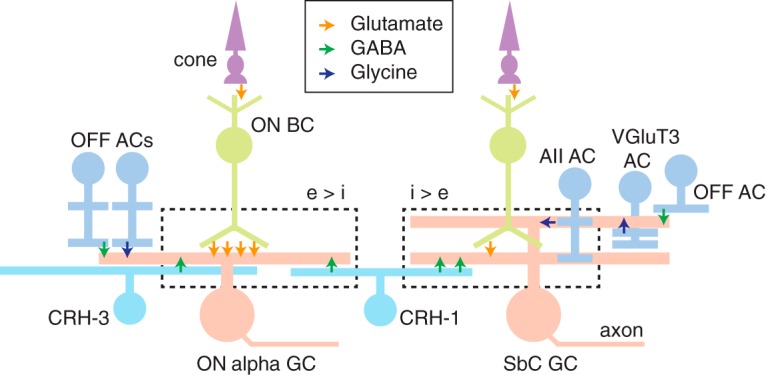
Circuit diagrams for ON alpha and SbC ganglion cells. ON alpha and SbC ganglion cells show opposite responses to positive contrast, which is apparently explained by differing ratios of excitation (e) and inhibition (i). Synaptic inputs during positive contrast (ON response) are shown within the dashed rectangle. Both ganglion cell types receive excitatory input from ON bipolar cells (BCs), including type 6 BCs, and ON-pathway inhibitory input from CRH-1 amacrine cells (ACs); both types receive additional ON-pathway inhibitory input from either the AII AC (SbC) or the CRH-3 cell (ON alpha). Both ganglion cell types also receive converging input from OFF-pathway ACs: either unknown AC types (ON alpha, SbC) or the VGluT3 AC (SbC cell). The SbC cell also receives excitatory synapses from OFF BCs (data not shown). The opposite responses to positive contrast by the ON alpha and SbC ganglion cells are apparently explained by the different balances of excitation and inhibition in the two circuits despite their common categories of synaptic input: ON alpha cells have relatively higher excitation (e > i), whereas SbC cells show the opposite ratio (i > e).
The ON alpha and SbC cells' opposite responses to positive contrast are explained by differences in the balance between excitation and inhibition in the two circuits. In relative terms, ON alpha cells receive a larger excitatory input (Fig. 6; Bleckert et al., 2014), whereas SbC cells receive a larger inhibitory input (Jacoby et al., 2015; Lee et al., 2016; Tien et al., 2016). Therefore, a single retinal interneuron, CRH-1, diverges to two output circuits with opposite responses to the same visual stimulus. There likely are additional amacrine cells that play similar roles in other ganglion cell circuits that share some input but diverge in output properties. This underlies the importance of understanding the strength of synaptic connections when interpreting anatomical connectomic data.
Synaptic and circuit mechanisms for tonic inhibition of ON alpha cells
Compared with other ganglion cell types, the ON alpha cell has a high tonic firing rate: ∼20–50 spikes/s in bright background light (Passaglia et al., 2001; Zaghloul et al., 2003; Sagdullaev and McCall, 2005; Chang et al., 2013; Grimes et al., 2014; Ke et al., 2014; Schmidt et al., 2014; Krieger et al., 2017). A high firing rate ensures that the ganglion cell responds strongly around contrast threshold, including by reducing its firing rate in response to negative contrast (Chichilnisky and Kalmar, 2002; Zaghloul et al., 2003).
An ON alpha cell's excitatory input is dominated by the type 6 bipolar cell, which appears to have a high level of tonic glutamate release at mean luminance (Murphy and Rieke, 2006, 2008; Beaudoin et al., 2007; Schwartz et al., 2012; Borghuis et al., 2013; Grimes et al., 2014; Ke et al., 2014). Interestingly, other ON bipolar cell types can substitute for type 6 bipolar cells that have been ablated (Tien et al., 2017). The high rate of release onto ON alpha cells depolarizes their membrane potential by ∼10 mV relative to the reversal of leak channels and supports tonic firing at mean luminance (Margolis and Detwiler, 2007). The signal-to-noise ratio (SNR) of synaptic input, assuming Poisson statistics of release (Ashmore and Copenhagen, 1983; Freed, 2000; Freed and Liang, 2010), would be proportional to the square root of the release rate; therefore, the high baseline rate, although expensive metabolically, would improve the SNR (Sterling and Laughlin, 2015). Substantial tonic excitation, however, raises the risk that additional depolarizing input will push the cell into saturation, causing inactivation of Na channels and an inability to spike. Therefore, it is necessary to balance excitation with feedforward inhibition onto the ganglion cell (Bleckert et al., 2014; Zhao et al., 2014). Although tonic excitation of ON alpha cells increases with background luminance (Pang et al., 2003, 2015; Murphy and Rieke, 2006), tonic inhibition also becomes stronger with the background, enabling inhibition to balance excitation across a wide operating range. Indeed, feedforward inhibition is a common circuit motif, although it is commonly associated with more transient synapses that depend on the relative timing of bursts of excitation and inhibition (Pouille and Scanziani, 2001; Wehr and Zador, 2003; Wilent and Contreras, 2005).
The ON alpha cell seems to integrate excitatory and feedforward inhibitory synapses with high tonic rates of release. We found that inhibition to ON alpha cells was elevated despite ongoing changes in positive or negative contrast (Fig. 6). Tonic inhibitory current near Ecation was typically ∼300 pA (∼4 nS). Assuming an intrinsic ECl of −80 mV (Murphy and Rieke, 2006) and a natural Vrest of −60 to −55 mV, the resting inhibitory current would be ∼75 to 100 pA. Assuming an ∼60 MΩ input resistance, tonic inhibition could generate an ∼4–6 mV membrane hyperpolarization at rest.
Tonic inhibition depended partly on the convergence of ON- and OFF-pathway amacrine cells (Figs. 6, 8), both GABAergic and glycinergic (Fig. 8). Presynaptic glycinergic cells could include the bistratified A8 amacrine cell, which may make synaptic contacts with ON alpha cells (Lee et al., 2015). The presence of crossover inhibition in mouse ON alpha cells differs from the lack of such inhibition in guinea pig ON alpha cells (Zaghloul et al., 2003). The OFF-pathway inhibition of mouse ON alpha cells in bright light, shown here, resembles a similar mechanism recorded under dimmer light conditions (van Wyk et al., 2009). OFF-pathway inhibition primarily acts during a period of negative contrast when ON bipolar release is suppressed (Fig. 8). At the switch to positive contrast, ON bipolar release can be fast and transient, especially after a prolonged period of negative contrast (Jackman et al., 2009; Ke et al., 2014; Vlasits et al., 2014). At a subsequent transition to positive contrast, inhibition from the OFF pathway would balance the fast, transient ON-pathway excitation until the feedforward ON-pathway inhibition can begin to take effect.
Possible mechanisms for crossover excitation in the ON alpha cell
We observed OFF-pathway excitation onto ON alpha cells in the presence of a drug mixture that blocked the ON pathway (L-AP4) and both GABAergic and glycinergic inhibition (SR95531 plus strychnine; Fig. 8). Although we did not pursue the underlying mechanism, we speculate that OFF bipolar cells could excite the AII amacrine cell, which in turn would provide indirect excitation to the ON alpha cell via electrical coupling to ON bipolar cell terminals (Demb and Singer, 2012). This putative circuit might explain similarly unexpected OFF-pathway-mediated excitation in ON ganglion cells under other experimental conditions (Roska and Werblin, 2001; Ala-Laurila et al., 2011; Farajian et al., 2011; Crook et al., 2014).
Footnotes
This work was supported by the National Institutes of Health (Grants EY014454, EY021372, EY017836, and EY026878), a National Science Foundation Graduate Fellowship (J.P.), a Gruber Foundation Science Fellowship (J.P.), the Whitehall Foundation, and by an unrestricted grant from Research to Prevent Blindness to the Department of Ophthalmology and Visual Science at Yale University.
The authors declare no competing financial interests.
References
- Akrouh A, Kerschensteiner D (2015) Morphology and function of three VIP-expressing amacrine cell types in the mouse retina. J Neurophysiol 114:2431–2438. 10.1152/jn.00526.2015 [DOI] [PMC free article] [PubMed] [Google Scholar]
- Ala-Laurila P, Greschner M, Chichilnisky EJ, Rieke F (2011) Cone photoreceptor contributions to noise and correlations in the retinal output. Nat Neurosci 14:1309–1316. 10.1038/nn.2927 [DOI] [PMC free article] [PubMed] [Google Scholar]
- Applebury ML, Antoch MP, Baxter LC, Chun LL, Falk JD, Farhangfar F, Kage K, Krzystolik MG, Lyass LA, Robbins JT (2000) The murine cone photoreceptor: a single cone type expresses both S and M opsins with retinal spatial patterning. Neuron 27:513–523. 10.1016/S0896-6273(00)00062-3 [DOI] [PubMed] [Google Scholar]
- Ashmore JF, Copenhagen DR (1983) An analysis of transmission from cones to hyperpolarizing bipolar cells in the retina of the turtle. J Physiol 340:569–597. 10.1113/jphysiol.1983.sp014781 [DOI] [PMC free article] [PubMed] [Google Scholar]
- Baden T, Schubert T, Chang L, Wei T, Zaichuk M, Wissinger B, Euler T (2013) A tale of two retinal domains: near-optimal sampling of achromatic contrasts in natural scenes through asymmetric photoreceptor distribution. Neuron 80:1206–1217. 10.1016/j.neuron.2013.09.030 [DOI] [PubMed] [Google Scholar]
- Baden T, Berens P, Franke K, Román Rosón M, Bethge M, Euler T (2016) The functional diversity of retinal ganglion cells in the mouse. Nature 529:345–350. 10.1038/nature16468 [DOI] [PMC free article] [PubMed] [Google Scholar]
- Bagnoli P, Dal Monte M, Casini G (2003) Expression of neuropeptides and their receptors in the developing retina of mammals. Histol Histopathol 18:1219–1242. 10.14670/HH-18.1219 [DOI] [PubMed] [Google Scholar]
- Beaudoin DL, Borghuis BG, Demb JB (2007) Cellular basis for contrast gain control over the receptive field center of mammalian retinal ganglion cells. J Neurosci 27:2636–2645. 10.1523/JNEUROSCI.4610-06.2007 [DOI] [PMC free article] [PubMed] [Google Scholar]
- Beaudoin DL, Kupershtok M, Demb JB (2017) Selective synaptic connections in the retinal pathway for night vision. J Comp Neurol. In press. 10.1002/cne.24313 [DOI] [PMC free article] [PubMed] [Google Scholar]
- Beier KT, Borghuis BG, El-Danaf RN, Huberman AD, Demb JB, Cepko CL (2013) Transsynaptic tracing with vesicular stomatitis virus reveals novel retinal circuitry. J Neurosci 33:35–51. 10.1523/JNEUROSCI.0245-12.2013 [DOI] [PMC free article] [PubMed] [Google Scholar]
- Bleckert A, Schwartz GW, Turner MH, Rieke F, Wong RO (2014) Visual space is represented by nonmatching topographies of distinct mouse retinal ganglion cell types. Curr Biol 24:310–315. 10.1016/j.cub.2013.12.020 [DOI] [PMC free article] [PubMed] [Google Scholar]
- Borghuis BG, Tian L, Xu Y, Nikonov SS, Vardi N, Zemelman BV, Looger LL (2011) Imaging light responses of targeted neuron populations in the rodent retina. J Neurosci 31:2855–2867. 10.1523/JNEUROSCI.6064-10.2011 [DOI] [PMC free article] [PubMed] [Google Scholar]
- Borghuis BG, Marvin JS, Looger LL, Demb JB (2013) Two-photon imaging of nonlinear glutamate release dynamics at bipolar cell synapses in the mouse retina. J Neurosci 33:10972–10985. 10.1523/JNEUROSCI.1241-13.2013 [DOI] [PMC free article] [PubMed] [Google Scholar]
- Borghuis BG, Looger LL, Tomita S, Demb JB (2014) Kainate receptors mediate signaling in both transient and sustained OFF bipolar cell pathways in mouse retina. J Neurosci 34:6128–6139. 10.1523/JNEUROSCI.4941-13.2014 [DOI] [PMC free article] [PubMed] [Google Scholar]
- Chang L, Breuninger T, Euler T (2013) Chromatic coding from cone-type unselective circuits in the mouse retina. Neuron 77:559–571. 10.1016/j.neuron.2012.12.012 [DOI] [PubMed] [Google Scholar]
- Chichilnisky EJ, Kalmar RS (2002) Functional asymmetries in ON and OFF ganglion cells of primate retina. J Neurosci 22:2737–2747. [DOI] [PMC free article] [PubMed] [Google Scholar]
- Crook JD, Packer OS, Dacey DM (2014) A synaptic signature for ON- and OFF-center parasol ganglion cells of the primate retina. Vis Neurosci 31:57–84. 10.1017/S0952523813000461 [DOI] [PMC free article] [PubMed] [Google Scholar]
- Demb JB, Singer JH (2012) Intrinsic properties and functional circuitry of the AII amacrine cell. Vis Neurosci 29:51–60. 10.1017/S0952523811000368 [DOI] [PMC free article] [PubMed] [Google Scholar]
- Demb JB, Singer JH (2015) Functional circuitry of the retina. Annu Rev Vis Sci 1:263–289. 10.1146/annurev-vision-082114-035334 [DOI] [PMC free article] [PubMed] [Google Scholar]
- Diamond JS. (2017) Inhibitory interneurons in the retina: types, circuitry, and function. Annu Rev Vis Sci 3:1–24. 10.1146/annurev-vision-102016-061345 [DOI] [PubMed] [Google Scholar]
- Ecker JL, Dumitrescu ON, Wong KY, Alam NM, Chen SK, LeGates T, Renna JM, Prusky GT, Berson DM, Hattar S (2010) Melanopsin-expressing retinal ganglion-cell photoreceptors: cellular diversity and role in pattern vision. Neuron 67:49–60. 10.1016/j.neuron.2010.05.023 [DOI] [PMC free article] [PubMed] [Google Scholar]
- Estevez ME, Fogerson PM, Ilardi MC, Borghuis BG, Chan E, Weng S, Auferkorte ON, Demb JB, Berson DM (2012) Form and function of the M4 cell, an intrinsically photosensitive retinal ganglion cell type contributing to geniculocortical vision. J Neurosci 32:13608–13620. 10.1523/JNEUROSCI.1422-12.2012 [DOI] [PMC free article] [PubMed] [Google Scholar]
- Euler T, Haverkamp S, Schubert T, Baden T (2014) Retinal bipolar cells: elementary building blocks of vision. Nat Rev Neurosci 15:507–519. 10.1038/nrn3783 [DOI] [PubMed] [Google Scholar]
- Farajian R, Pan F, Akopian A, Völgyi B, Bloomfield SA (2011) Masked excitatory crosstalk between the ON and OFF visual pathways in the mammalian retina. J Physiol 589:4473–4489. 10.1113/jphysiol.2011.213371 [DOI] [PMC free article] [PubMed] [Google Scholar]
- Farrow K, Teixeira M, Szikra T, Viney TJ, Balint K, Yonehara K, Roska B (2013) Ambient illumination toggles a neuronal circuit switch in the retina and visual perception at cone threshold. Neuron 78:325–338. 10.1016/j.neuron.2013.02.014 [DOI] [PubMed] [Google Scholar]
- Franke K, Berens P, Schubert T, Bethge M, Euler T, Baden T (2017) Inhibition decorrelates visual feature representations in the inner retina. Nature 542:439–444. 10.1038/nature21394 [DOI] [PMC free article] [PubMed] [Google Scholar]
- Freed MA. (2000) Parallel cone bipolar pathways to a ganglion cell use different rates and amplitudes of quantal excitation. J Neurosci 20:3956–3963. [DOI] [PMC free article] [PubMed] [Google Scholar]
- Freed MA, Liang Z (2010) Reliability and frequency response of excitatory signals transmitted to different types of retinal ganglion cell. J Neurophysiol 103:1508–1517. 10.1152/jn.00871.2009 [DOI] [PMC free article] [PubMed] [Google Scholar]
- Grimes WN, Zhang J, Graydon CW, Kachar B, Diamond JS (2010) Retinal parallel processors: more than 100 independent microcircuits operate within a single interneuron. Neuron 65:873–885. 10.1016/j.neuron.2010.02.028 [DOI] [PMC free article] [PubMed] [Google Scholar]
- Grimes WN, Schwartz GW, Rieke F (2014) The synaptic and circuit mechanisms underlying a change in spatial encoding in the retina. Neuron 82:460–473. 10.1016/j.neuron.2014.02.037 [DOI] [PMC free article] [PubMed] [Google Scholar]
- Helmstaedter M, Briggman KL, Turaga SC, Jain V, Seung HS, Denk W (2013) Connectomic reconstruction of the inner plexiform layer in the mouse retina. Nature 500:168–174. 10.1038/nature12346 [DOI] [PubMed] [Google Scholar]
- Hirasawa H, Contini M, Raviola E (2015) Extrasynaptic release of GABA and dopamine by retinal dopaminergic neurons. Philos Trans R Soc Lond B Biol Sci 370: pii: 20140186. 10.1098/rstb.2014.0186 [DOI] [PMC free article] [PubMed] [Google Scholar]
- Jackman SL, Choi SY, Thoreson WB, Rabl K, Bartoletti TM, Kramer RH (2009) Role of the synaptic ribbon in transmitting the cone light response. Nat Neurosci 12:303–310. 10.1038/nn.2267 [DOI] [PMC free article] [PubMed] [Google Scholar]
- Jacoby J, Zhu Y, DeVries SH, Schwartz GW (2015) An amacrine cell circuit for signaling steady illumination in the retina. Cell Rep 13:2663–2670. 10.1016/j.celrep.2015.11.062 [DOI] [PMC free article] [PubMed] [Google Scholar]
- Jarsky T, Cembrowski M, Logan SM, Kath WL, Riecke H, Demb JB, Singer JH (2011) A synaptic mechanism for retinal adaptation to luminance and contrast. J Neurosci 31:11003–11015. 10.1523/JNEUROSCI.2631-11.2011 [DOI] [PMC free article] [PubMed] [Google Scholar]
- Ke JB, Wang YV, Borghuis BG, Cembrowski MS, Riecke H, Kath WL, Demb JB, Singer JH (2014) Adaptation to background light enables contrast coding at rod bipolar cell synapses. Neuron 81:388–401. 10.1016/j.neuron.2013.10.054 [DOI] [PMC free article] [PubMed] [Google Scholar]
- Krieger B, Qiao M, Rousso DL, Sanes JR, Meister M (2017) Four alpha ganglion cell types in mouse retina: Function, structure, and molecular signatures. PLoS One 12:e0180091. 10.1371/journal.pone.0180091 [DOI] [PMC free article] [PubMed] [Google Scholar]
- Krishnaswamy A, Yamagata M, Duan X, Hong YK, Sanes JR (2015) Sidekick 2 directs formation of a retinal circuit that detects differential motion. Nature 524:466–470. 10.1038/nature14682 [DOI] [PMC free article] [PubMed] [Google Scholar]
- Lee SC, Meyer A, Schubert T, Hüser L, Dedek K, Haverkamp S (2015) Morphology and connectivity of the small bistratified A8 amacrine cell in the mouse retina. J Comp Neurol 523:1529–1547. 10.1002/cne.23752 [DOI] [PMC free article] [PubMed] [Google Scholar]
- Lee SC, Weltzien F, Madigan MC, Martin PR, Grünert U (2016) Identification of A amacrine, displaced amacrine, and bistratified ganglion cell types in human retina with antibodies against calretinin. J Comp Neurol 524:39–53. 10.1002/cne.23821 [DOI] [PubMed] [Google Scholar]
- Lee S, Chen L, Chen M, Ye M, Seal RP, Zhou ZJ (2014) An unconventional glutamatergic circuit in the retina formed by vGluT3 amacrine cells. Neuron 84:708–715. 10.1016/j.neuron.2014.10.021 [DOI] [PMC free article] [PubMed] [Google Scholar]
- MacNeil MA, Masland RH (1998) Extreme diversity among amacrine cells: implications for function. Neuron 20:971–982. 10.1016/S0896-6273(00)80478-X [DOI] [PubMed] [Google Scholar]
- Madisen L, Zwingman TA, Sunkin SM, Oh SW, Zariwala HA, Gu H, Ng LL, Palmiter RD, Hawrylycz MJ, Jones AR, Lein ES, Zeng H (2010) A robust and high-throughput Cre reporting and characterization system for the whole mouse brain. Nat Neurosci 13:133–140. 10.1038/nn.2467 [DOI] [PMC free article] [PubMed] [Google Scholar]
- Madisen L, Mao T, Koch H, Zhuo JM, Berenyi A, Fujisawa S, Hsu YW, Garcia AJ 3rd, Gu X, Zanella S, Kidney J, Gu H, Mao Y, Hooks BM, Boyden ES, Buzsáki G, Ramirez JM, Jones AR, Svoboda K, Han X, Turner EE, Zeng H (2012) A toolbox of Cre-dependent optogenetic transgenic mice for light-induced activation and silencing. Nat Neurosci 15:793–802. 10.1038/nn.3078 [DOI] [PMC free article] [PubMed] [Google Scholar]
- Manookin MB, Beaudoin DL, Ernst ZR, Flagel LJ, Demb JB (2008) Disinhibition combines with excitation to extend the operating range of the OFF visual pathway in daylight. J Neurosci 28:4136–4150. 10.1523/JNEUROSCI.4274-07.2008 [DOI] [PMC free article] [PubMed] [Google Scholar]
- Margolis DJ, Detwiler PB (2007) Different mechanisms generate maintained activity in ON and OFF retinal ganglion cells. J Neurosci 27:5994–6005. 10.1523/JNEUROSCI.0130-07.2007 [DOI] [PMC free article] [PubMed] [Google Scholar]
- Murphy GJ, Rieke F (2006) Network variability limits stimulus-evoked spike timing precision in retinal ganglion cells. Neuron 52:511–524. 10.1016/j.neuron.2006.09.014 [DOI] [PMC free article] [PubMed] [Google Scholar]
- Murphy GJ, Rieke F (2008) Signals and noise in an inhibitory interneuron diverge to control activity in nearby retinal ganglion cells. Nat Neurosci 11:318–326. 10.1038/nn2045 [DOI] [PMC free article] [PubMed] [Google Scholar]
- Nikonov SS, Kholodenko R, Lem J, Pugh EN Jr (2006) Physiological features of the S- and M-cone photoreceptors of wild-type mice from single-cell recordings. J Gen Physiol 127:359–374. 10.1085/jgp.200609490 [DOI] [PMC free article] [PubMed] [Google Scholar]
- Pang JJ, Gao F, Wu SM (2003) Light-evoked excitatory and inhibitory synaptic inputs to ON and OFF alpha ganglion cells in the mouse retina. J Neurosci 23:6063–6073. [DOI] [PMC free article] [PubMed] [Google Scholar]
- Pang JJ, Frankfort BJ, Gross RL, Wu SM (2015) Elevated intraocular pressure decreases response sensitivity of inner retinal neurons in experimental glaucoma mice. Proc Natl Acad Sci U S A 112:2593–2598. 10.1073/pnas.1419921112 [DOI] [PMC free article] [PubMed] [Google Scholar]
- Park SJ, Borghuis BG, Rahmani P, Zeng Q, Kim IJ, Demb JB (2015) Function and circuitry of VIP+ interneurons in the mouse retina. J Neurosci 35:10685–10700. 10.1523/JNEUROSCI.0222-15.2015 [DOI] [PMC free article] [PubMed] [Google Scholar]
- Passaglia CL, Enroth-Cugell C, Troy JB (2001) Effects of remote stimulation on the mean firing rate of cat retinal ganglion cells. J Neurosci 21:5794–5803. [DOI] [PMC free article] [PubMed] [Google Scholar]
- Pologruto TA, Sabatini BL, Svoboda K (2003) ScanImage: flexible software for operating laser scanning microscopes. Biomed Eng Online 2:13. 10.1186/1475-925X-2-13 [DOI] [PMC free article] [PubMed] [Google Scholar]
- Pouille F, Scanziani M (2001) Enforcement of temporal fidelity in pyramidal cells by somatic feed-forward inhibition. Science 293:1159–1163. 10.1126/science.1060342 [DOI] [PubMed] [Google Scholar]
- Roska B, Werblin F (2001) Vertical interactions across ten parallel, stacked representations in the mammalian retina. Nature 410:583–587. 10.1038/35069068 [DOI] [PubMed] [Google Scholar]
- Sagdullaev BT, McCall MA (2005) Stimulus size and intensity alter fundamental receptive-field properties of mouse retinal ganglion cells in vivo. Vis Neurosci 22:649–659. 10.1017/S0952523805225142 [DOI] [PubMed] [Google Scholar]
- Sanes JR, Masland RH (2015) The types of retinal ganglion cells: current status and implications for neuronal classification. Annu Rev Neurosci 38:221–246. 10.1146/annurev-neuro-071714-034120 [DOI] [PubMed] [Google Scholar]
- Schmidt TM, Alam NM, Chen S, Kofuji P, Li W, Prusky GT, Hattar S (2014) A role for melanopsin in alpha retinal ganglion cells and contrast detection. Neuron 82:781–788. 10.1016/j.neuron.2014.03.022 [DOI] [PMC free article] [PubMed] [Google Scholar]
- Schwartz GW, Okawa H, Dunn FA, Morgan JL, Kerschensteiner D, Wong RO, Rieke F (2012) The spatial structure of a nonlinear receptive field. Nat Neurosci 15:1572–1580. 10.1038/nn.3225 [DOI] [PMC free article] [PubMed] [Google Scholar]
- Shekhar K, Lapan SW, Whitney IE, Tran NM, Macosko EZ, Kowalczyk M, Adiconis X, Levin JZ, Nemesh J, Goldman M, McCarroll SA, Cepko CL, Regev A, Sanes JR (2016) Comprehensive classification of retinal bipolar neurons by single-cell transcriptomics. Cell 166:1308–1323.e30. 10.1016/j.cell.2016.07.054 [DOI] [PMC free article] [PubMed] [Google Scholar]
- Sivyer B, Vaney DI (2010) Dendritic morphology and tracer-coupling pattern of physiologically identified transient uniformity detector ganglion cells in rabbit retina. Vis Neurosci 27:159–170. 10.1017/S0952523810000234 [DOI] [PubMed] [Google Scholar]
- Slaughter MM, Miller RF (1981) 2-amino-4-phosphonobutyric acid: A new pharmacological tool for retina research. Science 211:182–185. 10.1126/science.6255566 [DOI] [PubMed] [Google Scholar]
- Sterling P, Laughlin SB (2015) Principles of neural design. Cambridge, MA: MIT. [Google Scholar]
- Sümbül U, Song S, McCulloch K, Becker M, Lin B, Sanes JR, Masland RH, Seung HS (2014) A genetic and computational approach to structurally classify neuronal types. Nat Commun 5:3512. 10.1038/ncomms4512 [DOI] [PMC free article] [PubMed] [Google Scholar]
- Taniguchi H, He M, Wu P, Kim S, Paik R, Sugino K, Kvitsani D, Fu Y, Lu J, Lin Y, Miyoshi G, Shima Y, Fishell G, Nelson SB, Huang ZJ (2011) A resource of cre driver lines for genetic targeting of GABAergic neurons in cerebral cortex. Neuron 71:995–1013. 10.1016/j.neuron.2011.07.026 [DOI] [PMC free article] [PubMed] [Google Scholar]
- Tien NW, Pearson JT, Heller CR, Demas J, Kerschensteiner D (2015) Genetically identified suppressed-by-contrast retinal ganglion cells reliably signal self-generated visual stimuli. J Neurosci 35:10815–10820. 10.1523/JNEUROSCI.1521-15.2015 [DOI] [PMC free article] [PubMed] [Google Scholar]
- Tien NW, Kim T, Kerschensteiner D (2016) Target-specific glycinergic transmission from VGluT3-expressing amacrine cells shapes suppressive contrast responses in the retina. Cell Rep 15:1369–1375. 10.1016/j.celrep.2016.04.025 [DOI] [PMC free article] [PubMed] [Google Scholar]
- Tien NW, Soto F, Kerschensteiner D (2017) Homeostatic plasticity shapes cell-type-specific wiring in the retina. Neuron 94:656–665.e4. 10.1016/j.neuron.2017.04.016 [DOI] [PMC free article] [PubMed] [Google Scholar]
- Troy JB, Enroth-Cugell C (1993) X and Y ganglion cells inform the cat's brain about contrast in the retinal image. Exp Brain Res 93:383–390. [DOI] [PubMed] [Google Scholar]
- van Wyk M, Wässle H, Taylor WR (2009) Receptive field properties of ON- and OFF-ganglion cells in the mouse retina. Vis Neurosci 26:297–308. 10.1017/S0952523809990137 [DOI] [PMC free article] [PubMed] [Google Scholar]
- Vaney DI, Sivyer B, Taylor WR (2012) Direction selectivity in the retina: symmetry and asymmetry in structure and function. Nat Rev Neurosci 13:194–208. 10.1038/nrn3165 [DOI] [PubMed] [Google Scholar]
- Vlasits AL, Bos R, Morrie RD, Fortuny C, Flannery JG, Feller MB, Rivlin-Etzion M (2014) Visual stimulation switches the polariy of excitatory input to starburst amacrine cells. Neuron 83:1172–1184. 10.1016/j.neuron.2014.07.037 [DOI] [PMC free article] [PubMed] [Google Scholar]
- Wang YV, Weick M, Demb JB (2011) Spectral and temporal sensitivity of cone-mediated responses in mouse retinal ganglion cells. J Neurosci 31:7670–7681. 10.1523/JNEUROSCI.0629-11.2011 [DOI] [PMC free article] [PubMed] [Google Scholar]
- Wässle H, Puller C, Müller F, Haverkamp S (2009) Cone contacts, mosaics, and territories of bipolar cells in the mouse retina. J Neurosci 29:106–117. 10.1523/JNEUROSCI.4442-08.2009 [DOI] [PMC free article] [PubMed] [Google Scholar]
- Wehr M, Zador AM (2003) Balanced inhibition underlies tuning and sharpens spike timing in auditory cortex. Nature 426:442–446. 10.1038/nature02116 [DOI] [PubMed] [Google Scholar]
- Wilent WB, Contreras D (2005) Dynamics of excitation and inhibition underlying stimulus selectivity in rat somatosensory cortex. Nat Neurosci 8:1364–1370. 10.1038/nn1545 [DOI] [PubMed] [Google Scholar]
- Zaghloul KA, Boahen K, Demb JB (2003) Different circuits for ON and OFF retinal ganglion cells cause different contrast sensitivities. J Neurosci 23:2645–2654. [DOI] [PMC free article] [PubMed] [Google Scholar]
- Zhang C, McCall MA (2012) Receptor targets of amacrine cells. Vis Neurosci 29:11–29. 10.1017/S0952523812000028 [DOI] [PMC free article] [PubMed] [Google Scholar]
- Zhang Y, Kim IJ, Sanes JR, Meister M (2012) The most numerous ganglion cell type of the mouse retina is a selective feature detector. Proc Natl Acad Sci U S A 109:E2391–E2398. 10.1073/pnas.1211547109 [DOI] [PMC free article] [PubMed] [Google Scholar]
- Zhao X, Stafford BK, Godin AL, King WM, Wong KY (2014) Photoresponse diversity among the five types of intrinsically photosensitive retinal ganglion cells. J Physiol 592:1619–1636. 10.1113/jphysiol.2013.262782 [DOI] [PMC free article] [PubMed] [Google Scholar]
- Zhu Y, Xu J, Hauswirth WW, DeVries SH (2014) Genetically targeted binary labeling of retinal neurons. J Neurosci 34:7845–7861. 10.1523/JNEUROSCI.2960-13.2014 [DOI] [PMC free article] [PubMed] [Google Scholar]