Abstract
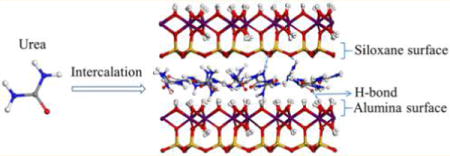
Intercalation of urea in kaolinite was investigated using infrared spectroscopy and molecular dynamics simulation. Infrared spectroscopic results indicated the formation of hydrogen bonds between urea and siloxane/alumina surfaces of kaolinite. The carbonyl group (–C=O) of urea acted as H-acceptors for the hydroxyl groups on alumina surfaces. The amine group (–NH2) of urea functioned as H-donors interacting with basal oxygens on siloxane surfaces and/or the oxygens of hydroxyl groups on alumina surfaces. The H-bonds of urea formed with kaolinite surfaces calculated directly from molecular dynamics simulation was consistent with the infrared spectroscopic results. Additionally, MD simulations further provided insight into the interaction energies of urea with the kaolinite interlayer environment. The calculated interaction energies of urea molecules with kaolinite alumina and siloxane surfaces suggest that the intercalation of urea within kaolinite interlayers is energetically favorable. The interaction energy of urea with alumina surfaces was greater than that with siloxane surfaces, indicating that the alumina surface plays a primary role in the intercalation of kaolinite by urea. The siloxane surfaces function as H-acceptors to facilitate the intercalation of urea. The present study offers a direct view of the specific driving force involved in urea intercalation in kaolinite. The results obtained can help develop appropriate protocol to intercalate and delaminate clay layers for clay-based applications and products.
Graphical abstract
INTRODUCTION
Clay minerals are naturally occurring nanomaterials which have been used in a wide variety of application including industrial manufacturing and environmental protection.1,2 The intercalation of clay refers to the insertion of molecules or ions between aluminosilicate structural layers of clays, is an important process in many clay-based applications and products. The modification of clay interlayers via intercalation has been used in catalytic processes, preparation of highly efficient sorbents, synthesis of electroactive materials, and production of polymer/clay-based nanocomposites.3–5 Among the layered clays, smectite clays have been extensively used, owing to the easy accessibility of their interlayers, large surface areas, and structural negative charges derived from isomorphic substitution.2 Kaolinite is a 1:1 layered alumina/silicate with the structural formula of A14Si4O10(OH)8. The unit layer of kaolinite consists of one octahedral alumina sheet and one tetrahedral silica sheet that share a common plane of oxygens. The repeating layers are held together by hydrogen bonds formed between basal oxygen atoms of the siloxane sheet and the opposing surface hydroxyls of the alumina sheet. In general, kaolinite layer is nearly electrically neutral due to the lack of isomorphic substitution in the structural lattice. The interlayer hydrogen bonds holding the adjacent layers of kaolinite result in its difficult intercalation. However, this clay mineral has two kinds of interlayer surfaces, namely, alumina octahedral surface covered by hydroxyl groups and siloxane surface covered by basal oxygens. Both surfaces can function as H-acceptors in forming H-bonds driving the intercalation of molecules.6 In addition, the alumina surfaces of kaolinite could be covalently grafted with compounds to form hybrid materials with high chemical and thermal stability.7,8 During the past 2 decades, the intercalation and subsequent delamination of kaolinite layers has been exploited to prepare high-valued kaolinite products for specific industrial applications such as coatings on papers, and fillings in functional hybrid materials.9,10
Delamination is a crucial process to peel the clay stacks with the purpose to increase its surface areas and high aspect ratio in preparation of clay-based hybrid materials. The kaolinite platelets formed via delamination manifest a marked increase in specific surface area compared to naturally occurring kaolinite.11,12 Additionally, the delaminated kaolinite platelets demonstrate improved optical and physical properties required for many industrial applications.9,11,13 Mechanical grinding has traditionally been the most common technique used in delaminating kaolinite. More recently, delamination of kaolinite by mechanical grinding has been facilitated by the prior intercalation of small molecules such as urea, potassium acetate, and hydrazine.11,13,14 Such intercalation weakens the connective forces between the adjacent layers thereby promoting the delamination of kaolinite stacks. Urea is one of the most commonly used intercalating reagents because of its functional groups viz. –C=O and –NH2 that can serve as H-acceptor and donor in the formation of H-bonds. This allows urea to be readily intercalated in kaolinite since it can form hydrogen bonds with both the alumina and siloxane surfaces.
The formation of kaolinite–urea intercalate has been experimentally investigated using infrared and Raman spectroscopy, and X-ray diffraction with the hope to clarify the mechanism associated with the intercalation process.15–18 However, the underlying molecular mechanism responsible for the intercalation of urea are not fully understood yet. Molecular dynamics simulation is an effective tool for characterizing interactions between chemicals and mineral surfaces.19–23 Such simulations can reproduce experimental results, and provide a direct atomic-level view of the interactions involved in the intercalation, which cannot be obtained from empirical evidence or spectroscopic analysis. In previous computational studies, the molecular dynamics simulations were only used to gain insight into the conformation of small molecules in kaolinite interlayers,24–26 and adsorption energies of intercalated chemicals on kaolinite surfaces were calculated using quantum methods in relatively simple model systems.27,28 In order to better elucidate the underlying mechanisms and forces involved in the intercalation of kaolinite with urea, we constructed more sophisticated models that more accurately represent the experimental conditions and kaolinite interlayer environment.
In this study, the models was constructed on the basis of X-ray diffraction (XRD) and thermal analyses of urea-intercalated kaolinite. The interactions between urea and kaolinite alumina/siloxane surfaces were examined using the complementary methods of infrared spectroscopy and molecular dynamics simulations. The formation of hydrogen bonds and interaction energies between urea and kaolinite surfaces were estimated to elucidate the underlying molecular mechanism and forces involved in the intercalation of kaolinite by urea.
MATERIALS AND METHODS
Clay and Chemicals
The kaolinite used in this study was mined from Zhangjiakou, Hebei Province, China. This kaolinite is well-ordered with a Hinckley index of ~1.31. The chemical composition of this clay was detailed in our previous studies.29,30 The kaolinite was purified with the siphon method.31 The raw clay was mixed with deionized water at the mass ratio of 1:4 followed by adding 1% sodium hexametaphosphate as dispersant. The pH of the suspension was adjusted to 10.0 using sodium hydroxide solution. Then the suspension was stirred for 2 h and subsequently settled for 1 h. The kaolinite suspended in the upper suspension was separated from quartz impurity that settled to the bottom. The upper suspension was siphoned out and oven-dried to collect the kaolinite. Urea (purity ≥99%) and methanol (purity ≥99.5%) were obtained from Sinopharm Chemical Reagent Co., Ltd., and used as received.
Preparation of Urea-Intercalated Kaolinite
Urea-intercalated kaolinite was prepared by adding kaolinite (10 g) to aqueous solution saturated with urea (100 g of urea in 100 mL of deionized water). The suspension was stirred using a magnetic stirrer at 60 °C for 48 h, and the clay suspensions were centrifuged at 3500 rpm for 5 min. The collected kaolinite–urea intercalates was washed three times with methanol to remove the urea adsorbed on clay external surfaces, and was dried in electric thermostatic drying oven at 60 °C for 3 h.
Experimental Analysis
The basal spacing of kaolinite and urea-intercalated kaolinite was determined using a Rigaku D/max 2500PC X-ray diffractometer with Cu Kα radiation (40 kV, 100 mA). The diffraction patterns were recorded between 2.5 and 18° at a scanning rate of 2° per min. The FTIR spectra were collected using a Thermofisher Nicolet 6700 spectrometer equipped with ATR accessory. Specifically, the clay samples were placed on the germanium crystal plate and scanned from 4000 to 600 cm−1. The thermogravimetric analysis was carried out using a Mettler-Toledo TG–DSC I/1600 HT simultaneous thermal analyzer with nitrogen flow rate of 100 mL/min. The sample (15 mg) was placed in alumina crucibles and heated from 30 to 1100 °C at the rate of 10 °C/min.
Molecular Dynamics Simulations
Molecular dynamics simulations were performed to explore molecular-scale understanding on the interactions between kaolinite surfaces and intercalated urea. Periodic model of the neutral kaolinite unit cell with the composition of A14Si4O10(OH)8 was created as the basic unit cell. The supercell was constructed with 8 × 5 × 1 unit cell model containing eight unit cells in x-direction (41.20 Å) and five unit cells in y-direction (44.67 Å). In order to evaluate the interaction energies of urea with two types of kaolinite surfaces, kaolinite supercell was cleaved along (001) and plane to create alumina surface and siloxane surface, respectively. The urea slab was stacked on these two surfaces constructing alumina surface–urea and siloxane surface–urea models which are defined as TO and models, in which T and to kaolinite alumina and siloxane surfaces, and O refers to the urea slab. In order to investigate the hydrogen bonds formed between urea and two opposing kaolinite surfaces and the urea arrangement in the kaolinite interlayer, the interlayer space was constructed by adding one kaolinite layer above the TO model with introducing the siloxane surface. This model is defined as . The starting configuration of , TO, and models are given in Figure S1, parts a–c, respectively (Supporting Information).
Three types of force field are commonly used for molecular dynamics simulations of clays, which are clay force field,32 ClayFF33 and INTERFACE force field.34 These force fields have been successfully used in computing clay–organic interactions.35–39 In this study, the CVFF-INTERFACE force field was used to describe the kaolinite framework, and OPLS-AA force field was used to describe the behaviors of urea.40,41 The compatibility of CVFF-INTERFACE and OPLS-AA force field combination has been validated to simulate complex systems of mineral surface and organic compounds.34,42 The energy functions of the selected force fields and the corresponding parameters are provided in Supporting Information. The molecular dynamics package LAMMPS (Sandia National Laboratory) was used to investigate kaolinite–urea interactions using the NPT ensemble at T = 333 K and P = 0.1 MPa. The constant temperature and pressure were controlled using the Nose–Hoover thermostat and barostat. Energy minimization was achieved by using the conjugate gradient technique for 5000 steps prior to performing NPT simulations. The equilibrium run was performed for 1 ns, followed by 1 ns of production run. The molecular dynamics time step was 1 fs, and the trajectory frame at production stage was recorded every 2000 steps. Periodic boundary condition was applied to the system in all three dimensions. The Ewald summation method was used to calculate long-range electrostatic interactions. Both Coulombic and Lennard-Jones interactions were treated with a cutoff of 10 Å.
After the production run, the atomic density of urea between kaolinite layers, radial distribution function (RDF) and H-bonds between urea molecules and kaolinite surfaces were calculated based on the model. For the TO and models, the mean square displacement (MSD) of urea molecules and interaction energies of urea with kaolinite surfaces were calculated to compare the affinity of urea to the two types of surfaces. The formation of H-bonds was determined with a distance cutoff of 3.2 Å for H⋯Y, and angle cutoff of >90° for X–H···Y angle in which X and Y represent O or N.43,44 The interaction energy was calculated as the difference between the energies of kaolinite surface–urea complex and the sum of the energies of isolated kaolinite surfaces and urea molecules, which were averaged of the collected production trajectories:
| (1) |
Here Etotal is the energy for kaolinite alumina/siloxane surfaces–urea, Esurface is the energy for isolated kaolinite surfaces, and Eurea is the energy for isolated urea molecules. Because the 3-D periodic boundary condition was applied to the simulations, a vacuum slab with 40 Å in thickness was added above each frame of TO and models from the production run prior to the calculation of interaction energy.
In kaolinite interlayer model , the atomic density of urea was quantified as its histogram along the direction perpendicular to kaolinite basal surface eq 2.
| (2) |
where z is the coordinate of atoms along with the z direction, n is the counts of atom Xi, and δ is the interval of bin array.
Radial distribution function provides an estimate of density of atom A surrounded by another atom B at a given distance. The RDF peak represents the large occurrence frequency of atom B surrounding the atom A, which was calculated using eq 345
| (3) |
where ρB is the number density of atom B, and dnAB is the average number of atom B within the distance range of r to r + dr from atom A.
Mean square displacement is the average square of the displacement of urea molecules on kaolinite surfaces, which represents displacement of the urea atoms from its original position.45
| (4) |
Here ri(t) and ri(0) refer to the position at time t and origin of ith particle, respectively, and the angular bracket denotes an ensemble average over all molecules.
RESULTS AND DISCUSSION
X-ray Diffraction
XRD patterns of kaolinite and its urea-intercalated complexes are shown in Figure 1. The basal spacing of kaolinite was measured at 7.2 Å, and the intercalation of urea molecules resulted in the increase of basal spacing to 10.8 Å. The increase in basal spacing indicates the intercalation of urea between kaolinite layers. The thickness of a kaolinite layer unit is approximately 5.4 Å; correspondingly, the interlayer distance of the urea-intercalated kaolinite is estimated at ~5.4 Å. The maximum geometric length of urea is ~4.5 Å; the interlayer space should be sufficient to accommodate one layer of urea molecules. The intercalated urea molecules could arrange as a monolayer between the kaolinite layers where the urea molecules can simultaneously interact with both siloxane and alumina surfaces of kaolinite. The intercalation ratio of kaolinite–urea complexes (Iratio) was estimated using eq 5:11
| (5) |
where I10.8Å and I7.2Å are the intensity of 10.8 and 7.2 Å reflection peaks of urea-intercalated kaolinite (Figure 1b). The calculated intercalation ratio was 93% suggesting that the urea-intercalated kaolinite occupied 93% of the prepared samples.
Figure 1.
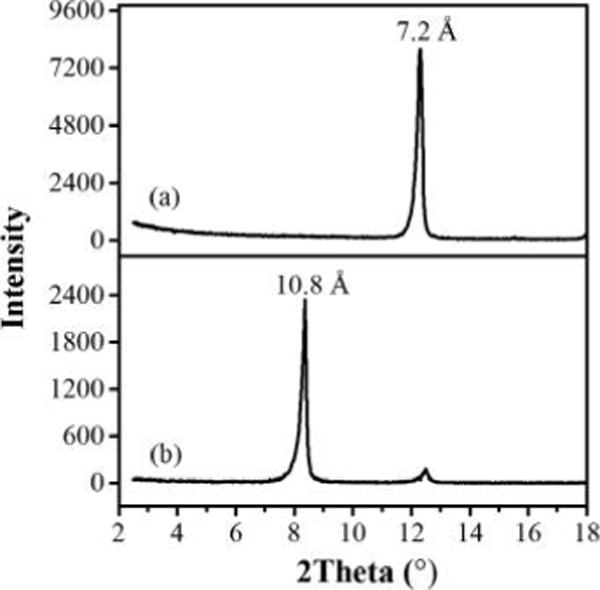
XRD patterns of (a) kaolinite and (b) urea-intercalated kaolinite with basal spacing values.
Thermal Analysis
The thermal analysis of urea-intercalated kaolinite is shown in Figure 2. From room temperature to 115 °C, ~1% of mass loss was observed due primarily to the removal of weakly adsorbed water from clay. From 115 to 360 °C, approximately 14% of mass was lost at two steps, which was attributed to the thermal decomposition of the intercalated urea. During the first step of mass loss between 115 and 190 °C, biuret from the thermal decomposition of urea was produced within the kaolinite interlayers.46,47 More significant mass loss occurred as temperature increased from 190 to 360 °C. At higher temperatures, urea was continually decomposed and produced biuret, cyanuric acid, ammelide, ammeline and melamine which could be lost via sublimation or decomposition. After the urea molecules were completely decomposed, another mass loss (11.8%) was observed, which arisen from dehydroxylation of kaolinite. The weight loss associated with dehydroxylation of intercalated kaolinite is reasonably consistent with the measurement of original kaolinite (~13%).29,48 Overall, the calculated intercalation ratio indicates that urea-intercalated kaolinite occupies ~93% of the prepared samples, and 14% of mass loss is attributed to the thermal decomposition of the intercalated urea (Figure 2). Therefore, the mass percentage of intercalated urea relative to kaolinite–urea intercalation complexes is calculated to be ~15% (14% ÷ 93%). The mass ratio agrees reasonably well with the reported values (16.7%) in the literature,49 and thus is used for the construction of kaolinite–urea model in the following molecular dynamics simulations. The intercalated urea content might be overestimated due to the possible incomplete removal of urea molecules adsorbed on the clay external surfaces.
Figure 2.
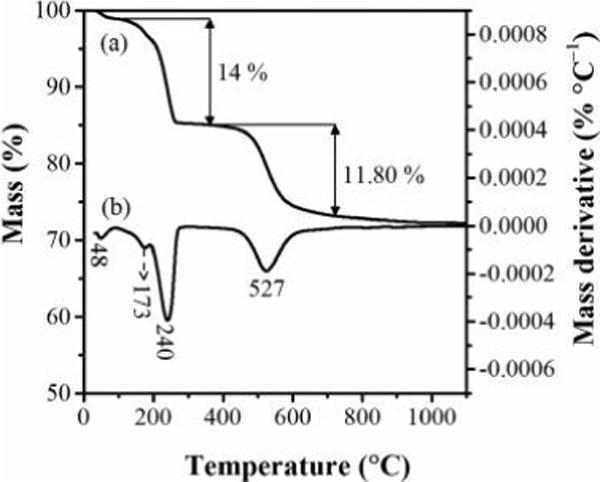
Thermal analysis of urea-intercalated kaolinite with curve a as thermogravimetric analysis (left scale of y-axis), and curve b as derivative thermogravimetric analysis (right scale of y-axis).
Infrared Spectroscopy
FTIR spectra of urea-intercalated kaolinite and original kaolinite are shown in Figure 3. The bands of 3695, 3668, and 3650 cm−1 of the original kaolinite are assigned to the stretching vibration of surface –OH groups on alumina surface exposed to interlayer.50 The 3620 cm−1 band is assigned to the stretching vibration of inner –OH located within kaolinite framework. The surface –OH is actively involved in formation of H-bonds as H-donors and/or acceptors, while the inner –OH rarely interacts with the intercalated chemicals due to its recessed location within the kaolinite structure. The decreased intensity of 3695 cm−1 band upon urea intercalation suggests the surface hydroxyl groups can interact with urea molecules (Figure 3b). Within the low-frequency regions, the two bands at 1031 and 1008 cm−1 are attributed to the Si–O stretching vibrations. The two bands at 938 and 912 cm−1 are assigned to Al–O–H deformation vibrations.
Figure 3.
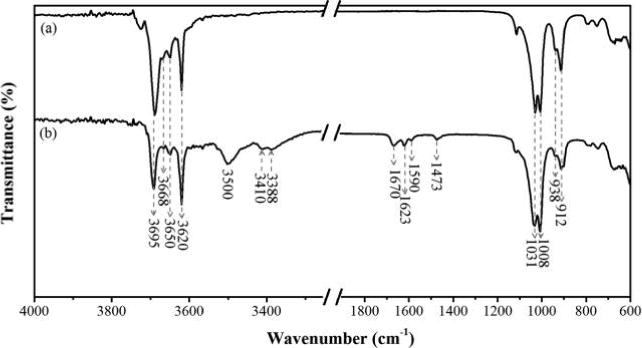
Infrared spectra of (a) kaolinite and (b) urea-intercalated kaolinite.
The FTIR spectrum of urea-intercalated kaolinite is shown in Figure 3b. Within the high-frequency regions, the broad band at 3500 cm−1 and two weak bands at 3410 and 3388 cm−1 are the N–H stretching vibrations of urea.51,52 Previous studies showed that the N–H antisymmetric and symmetric stretching vibrations of urea in aqueous solution exhibited broad bands at 3488 and 3379 cm−1.52 When urea was intercalated in kaolinite as a monolayer, the interactions between urea and kaolinite surfaces could strengthen the N–H stretching vibrations as evidenced by band shifting to 3500 cm−1. The relatively broad band at 3500 cm−1 suggests that the –NH2 group of urea molecules can function as H-donors forming H-bonds with oxygens on kaolinite alumina/siloxane surfaces, as confirmed by the analysis of molecular dynamics simulations (see below).
Within the middle-frequency region, the bands at 1670 and 1623 cm−1 are attributed to –NH2 symmetric and antisymmetric deformation vibrations. The symmetric deformation vibration was blue-shifted to 1670 cm−1 compared to that in aqueous solution (1668 cm−1).52 The antisymmetric deformation vibration was red-shifted to 1623 cm−1 compared to the band 1629 cm−1 in aqueous solution. These shifts indicate the interactions of –NH2 groups of urea with kaolinite surfaces. The other two bands at 1590 and 1473 cm−1 are assigned to C=O stretching vibration and C–N antisymmetric stretching vibration, respectively. Compared with urea present in aqueous solution, the C=O stretching vibration of urea in kaolinite interlayers was red-shifted from 1597 to 1590 cm−1, and C–N stretching vibration was blue-shifted from 1463 to 1473 cm−1. The decrease in the wavenumber of C=O stretching vibration and increase in the wavenumber of C–N stretching vibration suggest that the –C=O group of urea could interact with –OH on the alumina surface via H-bonds. This interaction could strengthen the C–N stretching vibration, as evidenced by the increase of wavenumber.
MOLECULAR DYNAMICS SIMULATIONS
On the basis of the mass percentage of intercalated urea to kaolinite–urea intercalates calculated from the thermal analysis, 60 urea molecules was introduced to construct the kaolinite–urea complex models (TO, , and ) using the aforementioned method. For the interlayer structure model , the basal spacing was set at 16 Å in the beginning with urea molecules randomly distributed in the interlayer. As the system reached equilibrium, the basal spacing shrunk to ~11.23 Å, which is a little larger than the basal spacing of 10.8 Å measured by XRD (Figure 1). This might be caused by the overestimated intercalated urea molecules by thermal analysis due to the adsorbed urea molecules on the external clay surface. Thus, the kaolinite–urea models with less mass percentage of urea were also constructed to perform further MD simulations. The calculated basal spacing at various urea molecule contents are given in Figure S2 (Supporting Information). The results show the expected trend that the basal spacing of kaolinite–urea intercalates increased with the increase of urea molecule loading. The basal spacing reaches a stable region at 11 Å in the range of 40–50 urea content agreeing well with the experimental value of 10.8 Å. In present study the kaolinite–urea model with 45 urea content was selected for further MD simulations and subsequent analysis. The theoretical intercalated urea mass ratio (11.6%) is 3.4% less than that calculated based on the thermal analysis (15%). Similarly, Rutkai et al.26 also found that the theoretically calculated intercalated urea mass ratio is a few percentage less than that derived from thermal analysis, largely due to the overestimate of the intercalated urea mass in the experiment. In the simulated interlayer environments of model, nearly all oxygen atoms of urea faced to the –OH of alumina surface, as shown with one oxygen atom peak between middle plane of the interlayer and hydrogen peak of alumina surface (Figure 4, right panel). The carbon atom of urea manifested one peak residing between the peak of urea oxygen atom and middle plane of the interlayer. This indicates that –C=O groups of urea molecules locate toward the alumina surface at an angle with respect to the surface to facilitate the interactions with –OH on alumina surface. As for H and N atoms in urea, they were distributed in the whole interlayers and formed two weak peaks near either kaolinite alumina or siloxane surface, suggesting that –NH2 groups of urea could interact with both kaolinite surfaces.
Figure 4.
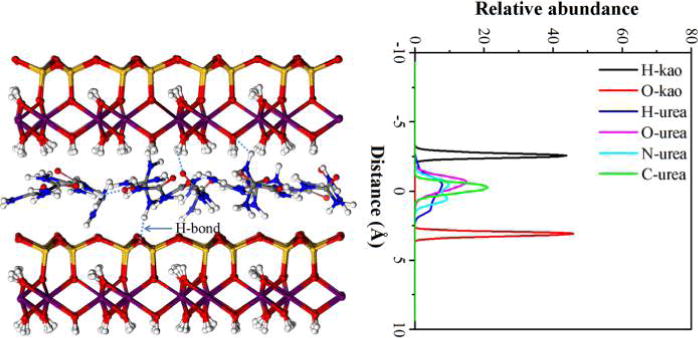
Snapshot of kaolinite–urea complex model after the system reached equilibrium (left panel) and atom abundance profiles of intercalated urea perpendicular to the basal surface of kaolinite (right panel) (The origin of right panel is placed at the middle plane of kaolinite interlayer space). The ball color scheme for kaolinite layer is O, red; H, white; Si, orange; and Al, purple; for urea it is C, gray; N, blue; O, red; and H, white.
Figure 5 shows RDF of Halu–Ourea and Osil–Hurea pairs between kaolinite surfaces and the intercalated urea molecules. For the Halu–Ourea pair, a peak is centered at 2.4 Å indicating that O atoms from the intercalated urea molecules could coordinate with the H atoms of –OH groups on alumina surface plausibly via formation of H-bonds. A shoulder next to the first peak indicates the relatively weaker interaction between H atoms on alumina surface and O atom of urea. Urea molecules arrange as monolayer structure within the kaolinite interlayers; the –NH2 groups of urea can compete with –OH groups from alumina surface for forming intermolecular H-bonds with –C=O groups. This could weaken the interactions between urea and alumina surface hence increase the distance from –C=O groups to surface –OH groups. The average number of H-bonds between –C=O groups and surface –OH groups was calculated as 0.36 per –OH with the H-bond length of 2.6 Å. As for the Osil–Hurea pair, a relatively weak peak was observed at 2.0 Å, along with broad peak within the range 3–6 Å. This could be attributed to the hydrogen bonding interactions (e.g., H-bonds) between –NH2 groups and the basal oxygens on siloxane surface. The H-bonds calculation showed that the average number of H-bonds was 0.42 per basal oxygen with the H-bond length of 2.63 Å. The occurrence of intermolecular H-bonds among urea molecules could lead to the broad peaks between 3 and 6 Å. The H-bond calculations also showed that the alumina surface –OH groups can also function as H-acceptors (forming H-bonds) to interact with –NH2 groups. However, this type of H-bond is relatively weaker compared to the other two types of H-bonds. The calculated average number of this H-bond was 0.27 per –OH group with a relatively longer H-bond length of 2.73 Å. The calculation of RDF and H-bonds described above are consistent with the FTIR results that –NH2 groups of urea could be involved in multiple H-bonds with both kaolinite alumina and siloxane surfaces, while the –C=O groups form H-bonds only with the alumina surface.
Figure 5.
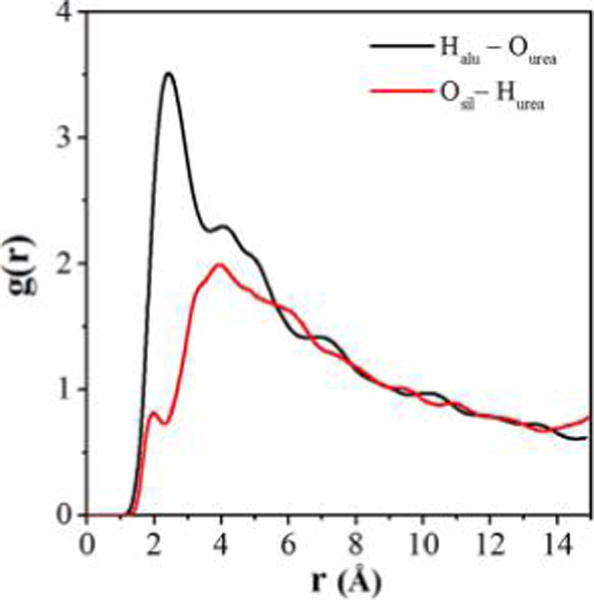
Radial distribution functions (RDF) of Halu–Ourea and Osil–Hurea pairs, where Halu and Osil refer to H of –OH on alumina surface and basal O on siloxane surface, respectively. Ourea and Hurea refer to O and H in urea.
In the absence of covalent bonding between kaolinite surfaces and urea, the interfacial interactions stem primarily from electrostatic, van der Waals, and hydrogen bonding forces. The interaction energies between intercalated urea and kaolinite alumina/siloxane surfaces are present in Figure 6. The interaction energies calculated with the force field-based molecular dynamics simulations are simply used to compare the affinity of urea molecules to two types of kaolinite surfaces, might not best represent the DFT-based (density functional theory) calculated results. The favorable interactions generally manifest at negative interaction energy values. The negative interaction energies of urea with kaolinite alumina and siloxane surfaces indicate that the interlayer environment of kaolinite is energetically favorable for adsorption of urea. For the interaction with alumina surface the average energy was −53.21 kcal/mol with a standard deviation of 8.51, which was 12.77 kcal/mol more negative than that with siloxane surface (−40.44 kcal/mol with a standard deviation of 5.42). The interaction energies calculation indicates relatively stronger interaction of urea with kaolinite alumina surface than that with siloxane surface. The stronger interaction with kaolinite surfaces could result in the slower dynamics of urea on the surfaces. To test this possibility, the MSD of urea on kaolinite alumina/siloxane surfaces was calculated (Figure 7). It shows that the MSD of urea on alumina surface is relatively smaller than that on siloxane surface, which further supported that the affinity of urea to alumina surface is stronger compared to siloxane surface. The –OH groups on the alumina surface could function as both H-donors and H-acceptors to interact with urea molecules, while the siloxane surface only functions as H-acceptors to interact with –NH2 group of urea. The larger number of H-bonds formed between alumina surface and urea further restrict the mobility of urea on alumina surface versus that on siloxane surface. Recall that urea developed the average number of 0.63 (0.36 + 0.27) H-bonds per –OH group on alumina surface, and 0.42 H-bonds per basal oxygen on siloxane surface.
Figure 6.
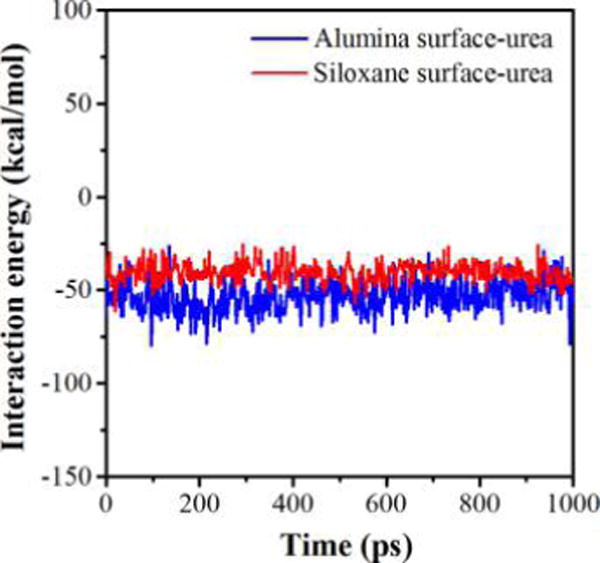
Interaction energies between urea and kaolinite alumina and siloxane surfaces during the production simulations.
Figure 7.
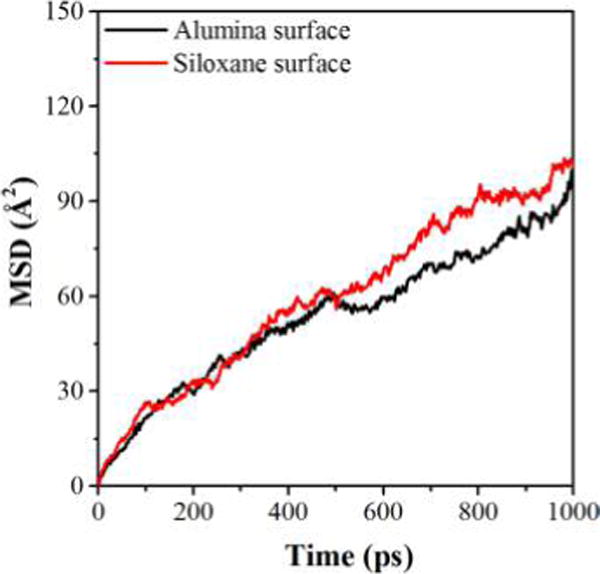
Mean square displacement (MSD) of urea molecules on alumina surface vs siloxane surface as a function of time.
CONCLUSION
Urea could effectively intercalate in kaolinite interlayers, and facilitate the delamination of kaolinite layers during mechanical grinding. The intercalation of kaolinite with urea expanded the basal spacing from 7.2 to 10.8 Å, with the urea molecules arranged as a monolayer structure between kaolinite layers. The –C=O group of urea functions as H-acceptors primarily interacting with –OH groups on kaolinite alumina surface, and the –NH2 group functions as H-donors interacting with both kaolinite siloxane and alumina surfaces. The number of formed H-bonds with alumina surface is more than that with siloxane surface. In addition, the alumina and siloxane surfaces both show attractive interactions with urea molecules with the interaction energy of urea with alumina surface greater than that with siloxane surface. The relatively strong interaction with alumina surface reduces the mobility of urea on the surface compared to that on siloxane surface. Overall, the interlayer of kaolinite is energetically favorable for the intercalation of urea. The alumina surface plays a major role in the intercalation and stabilization of urea in the interlayers, while the contribution of siloxane surface to the intercalation of urea plays a relatively minor role. The results obtained from this study can help develop the appropriate protocol to intercalate and delaminate clays for clay-based applications and products.
Supplementary Material
Acknowledgments
The authors gratefully acknowledge the financial support provided by the National Natural Science Foundation of China (51034006) and (41301535), and Grant P42 ES004911 from the National Institute of Environmental Health Sciences (NIEHS), National Institutes of Health (NIH), and by Michigan AgBioResearch. The contents are solely the responsibility of the authors and do not necessarily represent the official views of NIEHS or NIH. We also acknowledge the support from China Scholarship Council (CSC). The computer time provided by the High Performance Computing Center (HPCC) at Michigan State University is also acknowledged.
Footnotes
Supporting Information
The Supporting Information is available free of charge on the ACS Publications website at DOI: 10.1021/acs.jpcc.6b10533.
Initial structure of constructed models, including urea layer sandwiched between kaolinite layers , kaolinite alumina surface–urea (TO), and kaolinite siloxane surface–urea , and the description of selected force field and the corresponding parameters as well as the calculated basal spacing of kaolinite–urea intercalates at various urea contents (PDF)
ORCID
Qinfu Liu: 0000-0001-8992-7571
Notes
The authors declare no competing financial interest.
References
- 1.Murray HH. Traditional and New Applications for Kaolin, Smectite, and Palygorskite: A General Overview. Appl Clay Sci. 2000;17:207–221. [Google Scholar]
- 2.Bergaya F, Lagaly G. Handbook of Clay Science. Newnes; Oxford, U.K: 2013. [Google Scholar]
- 3.Boyd SA, Lee J-F, Mortland MM. Attenuating Organic Contaminant Mobility by Soil Modification. Nature. 1988;333:345–347. [Google Scholar]
- 4.Kotal M, Bhowmick AK. Polymer Nanocomposites from Modified Clays: Recent Advances and Challenges. Prog Polym Sci. 2015;51:127–187. [Google Scholar]
- 5.Phua SL, Yang L, Toh CL, Guoqiang D, Lau SK, Dasari A, Lu X. Simultaneous Enhancements of UV Resistance and Mechanical Properties of Polypropylene by Incorporation of Dopamine-Modified Clay. ACS Appl Mater Interfaces. 2013;5:1302–1309. doi: 10.1021/am3024405. [DOI] [PubMed] [Google Scholar]
- 6.Dedzo GK, Detellier C. Functional Nanohybrid Materials Derived from Kaolinite. Appl Clay Sci. 2016;130:33–39. [Google Scholar]
- 7.de Faria EH, Nassar EJ, Ciuffi KJ, Vicente MA, Trujillano R, Rives V, Calefi PS. New Highly Luminescent Hybrid Materials: Terbium Pyridine–Picolinate Covalently Grafted on Kaolinite. ACS Appl Mater Interfaces. 2011;3:1311–1318. doi: 10.1021/am2001086. [DOI] [PubMed] [Google Scholar]
- 8.Hirsemann D, Köster TKJ, Wack J, van Wüllen L, Breu J, Senker J. Covalent Grafting to μ-Hydroxy-Capped Surfaces? A Kaolinite Case Study. Chem Mater. 2011;23:3152–3158. [Google Scholar]
- 9.Murray HH, Kogel JE. Engineered Clay Products for the Paper Industry. Appl Clay Sci. 2005;29:199–206. [Google Scholar]
- 10.Liu Q, Zhang Y, Xu H. Properties of Vulcanized Rubber Nanocomposites Filled with Nanokaolin and Precipitated Silica. Appl Clay Sci. 2008;42:232–237. [Google Scholar]
- 11.Tsunematsu K, Tateyama H. Delamination of Urea-Kaolinite Complex by Using Intercalation Procedures. J Am Ceram Soc. 1999;82:1589–1591. [Google Scholar]
- 12.Valášková M, Rieder M, Matějka V, Čapková P, Slíva A. Exfoliation/Delamination of Kaolinite by Low-Temperature Washing of Kaolinite–Urea Intercalates. Appl Clay Sci. 2007;35:108–118. [Google Scholar]
- 13.Velho JAGL, Gomes CdSF. Characterization of Portuguese Kaolins for the Paper Industry: Beneficiation through New Delamination Techniques. Appl Clay Sci. 1991;6:155–170. [Google Scholar]
- 14.Cheng H, Liu Q, Zhang J, Yang J, Frost RL. Delamination of Kaolinite–Potassium Acetate Intercalates by Ball-Milling. J Colloid Interface Sci. 2010;348:355–359. doi: 10.1016/j.jcis.2010.05.006. [DOI] [PubMed] [Google Scholar]
- 15.Makó É, Kristóf J, Horváth E, Vágvölgyi V. Kaolinite–Urea Complexes Obtained by Mechanochemical and Aqueous Suspension Techniques—A Comparative Study. J Colloid Interface Sci. 2009;330:367–373. doi: 10.1016/j.jcis.2008.10.054. [DOI] [PubMed] [Google Scholar]
- 16.Ledoux RL, White JL. Infrared Studies of Hydrogen Bonding Interaction between Kaolinite Surfaces and Intercalated Potassium Acetate, Hydrazine, Formamide, and Urea. J Colloid Interface Sci. 1966;21:127–152. [Google Scholar]
- 17.Frost RL, Kristof J, Rintoul L, Kloprogge JT. Raman Spectroscopy of Urea and Urea-Intercalated Kaolinites at 77 K. Spectrochim Acta, Part A. 2000;56:1681–1691. doi: 10.1016/s1386-1425(00)00223-7. [DOI] [PubMed] [Google Scholar]
- 18.Cheng H, Liu Q, Yang J, Ma S, Frost RL. The Thermal Behavior of Kaolinite Intercalation Complexes-A Review. Thermochim Acta. 2012;545:1–13. [Google Scholar]
- 19.Liu C, Gu C, Yu K, Li H, Teppen BJ, Johnston CT, Boyd SA, Zhou D. Integrating Structural and Thermodynamic Mechanisms for Sorption of PCBs by Montmorillonite. Environ Sci Technol. 2015;49:2796–2805. doi: 10.1021/es505205p. [DOI] [PMC free article] [PubMed] [Google Scholar]
- 20.Zhao Q, Burns SE. Microstructure of Single Chain Quaternary Ammonium Cations Intercalated into Montmorillonite: A Molecular Dynamics Study. Langmuir. 2012;28:16393–16400. doi: 10.1021/la303422p. [DOI] [PubMed] [Google Scholar]
- 21.Krishnan M, Saharay M, Kirkpatrick RJ. Molecular Dynamics Modeling of CO2 and Poly(Ethylene Glycol) in Montmorillonite: The Structure of Clay–Polymer Composites and the Incorporation of CO2. J Phys Chem C. 2013;117:20592–20609. [Google Scholar]
- 22.Underwood T, Erastova V, Greenwell HC. Wetting Effects and Molecular Adsorption at Hydrated Kaolinite Clay Mineral Surfaces. J Phys Chem C. 2016;120:11433–11449. [Google Scholar]
- 23.Greathouse JA, Cygan RT, Fredrich JT, Jerauld GR. Molecular Dynamics Simulation of Diffusion and Electrical Conductivity in Montmorillonite Interlayers. J Phys Chem C. 2016;120:1640–1649. [Google Scholar]
- 24.Rutkai G, Kristóf T. Molecular Simulation Study of Intercalation of Small Molecules in Kaolinite. Chem Phys Lett. 2008;462:269–274. [Google Scholar]
- 25.Fang Q, Huang S, Wang W. Intercalation of Dimethyl Sulfoxide in Kaolinite: Molecular Dynamics Simulation Study. Chem Phys Lett. 2005;411:233–237. [Google Scholar]
- 26.Rutkai G, Makó É, Kristóf́ T. Simulation and Experimental Study of Intercalation of Urea in Kaolinite. J Colloid Interface Sci. 2009;334:65–69. doi: 10.1016/j.jcis.2009.03.022. [DOI] [PubMed] [Google Scholar]
- 27.Tunega D, Haberhauer G, Gerzabek MH, Lischka H. Theoretical Study of Adsorption Sites on the (001) Surfaces of 1:1 Clay Minerals. Langmuir. 2002;18:139–147. [Google Scholar]
- 28.Tunega D, Benco L, Haberhauer G, Gerzabek MH, Lischka H. Ab Initio Molecular Dynamics Study of Adsorption Sites on the (001) Surfaces of 1:1 Dioctahedral Clay Minerals. J Phys Chem B. 2002;106:11515–11525. [Google Scholar]
- 29.Zhang S, Liu Q, Cheng H, Zeng F. Combined Experimental and Theoretical Investigation of Interactions between Kaolinite Inner Surface and Intercalated Dimethyl Sulfoxide. Appl Surf Sci. 2015;331:234–240. [Google Scholar]
- 30.Zhang S, Liu Q, Cheng H, Li X, Zeng F, Frost RL. Intercalation of Dodecylamine into Kaolinite and Its Layering Structure Investigated by Molecular Dynamics Simulation. J Colloid Interface Sci. 2014;430:345–350. doi: 10.1016/j.jcis.2014.05.059. [DOI] [PubMed] [Google Scholar]
- 31.Zhang Y, Liu Q, Xiang J, Frost RL. Influence of Kaolinite Particle Size on Cross-Link Density, Microstructure and Mechanical Properties of Latex Blending Styrene Butadiene Rubber Composites. Polym Sci Ser A. 2015;57:350–358. [Google Scholar]
- 32.Teppen BJ, Rasmussen K, Bertsch PM, Miller DM, Schäfer L. Molecular Dynamics Modeling of Clay Minerals. 1. Gibbsite, Kaolinite, Pyrophyllite, and Beidellite. J Phys Chem B. 1997;101:1579–1587. [Google Scholar]
- 33.Cygan RT, Liang J-J, Kalinichev AG. Molecular Models of Hydroxide, Oxyhydroxide, and Clay Phases and the Development of a General Force Field. J Phys Chem B. 2004;108:1255–1266. [Google Scholar]
- 34.Heinz H, Lin T-J, Kishore Mishra R, Emami FS. Thermodynamically Consistent Force Fields for the Assembly of Inorganic, Organic, and Biological Nanostructures: The Interface Force Field. Langmuir. 2013;29:1754–1765. doi: 10.1021/la3038846. [DOI] [PubMed] [Google Scholar]
- 35.Cygan RT, Greathouse JA, Heinz H, Kalinichev AG. Molecular Models and Simulations of Layered Materials. J Mater Chem. 2009;19:2470–2481. [Google Scholar]
- 36.Heinz H, Vaia RA, Krishnamoorti R, Farmer BL. Self-Assembly of Alkylammonium Chains on Montmorillonite: Effect of Chain Length, Head Group Structure, and Cation Exchange Capacity. Chem Mater. 2007;19:59–68. [Google Scholar]
- 37.Swadling JB, Wright DW, Suter JL, Coveney PV. Structure, Dynamics, and Function of the Hammerhead Ribozyme in Bulk Water and at a Clay Mineral Surface from Replica Exchange Molecular Dynamics. Langmuir. 2015;31:2493–2501. doi: 10.1021/la503685t. [DOI] [PubMed] [Google Scholar]
- 38.Rao Q, Leng Y. Molecular Understanding of CO2 and H2O in a Montmorillonite Clay Interlayer under CO2 Geological Sequestration Conditions. J Phys Chem C. 2016;120:2642–2654. [Google Scholar]
- 39.Loganathan N, Yazaydin AO, Bowers GM, Kalinichev AG, Kirkpatrick RJ. Cation and Water Structure, Dynamics, and Energetics in Smectite Clays: A Molecular Dynamics Study of Ca–Hectorite. J Phys Chem C. 2016;120:12429–12439. [Google Scholar]
- 40.Chitra R, Smith PE. Molecular Dynamics Simulations of the Properties of Cosolvent Solutions. J Phys Chem B. 2000;104:5854–5864. [Google Scholar]
- 41.Stumpe MC, Grubmüller H. Interaction of Urea with Amino Acids: Implications for Urea-Induced Protein Denaturation. J Am Chem Soc. 2007;129:16126–16131. doi: 10.1021/ja076216j. [DOI] [PubMed] [Google Scholar]
- 42.Mishra RK, Flatt RJ, Heinz H. Force Field for Tricalcium Silicate and Insight into Nanoscale Properties: Cleavage, Initial Hydration, and Adsorption of Organic Molecules. J Phys Chem C. 2013;117:10417–10432. [Google Scholar]
- 43.Michalková A, Tunega D. Kaolinite:Dimethylsulfoxide Intercalate–A Theoretical Study. J Phys Chem C. 2007;111:11259–11266. [Google Scholar]
- 44.Jeffrey GA. An Introduction to Hydrogen Bonding. Oxford University Press; Oxford, U.K: 1997. [Google Scholar]
- 45.Allen MP, Tildesley DJ. Computer Simulation of Liquids. Clarendon Press; Oxford, U.K: 1989. [Google Scholar]
- 46.Schaber PM, Colson J, Higgins S, Thielen D, Anspach B, Brauer J. Thermal Decomposition (Pyrolysis) of Urea in an Open Reaction Vessel. Thermochim Acta. 2004;424:131–142. [Google Scholar]
- 47.Stradella L, Argentero M. A Study of the Thermal Decomposition of Urea, of Related Compounds and Thiourea Using DSC and TG-EGA. Thermochim Acta. 1993;219:315–323. [Google Scholar]
- 48.Liu Q, Zhang S, Cheng H, Wang D, Li X, Hou X, Frost R. Thermal Behavior of Kaolinite–Urea Intercalation Complex and Molecular Dynamics Simulation for Urea Molecule Orientation. J Therm Anal Calorim. 2014;117:189–196. [Google Scholar]
- 49.Gardolinski JE, Wypych F, Cantão MP. Exfoliation and Hydration of Kaolinite after Intercalation with Urea. Quim Nova. 2001;24:761–767. [Google Scholar]
- 50.Farmer VC, Russell JD. The Infra-red Spectra of Layer Silicates. Spectrochim Acta. 1964;20:1149–1173. [Google Scholar]
- 51.Keuleers R, Desseyn HO, Rousseau B, Van Alsenoy C. Vibrational Analysis of Urea. J Phys Chem A. 1999;103:4621–4630. [Google Scholar]
- 52.Grdadolnik J, Maréchal Y. Urea and Urea–Water Solutions—an Infrared Study. J Mol Struct. 2002;615:177–189. [Google Scholar]
Associated Data
This section collects any data citations, data availability statements, or supplementary materials included in this article.


