Abstract
Epigenetic changes, especially DNA methylation at CpG loci have important implications in cancer and other complex diseases. With the development of next-generation sequencing (NGS), it is feasible to generate data to interrogate the difference in methylation status for genome-wide loci using case-control design. However, a proper and efficient statistical test is lacking. There are several challenges. First, unlike methylation experiments using microarrays, where there is one measure of methylation for one individual at a particular CpG site, here we have the counts of methylation allele and unmethylation allele for each individual. Second, due to the nature of sample preparation, the measured methylation reflects the methylation status of a mixture of cells involved in sample preparation. Therefore, the underlying distribution of the measured methylation level is unknown, and a robust test is more desirable than parametric approach. Third, currently NGS measures methylation at over 2 million CpG sites. Any statistical tests have to be computationally efficient in order to be applied to the NGS data. Taking these challenges into account, we propose a test for differential methylation based on clustered data analysis by modeling the methylation counts. We performed simulations to show that it is robust under several distributions for the measured methylation levels. It has good power and is computationally efficient. Finally, we apply the test to our NGS data on chronic lymphocytic leukemia. The results indicate that it is a promising and practical test.
Keywords: DNA methylation, differential methylation test, next-generation sequencing
Introduction
Genetic association studies, especially large-scale genome-wide association studies have become very popular in recent years due to the rapid advancement of genotyping technologies and the completion of the Human Genome Project. Several hundreds of disease susceptibility loci have been identified through genome-wide association studies. Despite this progress, the genetic variants identified so far only explain a small proportion of the phenotypic variation for most complex diseases [Eichler et al., 2010]. Another potential source of phenotypic variation is epigenetic changes such as DNA methylation.
DNA methylation refers to the addition of a methyl group to the 5′ of cytosine in a CpG dinucleotide. DNA methylation in the promoter region can suppress expression of the gene. It has been shown that DNA methylation changes have been involved in many human diseases, especially cancer [Kulis and Esteller, 2010; Spisák et al., 2012]. Hypermethylation of CpG dinucleotides is an important hallmark for the inactivation of tumor suppresor genes. In contrast, hypomethylation of normally methylated genes could lead to activation of oncogenes. Genome-wide epigenetic patterns are being investigated through the Human Epigenome Project [Satterlee et al., 2010].
With the development of biotechnology, it is now possible to generate methylation data at genome-wide CpG sites through next-generation sequencing (NGS). In these experiments, DNA samples are treated with bisulfite, which converts unmethylated cytosines to uracils and leaves methylated cytosines intact. NGS results in counts of the number of molecules with a cytosine (methylated) and number of molecules with a uracil (unmethylated) at each CpG site for each subject or sample.
One naive approach to test for differential methylation between groups (e.g., cases and controls) based on the counts from NGS is to sum the counts across subjects within a group for a given CpG site, resulting in a 2 × 2 contingency table (methylated/unmethylated × case/control). Pearson’s chi-squared test of independence is then used with this table. This approach is problematic because the sequencing coverage (larger numbers of total molecules measured) for each individual could be different, leading to individuals with large sequencing coverage having undue influence on the test statistic. Further, this test does not take into account between-subject variability in methylation levels.
Another approach is to first estimate the methylation proportion (β) at each CpG site for each individual, β = nmethy/(nmethy + nunmethy). A t-test can then be applied to β. This approach removes the problem of unequal coverage as in the previous approach, and this test also accounts for between-subject variability in methylation levels. However, there are several problems with this approach. First, unlike data obtained from methylation microarray experiments [Teschendorff et al., 2010], where methylation proportion is directly measured, the methylation proportion is estimated from count data with NGS. Differences in sequencing coverage will lead to estimates of β that differ in their accuracy, with subjects with larger sequencing coverage having smaller standard errors for the estimate of β. Such heteroscedasticity can be problematic for t-tests. Further, the normality assumption of the t-test may not hold for NGS methylation data. In addition to the effects of sequencing coverage, the methylation proportion could be affected by many factors such as library preparation, and batch effects. These additional factors affect the distribution over samples or subjects of the true β, and as such this distribution is unknown. Therefore, a robust alternative to the t-test is needed. Another concern for analyzing methylation proportion using a t-test is that the t-test is defined over −∞ to ∞ while methylation proportion is restricted between 0 and 1. In real data, we observe a substantial proportion of samples and CpG sites have methylation proportion equal 0 or 1. In this paper, we propose a test for detecting differentially methylated CpG sites based on clustered data analysis by directly modeling the methylation counts. We then performed simulations to show that the proposed test is robust under several distributions for the measured methylation levels.
Methods
Model
Here we model the methylation counts in a case-control study design. Suppose there are nA individuals in the case group and nU individuals in the control group. We have NGS genome-wide methylation data at k CpG sites. Let mAij be the count of methylated reads for individual i at CpG site j in cases, cAij be the coverage for individual i at CpG site j in cases, and βAij be the true methylation level for individual i at CpG site j in cases, we model mAij with a binomial distribution
| (1) |
Similarly, we define mUij, cUij, and βUij be the corresponding quantities in controls, and we have
| (2) |
The key here is to treat the NGS reads as clusters within each individual and the problem becomes to compare two proportions in the presence of clustered data. These clusters are a natural result of the experimental design and the nature of the binomial data being measured on each subject within each group. We adopt a method from clustered data analysis for this purpose [Rao and Scott, 1992]. This approach first calculates a design effect, which is then used to adjust the methylation proportions in cases and controls.
Specifically, we first calculate the overall methylation counts at CpG site j in cases and controls, respectively, ignoring the clustering within individuals as in the naive contingency table approach mentioned above. That is, we have and . The sample methylation proportions in cases and controls are given by
where and . The variances of the sample methylation proportions are given by
and
Without clustering, the variances of the sample methylation proportion from a binomial distribution would be given by
Therefore, the design effects because of clustering are given by
The design effects are then used to adjust the methylation counts, and total coverage in cases and controls. That is,
The adjusted overall methylation level at CpG site j is given by
The test statistic is an adjusted chi-squared statistic, given by
which follows a χ2 distribution with one degree of freedom.
Simulation Study
Simulations were performed to study the properties of the proposed test. Since the distribution of true methylation level is unknown and likely varies from site to site, we generate methylation levels βAij and βUij from several distributions to study the robustness of the proposed test. We considered three distributions: (a) beta, (b) normal, and (c) mixed normal distributions. Specifically, in scenario (a), the methylation proportion for individual i at CpG site j was sampled from
in cases and sampled from
in controls. In scenario (b), methylation proportions were sampled from in cases and from in controls. Since methylation proportion is a value between 0 and 1, simulated values < 0 were set to 0 and values > 1 were set to 1. In scenario (c), methylation proportions were sampled from two-component mixture normal distributions, one for methylated sequences and the other for unmethylated sequences. That is, and . Similar to scenario (b), simulated values outside [0, 1] were set to the nearest boundary. In each scenario, the parameters for the distribution of methylation levels were set to be equal for simulations under H0 to evaluate type I error rate. They were set to be different for simulations under HA to evaluate power.
In each scenario, we simulated counts of methylated molecules according to Equations (1) and (2) for cases and controls, respectively, using the methylation proportions simulated as above. We allowed the coverage cAij and cUij to vary by sampling from a normal distribution N(30, 13) with a minimum of 5, which is the minimum number of reads used on the actual data that we analyze below.
Results
We performed simulations under H0 to study the type I error rate of the proposed test. As detailed in the previous section, we considered three scenarios for the distributions of methylation levels. For each scenario, we simulated methylation counts for equal number of individuals in cases and controls. We set nA = nU to varying numbers from 10 to 500 to study the effect of sample size. We performed 100,000 replicates for each sample size in each scenario. Table I gives the empirical type I error rate evaluated at several α levels for scenario (a), where individual methylation levels were generated from a beta distribution. Similarly, Table II gives the empirical type I error rate for scenario (b), where individual methylation levels were generated from a normal distribution and Table III gives the empirical type I error rate for scenario (c), where individual methylation levels were generated from a mixture normal distribution. As can be seen from these tables, type I error rate approaches the nominal α level as sample size increases. This is the case for all the α levels and all three distributions of methylation levels. Compared among the three simulation scenarios, the inflation of the type I error is lower when methylation levels follow a normal distribution than it is in the scenarios where methylation level follows either beta or mixture normal distribution. The inflation is highest when methylation level follows mixture normal distribution in scenario (c).
Table I.
Type I error rate for simulation scenario (a)
| Sample size | Test | α = 0.05 | α = 0.01 | α = 0.001 | α = 0.0001 |
|---|---|---|---|---|---|
| 10 | Our test | 0.07747 | 0.02564 | 0.0067 | 0.00217 |
| t-Test | 0.09458 | 0.04886 | 0.01629 | 0.00386 | |
| Naive | 0.24474 | 0.13104 | 0.05517 | 0.024 | |
| 20 | Our test | 0.06425 | 0.01765 | 0.00295 | 0.00069 |
| t-Test | 0.07798 | 0.0274 | 0.00923 | 0.00402 | |
| Naive | 0.25003 | 0.13357 | 0.05735 | 0.02437 | |
| 50 | Our test | 0.0548 | 0.0128 | 0.00172 | 0.00024 |
| t-Test | 0.06759 | 0.02646 | 0.0101 | 0.0041 | |
| Naive | 0.25753 | 0.14062 | 0.06116 | 0.02628 | |
| 100 | Our test | 0.05299 | 0.01132 | 0.00128 | 0.00012 |
| t-Test | 0.05941 | 0.01566 | 0.00286 | 0.00064 | |
| Naive | 0.26273 | 0.14285 | 0.06193 | 0.02766 | |
| 500 | Our test | 0.05096 | 0.01022 | 0.001 | 0.00014 |
| t-Test | 0.05704 | 0.01635 | 0.00375 | 0.0011 | |
| Naive | 0.26613 | 0.14419 | 0.06313 | 0.02808 |
Table II.
Type I error rate for simulation scenario (b)
| Sample size | Test | α = 0.05 | α = 0.01 | α = 0.001 | α = 0.0001 |
|---|---|---|---|---|---|
| 10 | Our test | 0.07261 | 0.02277 | 0.00529 | 0.00137 |
| t-Test | 0.08721 | 0.01694 | 0.00205 | 0.00034 | |
| Naive | 0.23829 | 0.12507 | 0.05156 | 0.0214 | |
| 20 | Our test | 0.05969 | 0.01522 | 0.00255 | 0.00045 |
| t-Test | 0.0735 | 0.02209 | 0.00524 | 0.00131 | |
| Naive | 0.24445 | 0.12898 | 0.05399 | 0.02401 | |
| 50 | Our test | 0.05399 | 0.01177 | 0.00146 | 0.00015 |
| t-Test | 0.06179 | 0.0154 | 0.00244 | 0.00046 | |
| Naive | 0.25143 | 0.13391 | 0.05578 | 0.02429 | |
| 100 | Our test | 0.05178 | 0.01092 | 0.00119 | 0.00013 |
| t-Test | 0.05719 | 0.01082 | 0.00141 | 0.00022 | |
| Naive | 0.25463 | 0.13623 | 0.05833 | 0.02487 | |
| 500 | Our test | 0.05043 | 0.01039 | 0.00093 | 0.00011 |
| t-Test | 0.05332 | 0.01199 | 0.00154 | 0.00017 | |
| Naive | 0.25898 | 0.13882 | 0.05957 | 0.02603 |
Table III.
Type I error rate for simulation scenario (c)
| Sample size | Test | α = 0.05 | α = 0.01 | α = 0.001 | α = 0.0001 |
|---|---|---|---|---|---|
| 10 | Our test | 0.08333 | 0.03088 | 0.00959 | 0.00345 |
| t-Test | 0.08357 | 0.01641 | 0.00161 | 0.00014 | |
| Naive | 0.57858 | 0.46992 | 0.3583 | 0.2758 | |
| 20 | Our test | 0.06425 | 0.01855 | 0.00387 | 0.00085 |
| t-Test | 0.08276 | 0.03117 | 0.0094 | 0.00322 | |
| Naive | 0.5805 | 0.47132 | 0.35893 | 0.2802 | |
| 50 | Our test | 0.0559 | 0.0131 | 0.00182 | 0.00031 |
| t-Test | 0.06304 | 0.0181 | 0.00382 | 9e-04 | |
| Naive | 0.58574 | 0.47774 | 0.36503 | 0.28457 | |
| 100 | Our test | 0.05207 | 0.01062 | 0.00134 | 0.00019 |
| t-Test | 0.05491 | 0.01258 | 0.00183 | 0.00028 | |
| Naive | 0.5885 | 0.47754 | 0.36568 | 0.285 | |
| 500 | Our test | 0.04992 | 0.00967 | 0.00091 | 0.00011 |
| t-Test | 0.05348 | 0.01173 | 0.00131 | 0.00019 | |
| Naive | 0.59078 | 0.48068 | 0.36806 | 0.28677 |
In comparison, we applied t-test and the naive contingency table approach to the same simulated data sets under H0. The results of type I error rate are given in Tables I–III, respectively, for simulation scenario (a), scenario (b), and scenario (c). The type I error rate is inflated for t-test relative to the proposed test under all three simulation scenarios. The type I error rate for the naive contingency table approach is inflated even further.
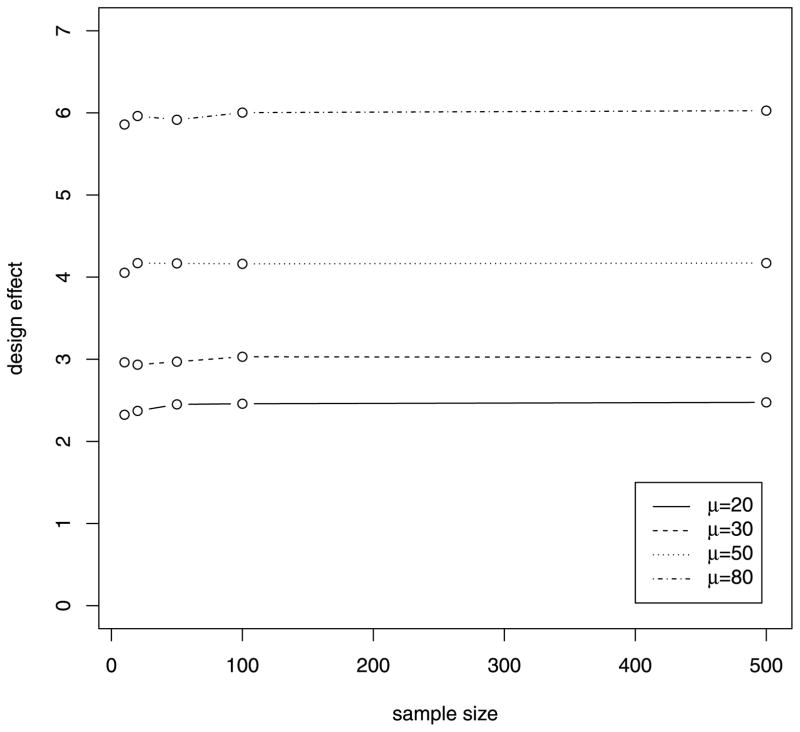
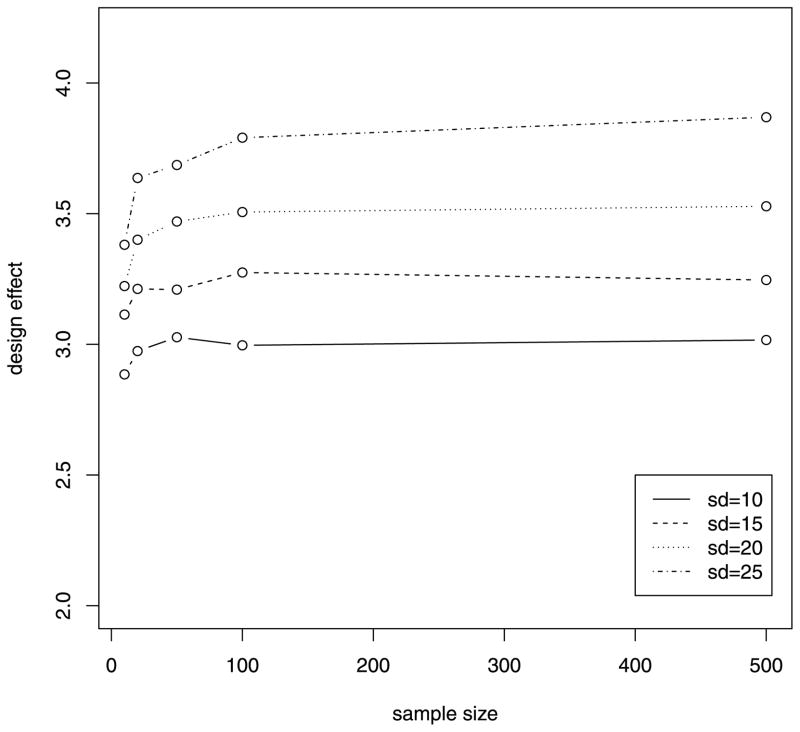
Because the design effect distinguishes our proposed test with the naive test, we performed simulations under H0 to explore factors that might affect the magnitude of the design effect. In the first set of simulations, individual sequencing coverage was generated from normal distributions with constant SD of 15 and varying mean values. As can be seen from Figure 1, the design effect increases as the mean value for sequencing coverage increases, and sample size does not have much effect on the design effect. In the second set of simulations, individual sequencing coverage was generated from normal distributions with constant mean of 30 and varying SD values. As can be seen from Figure 2, the design effect increases as the variability of sequencing coverage increases and sample size has much less effect on the design effect. These results suggest that larger corrections to the naive test are required as sequencing coverage increases, and larger sample sizes do not reduce the design effect.
Figure 1.
Relationship of design effect and sample size from simulations with different mean of sequencing coverage.
Figure 2.
Relationship of design effect and sample size from simulations with different SD of sequencing coverage.
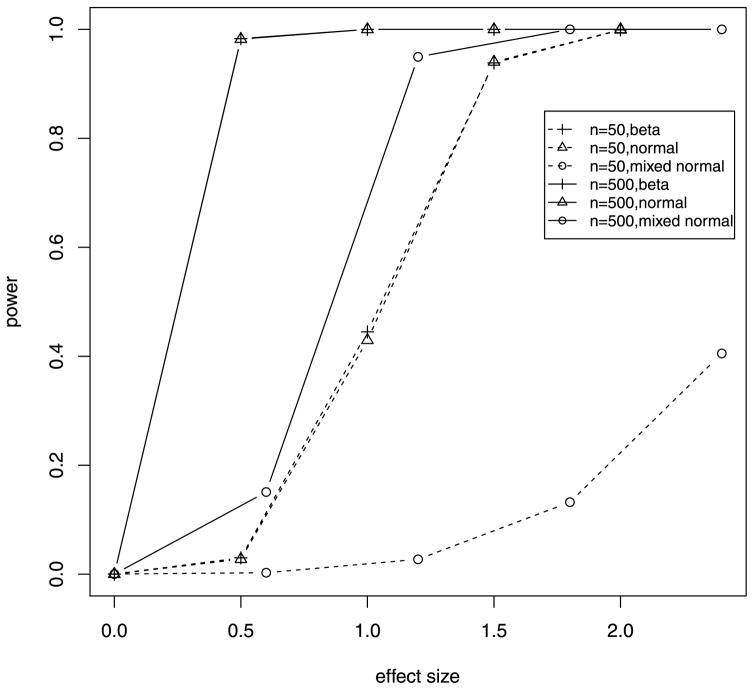
We next performed simulations under HA to study the power of the proposed test, assuming that methylation levels in cases and controls were drawn from distributions with different means. Figure 3 shows the power curves evaluated at α = 0.0001 for the three simulation scenarios. In the figure, effect size is represented by Cohen’s d and calculated as the mean difference divided by the standard deviation set in the simulations. As shown in these figures, power of the proposed test increases rapidly with effect size. Compared among the three simulation scenarios, the power curves in scenario (a) and scenario (b) are almost identical, while the power is reduced in scenario (c) compared with scenarios (a) and (b).
Figure 3.
Power curve from simulation at α = 0.0001.
We next analyzed genome-wide methylation data from a study of chronic lymphocytic leukemia (CLL), a B-cell lymphoma mainly of adults that is a very heterogeneous disease. Mutations within Ig VH genes are known to be associated with the aggressiveness of the cancer, with patients lacking mutations having a poorer prognosis [Hamblin et al., 1999; Damle et al., 1999]. CD38 levels are known to be associated with both Ig VH mutation status [Damle et al., 1999] and prognosis [Del Poeta et al., 2001], with patients having lower levels progressing more slowly.
Reduced representation bisulfite sequencing (RRBS) [Meissner et al., 2005] was used to measure methylation levels in 11 CLL samples [Pei et al., 2012]. The RRBS technology provides counts of DNA molecules that are methylated and unmethylated for any CpG site that was sequenced with a typical run providing data for approximately 2 million CpG sites. The samples were categorized as low- vs. high-risk based on CD38 levels, with seven samples having low CD38 levels (low-risk) and four samples having high CD38 levels (high-risk). The RRBS data that we analyze have already been cleaned and aligned as described in Pei et al. [2012].
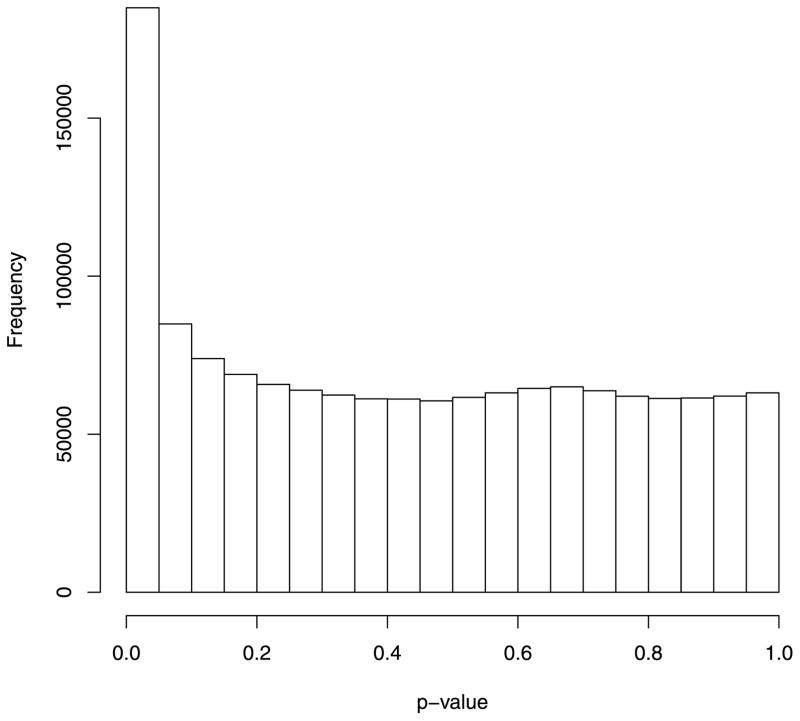
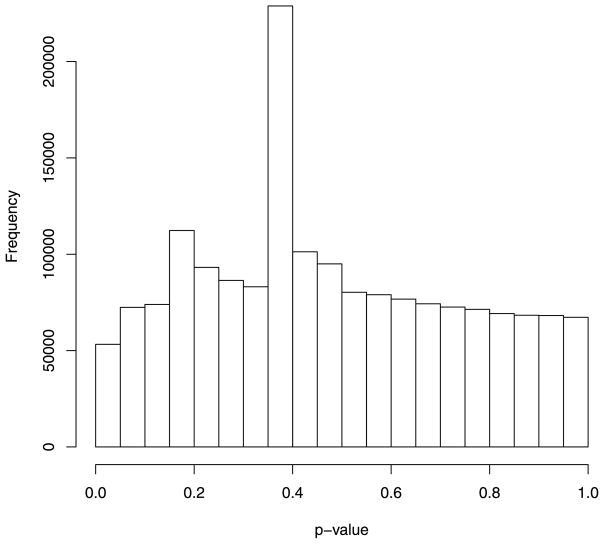
Using this approach, we obtained genome-wide methylation data on 2,442,443 CpG sites. The design effect of the proposed test in the high-risk group has a mean of 4.04 (SD = 7.88). The design effect in the low-risk group has a mean of 4.53 (SD = 12.59). The P-value distribution for the proposed test is shifted toward smaller P-values relative to a uniform distribution, as expected if a fraction of the CpG sites came from HA (Fig. 4). For comparison, we also applied t-test approach to the data set by first estimating methylation proportions from the methylation counts and then performing two-sample t-tests on the estimated methylation proportions. The P-value distribution for the t-test (Fig. 5) shows a mode toward moderate P-values with a strong peak at near P = 0.4. This distribution is not the shape expected under either H0 or HA and reflects that the t-test is not performing well with the CLL data. Importantly, the percent of CpG sites with a P-value less than 0.01 for the t-test was only 0.5%.
Figure 4.
P-value distribution of the proposed test applied to the CLL methylation data.
Figure 5.
P-value distribution of t-test applied to the CLL methylation data.
Discussion
Analysis of genome-wide methylation data have drawn much attention recently. Many statistical methods have been proposed. However, most of the methods are developed for methylation data generated from microarrays [Chen et al., 2012; Kuan et al., 2010; Sun and Wang, 2012; Wang, 2011]. Methylation data generated from NGS pose several challenges for statistical analysis. First, unlike methylation experiments using microarrays, where there is one measure of methylation for one individual at a particular CpG site, here we have the counts of the methylation allele and the unmethylation allele for each individual. Second, the accuracy of estimates of the methylation proportion will differ between subjects due to differences in sequencing coverage. Any method should appropriately account for such differences. Third, the distribution of the true β is unknown and will likely affect any test about mean β. Fourth, currently NGS measures methylation at over 2 million CpG sites for each sample/subject. Any statistical test has to be computationally efficient in order to be applied to the NGS data. Taking these challenges into account, we propose a test for differential methylation based on clustered data analysis by modeling the methylation counts directly. Simulations results show that the proposed test is robust under several distributions for the measured methylation levels. The proposed test is also robust for variations in coverage from different individuals. Further, the proposed test is computationally efficient. In our real data application, it took only 5 min to perform all the tests at over 2 million CpG sites. The computation was performed in R using a desktop computer with 3.3 GHz CPU.
Although the proposed test works well for testing for differential methylation based on binomial counts, the current method cannot accommodate factors such as batch effects or covariates such as age and sex. Batch effects are likely to be important in any genome-wide study. Batch effects may enter NGS methylation studies in terms of the sequencing coverage. The test used here would account for such batch effects. However, any other random effects due to batches may not be properly accounted in the current test. Additionally, relative methylation levels have been shown to be strongly associated with age [Bell et al., 2012; Teschendorff et al., 2010] and with sex [Kibriya et al., 2011; Liu et al., 2010]. Future work should focus on extending this method such that covariates and batch effects can be accommodated.
Another limitation of the proposed test is that it is a single locus test for differential methylation and ignores the correlation between close-by CpG sites. There is a growing interest in developing methods detecting differentially methylated regions (DMRs) [Hansen et al., 2012; Heyn et al., 2012; Jaffe et al., 2012]. It may be possible to include our proposed test in a hierarchical modeling approach for detecting DMRs. In conclusion, our proposed test is a promising and practical test for genome-wide methylation studies. Because of its efficiency, it is suitable for a first-round scanning for differential methylation in a genome-wide study.
Acknowledgments
We thank the reviewers for their constructive comments. The work was supported by an intramural grant from the Georgia Health Sciences University.
References
- Bell JT, Tsai PC, Yang TP, Pidsley R, Nisbet J, Glass D, Mangino M, Zhai G, Zhang F, Valdes A, et al. Epigenome-wide scans identify differentially methylated regions for age and age-related phenotypes in a healthy ageing population. PLoS Genet. 2012;8:e1002629. doi: 10.1371/journal.pgen.1002629. [DOI] [PMC free article] [PubMed] [Google Scholar]
- Chen Z, Liu Q, Nadarajah S. A new statistical approach to detecting differentially methylated loci for case control illumina array methylation data. Bioinformatics. 2012;28:1109–1113. doi: 10.1093/bioinformatics/bts093. [DOI] [PMC free article] [PubMed] [Google Scholar]
- Damle RN, Wasil T, Fais F, Ghiotto F, Valetto A, Allen SL, Buchbinder A, Budman D, Dittmar K, Kolitz J, et al. Ig V gene mutation status and cd38 expression as novel prognostic indicators in chronic lymphocytic leukemia. Blood. 1999;94:1840–1847. [PubMed] [Google Scholar]
- Del Poeta G, Maurillo L, Venditti A, Buccisano F, Epiceno AM, Capelli G, Tamburini A, Suppo G, Battaglia A, Del Principe MI, et al. Clinical significance of CD38 expression in chronic lymphocytic leukemia. Blood. 2001;98:2633–2639. doi: 10.1182/blood.v98.9.2633. [DOI] [PubMed] [Google Scholar]
- Del Poeta G, Maurillo L, Venditti A, Buccisano F, Epiceno AM, Capelli G, Tamburini A, Suppo G, Battaglia A, Del Principe MI, et al. Distinct DNA methylomes of newborns and centenarians. Proc Natl Acad Sci USA. 2012;109:10522–10527. doi: 10.1073/pnas.1120658109. [DOI] [PMC free article] [PubMed] [Google Scholar]
- Eichler EE, Flint J, Gibson G, Kong A, Leal SM, Moore JH, Nadeau JH. Missing heritability and strategies for finding the underlying causes of complex disease. Nat Rev Genet. 2010;11:446–450. doi: 10.1038/nrg2809. [DOI] [PMC free article] [PubMed] [Google Scholar]
- Hamblin TJ, Davis Z, Gardiner A, Oscier DG, Stevenson FK. Unmutated ig v(h) genes are associated with a more aggressive form of chronic lymphocytic leukemia. Blood. 1999;94:1848–1854. [PubMed] [Google Scholar]
- Hansen KD, Langmead B, Irizarry RA. Bsmooth: from whole genome bisulfite sequencing reads to differentially methylated regions. Genome Biol. 2012;13:R83. doi: 10.1186/gb-2012-13-10-r83. [DOI] [PMC free article] [PubMed] [Google Scholar]
- Jaffe AE, Murakami P, Lee H, Leek JT, Fallin MD, Feinberg AP, Irizarry RA. Bump hunting to identify differentially methylated regions in epigenetic epidemiology studies. Int J Epidemiol. 2012;41:200–209. doi: 10.1093/ije/dyr238. [DOI] [PMC free article] [PubMed] [Google Scholar]
- Kibriya MG, Raza M, Jasmine F, Roy S, Paul-Brutus R, Rahaman R, Dodsworth C, Rakibuz-Zaman M, Kamal M, Ahsan H. A genome-wide DNA methylation study in colorectal carcinoma. BMC Med Genomics. 2011;4:50. doi: 10.1186/1755-8794-4-50. [DOI] [PMC free article] [PubMed] [Google Scholar]
- Kuan PF, Wang S, Zhou X, Chu H. A statistical framework for illumina DNA methylation arrays. Bioinformatics. 2010;26:2849–2855. doi: 10.1093/bioinformatics/btq553. [DOI] [PMC free article] [PubMed] [Google Scholar]
- Kulis M, Esteller M. DNA methylation and cancer. Adv Genet. 2010;70:27–56. doi: 10.1016/B978-0-12-380866-0.60002-2. [DOI] [PubMed] [Google Scholar]
- Liu J, Morgan M, Hutchison K, Calhoun VD. A study of the influence of sex on genome wide methylation. PLoS One. 2010;5:e10028. doi: 10.1371/journal.pone.0010028. [DOI] [PMC free article] [PubMed] [Google Scholar]
- Meissner A, Gnirke A, Bell GW, Ramsahoye B, Lander ES, Jaenisch R. Reduced representation bisulfite sequencing for comparative high-resolution DNA methylation analysis. Nucleic Acids Res. 2005;33:5868–5877. doi: 10.1093/nar/gki901. [DOI] [PMC free article] [PubMed] [Google Scholar]
- Pei L, Choi JH, Liu J, Lee EJ, McCarthy B, Wilson JM, Speir E, Awan F, Tae H, Arthur G, et al. Genome-wide DNA methylation analysis reveals novel epigenetic changes in chronic lymphocytic leukemia. Epigenetics. 2012;7:567–578. doi: 10.4161/epi.20237. [DOI] [PMC free article] [PubMed] [Google Scholar]
- Rao JN, Scott AJ. A simple method for the analysis of clustered binary data. Biometrics. 1992;48:577–585. [PubMed] [Google Scholar]
- Satterlee JS, Schbeler D, Ng H-H. Tackling the epigenome: challenges and opportunities for collaboration. Nat Biotechnol. 2010;28:1039–1044. doi: 10.1038/nbt1010-1039. [DOI] [PubMed] [Google Scholar]
- Spisák S, Kalmár A, Galamb O, Wichmann B, Sipos F, Péterfia B, Csabai I, Kovalszky I, Semsey S, Tulassay Z, et al. Genome-wide screening of genes regulated by DNA methylation in colon cancer development. PLoS One. 2012;7:e46215. doi: 10.1371/journal.pone.0046215. [DOI] [PMC free article] [PubMed] [Google Scholar]
- Sun H, Wang S. Penalized logistic regression for high-dimensional DNA methylation data with case-control studies. Bioinformatics. 2012;28:1368–1375. doi: 10.1093/bioinformatics/bts145. [DOI] [PMC free article] [PubMed] [Google Scholar]
- Teschendorff AE, Menon U, Gentry-Maharaj A, Ramus SJ, Weisenberger DJ, Shen H, Campan M, Noushmehr H, Bell CG, Maxwell AP, et al. Age-dependent DNA methylation of genes that are suppressed in stem cells is a hallmark of cancer. Genome Res. 2010;20:440–446. doi: 10.1101/gr.103606.109. [DOI] [PMC free article] [PubMed] [Google Scholar]
- Wang S. Method to detect differentially methylated loci with case-control designs using illumina arrays. Genet Epidemiol. 2011;35:686–694. doi: 10.1002/gepi.20619. [DOI] [PMC free article] [PubMed] [Google Scholar]


