Abstract
OBJECTIVE:
Six Sigma is one of the most popular quality management system tools employed for process improvement. The Six Sigma methods are usually applied when the outcome of the process can be measured. This study was done to assess the performance of individual biochemical parameters on a Sigma Scale by calculating the sigma metrics for individual parameters and to follow the Westgard guidelines for appropriate Westgard rules and levels of internal quality control (IQC) that needs to be processed to improve target analyte performance based on the sigma metrics.
MATERIALS AND METHODS:
This is a retrospective study, and data required for the study were extracted between July 2015 and June 2016 from a Secondary Care Government Hospital, Chennai. The data obtained for the study are IQC - coefficient of variation percentage and External Quality Assurance Scheme (EQAS) - Bias% for 16 biochemical parameters.
RESULTS:
For the level 1 IQC, four analytes (alkaline phosphatase, magnesium, triglyceride, and high-density lipoprotein-cholesterol) showed an ideal performance of ≥6 sigma level, five analytes (urea, total bilirubin, albumin, cholesterol, and potassium) showed an average performance of <3 sigma level and for level 2 IQCs, same four analytes of level 1 showed a performance of ≥6 sigma level, and four analytes (urea, albumin, cholesterol, and potassium) showed an average performance of <3 sigma level. For all analytes <6 sigma level, the quality goal index (QGI) was <0.8 indicating the area requiring improvement to be imprecision except cholesterol whose QGI >1.2 indicated inaccuracy.
CONCLUSION:
This study shows that sigma metrics is a good quality tool to assess the analytical performance of a clinical chemistry laboratory. Thus, sigma metric analysis provides a benchmark for the laboratory to design a protocol for IQC, address poor assay performance, and assess the efficiency of existing laboratory processes.
Keywords: Bias, internal quality control, quality goal index, Six Sigma, Westgard rule
Introduction
Quality control measures employed to assess the analytical phase in a clinical chemistry laboratory are internal quality control (IQC) and external quality control (External Quality Assurance Scheme [EQAS]). IQC is a sample material whose matrix is identical to the patients' sample and has an established concentration range available in two or three levels covering the medical decision points. The IQC is run as per NABL guidelines, interpreted using control charts such as Levy Jennings' and application of Westgard rules. IQC ensures a continuous watch of the analytical system, so as to check whether the results are reliable enough to be released. External quality control involves analyzing and reporting of control samples supplied by an external agency, at a predefined time interval which in Clinical chemistry is once a month. External quality control is interpreted by either Z-score or standard deviation index. A Z-score is a calculated value that tells us, as to how many standard deviations, a control result has shifted from the mean value which is expected for that material. The exact number of errors done by the laboratory in the analytical phase cannot be assessed by running internal and external QCs, but can be quantified by Sigma metrics.[1] Can be quantified using sigma metrics in the laboratory.
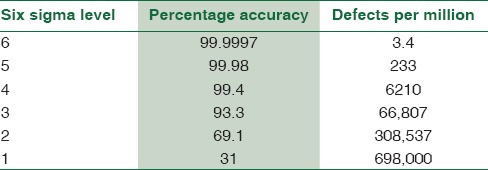
Sigma in statistics is used to represent the standard deviation which is an indicator of the degree of variation in a set of processes. Sigma measures how far a given process deviates from perfection. Six Sigma is one of the popular quality management system tools employed for process improvement.[2] Sir Bill Smith is the Father of Six Sigma who introduced this quality improvement methodology to Motorola in 1986.[3] The power of Six Sigma is in its measure of process performance on the “Sigma Scale.” The Six Sigma Scale typically runs from 0 to 6, but a process can actually exceed Six Sigma, if variability is sufficiently low as to decrease the defect rate. The best or “world class quality” products have a level of performance of Six Sigma. The Six Sigma methods are usually applied when the outcome of the process can be measured. The poor outcomes are measured in terms of defects per million and are expressed on a sigma scale. Sigma metrics is really the evolution of total quality management (TQM) with a more quantitative assessment of process performance and clearer goals for process improvement. The exact number of defects or errors done by the laboratory can be quantified using sigma metrics in the laboratory.[4] The level of sigma metrics and the corresponding defects per million test is shown in Table 1.
Table 1.
Level of Sigma metrics and the corresponding defects per million test
Thus, it is possible to assess the quality of laboratory testing processes and the number of QC that is needed to ensure that the desired quality is achieved with the help of Six Sigma principles and metrics. This study was done to assess the performance of individual biochemical parameters on a Sigma Scale by calculating the sigma metrics for individual parameters and to follow the Westgard guidelines for appropriate Westgard rules and levels of IQC that needs to be processed to improve target analyte performance based on the sigma metrics.
Materials and Methods
This is a retrospective study, and data required for the study were extracted between July 2015 and June 2016 from a Secondary Care Government Hospital, Chennai. The data obtained for the study are IQC - coefficient of variation percent (CV%) and EQAS-Bias% for urea, creatinine, total bilirubin, serum glutamic oxaloacetic transaminase/aspartate aminotransferase (AST), serum glutamic pyruvic transaminase/alanine aminotransferase (ALT), alkaline phosphatase (ALP), total protein, albumin, calcium, phosphorus, magnesium, total cholesterol, triglycerides, high-density lipoprotein (HDL), sodium, and potassium. This study was done to assess the performance of these 16 biochemical parameters run on VITROS 4600 fully automated biochemistry analyzer on a Sigma Scale by calculating the sigma metrics for each parameter. Sigma metrics was calculated with the following formula:
Sigma = (TEa − Bias)/CV
Where, TEa is total error allowable, Bias and CV are the indicator of systematic and random errors, respectively.
Total allowable error
Analytical Quality Requirements are defined by Clinical Laboratory Improvement Amendment (CLIA)-88 Proficiency Testing Criteria in terms of total allowable error “TEa” (or more correctly “total allowable variation”) for acceptable performance for each analyte.[5]
Bias
Bias is the systematic difference between the expected results obtained by the laboratory test method and the results that would be obtained from an accepted reference method. Bias percentage for each parameter was calculated from the Biorad-EQAS.

Coefficient of variation
The CV is standard deviation (SD) expressed as a percentage and is a measure of the variability of an assay and is expressed as a percentage. CV was calculated from Biorad internal QC for the parameters.
CV = (SD/mean) × (100)
Quality goal index ratio
The quality goal index (QGI) ratio represents the relative extent to which both bias and precision meet their respective quality goals.[5] This was used to analyze the reason for the lower sigma in analytes, i.e., the problem is due to imprecision or inaccuracy or both. The QGI ratio was calculated using the following formula, QGI = Bias/1.5 × CV%.[5] The criteria used for interpreting QGI when test parameters fall short of Six Sigma quality is shown in Table 2.
Table 2.
Criteria for interpreting Quality Goal Index ratio

Results
Table 3 summarizes the CV% of level 1 IQC for 16 biochemical parameters from July 2015 to June 2016 and their average.
Table 3.
The coefficient of variation percentage of level 1 internal quality control for 16 biochemical parameters from July 2015 to June 2016 and their average
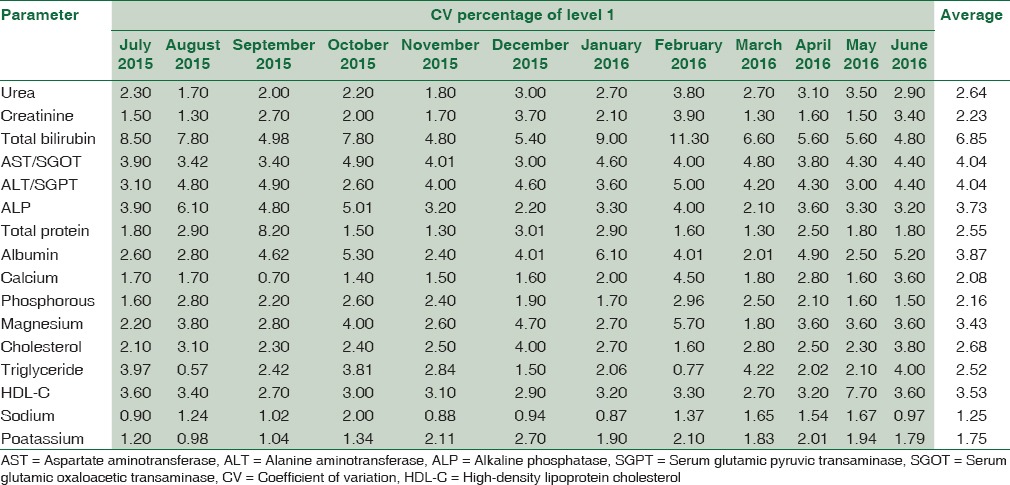
Table 4 summarizes the CV% of Level 2 IQC for 16 biochemical parameters from July 2015 to June 2016 and their average.
Table 4.
The coefficient of variation percentage of level 2 internal quality control for 16 biochemical parameters from July 2015 to June 2016 and their average
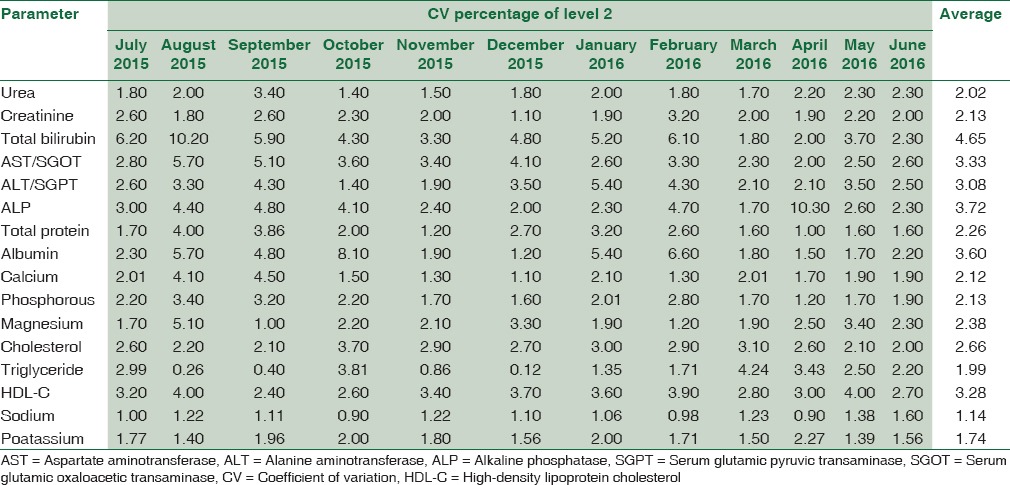
Table 5 summarizes the Bias% obtained from Bio-Rad EQAS for 16 biochemical parameters from July 2015 to June 2016 and their average.
Table 5.
The Bias percentage obtained from Bio-Rad External Quality Assurance Scheme for 16 biochemical parameters from July 2015 to 2016 and their average
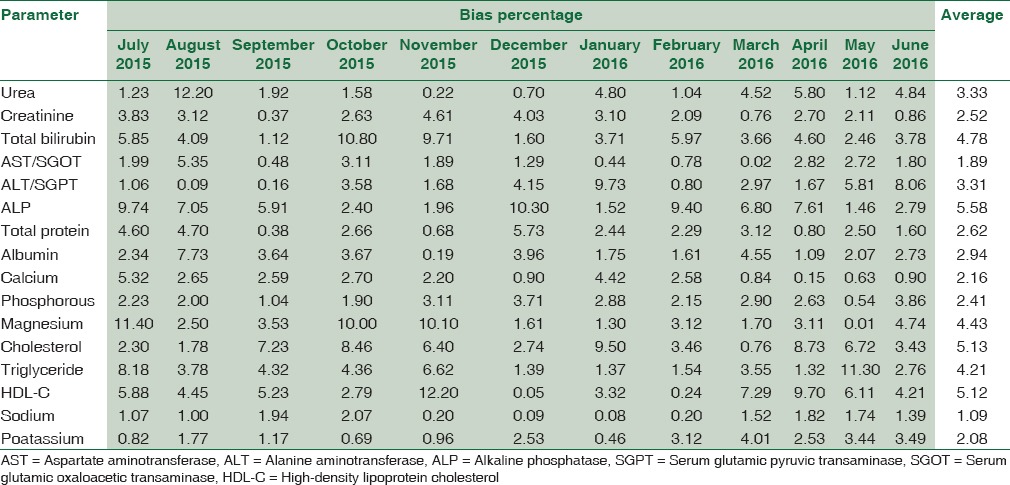
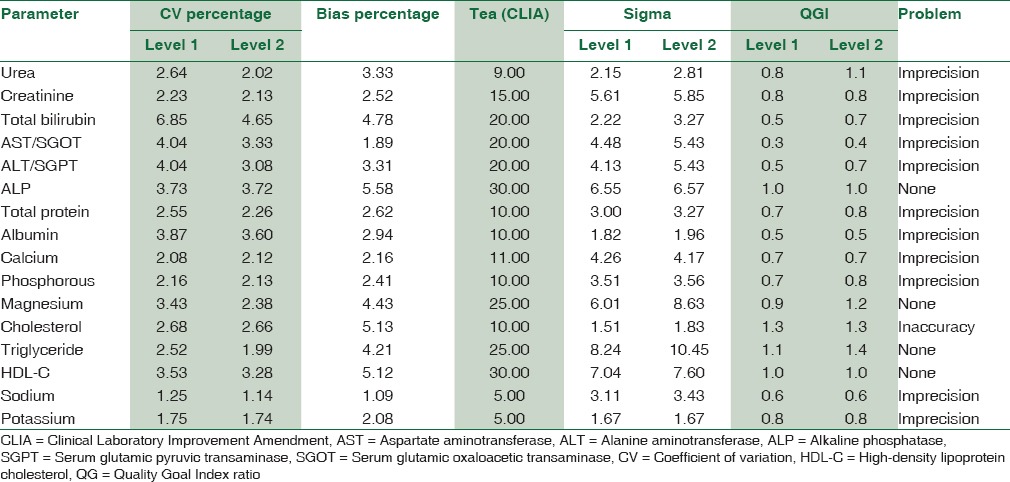
Table 6 summarizes the sigma metrics and QGI ratio analyzed from TEa (CLIA), average CV% (Level 1 and 2), and Bias%. For the level 1 IQC, four analytes (ALP, magnesium, triglyceride, and HDL-cholesterol) showed a performance of ≥6 sigma level, five analytes (urea, total bilirubin, albumin, cholesterol, and potassium) showed a poor performance of <3 sigma level and for level 2 IQCs, same four analytes of level 1 showed a performance of ≥6 sigma level, four analytes (urea, albumin, cholesterol, and potassium) showed a poor performance of <3 sigma level. For all analytes <6 sigma level, the QGI was <0.8 indicating the problem is imprecision except cholesterol whose QGI >1.2 indicating inaccuracy.
Table 6.
The sigma metrics and quality goal index ratio calculation from tea (Clinical Laboratory Improvement Amendment), average coefficient of variation percentage, and Bias percentage
Figures 1 and 2 show the normalized operational process specifications chart for level 1 and 2 CV%, respectively, showing visual inspection of world class, excellent, marginal, good, poor, and unacceptable performance of biochemical parameters.
Figure 1.
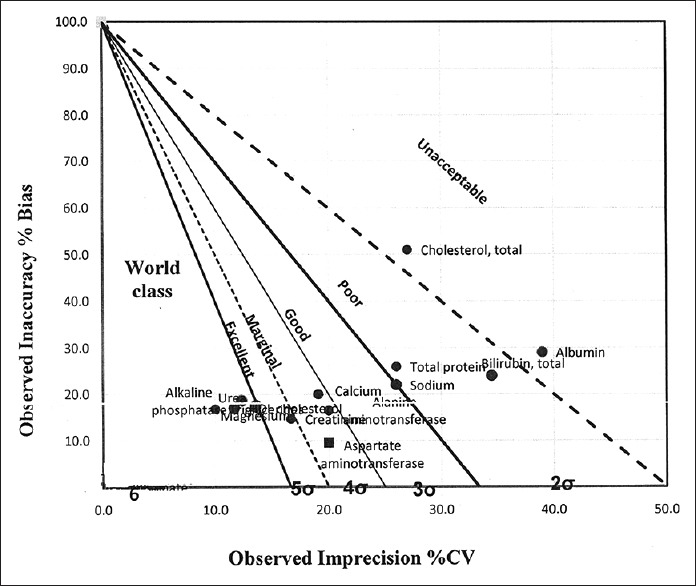
Normalized operational process specifications chart (Level 1 coefficient of variation percent)
Figure 2.
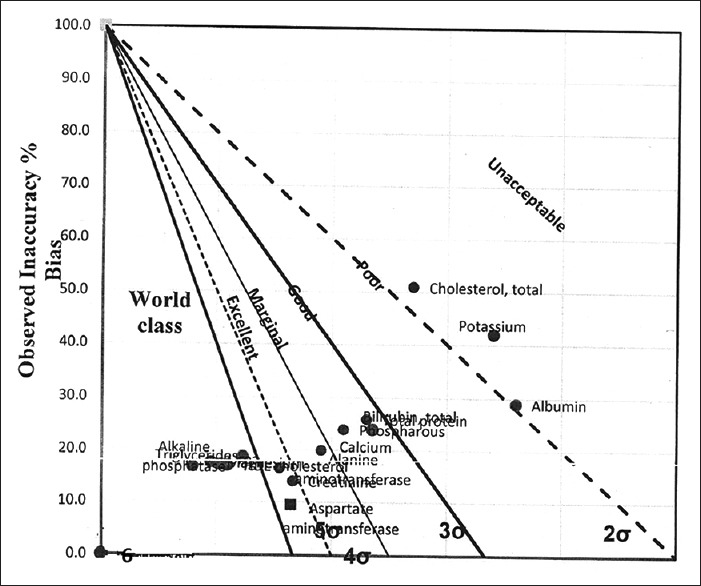
Normalized operational process specifications chart (Level 2 coefficient of variation percent)
Discussion
Most laboratories design the QC protocol for the number of times and number of levels the IQC is scheduled per day based on the guidelines of National Accreditation bodies. However, good laboratory practice (GLP) requires every individual laboratory to design a customised Individualized Quality Control Plan (IQCP) a protocol based on Sigma values obtained from Sigma metric analysis.[6] The incorporation of sigma metrics results in the reduction of laboratory errors by maintaining six standard deviations between the parameter average and its upper and lower limits.[7]
In our study, we obtained values of Six Sigma for ALP, magnesium, triglyceride, and HDL-C for both the levels of IQC. The study done by Singh et al. showed 3.2–3.4 sigma for ALP, 6.8–8.6 sigma for triglyceride, and 2.9–6.3 sigma for HDL-C.[8] For creatinine, the sigma metrics value was 5–6 sigma for both the levels of quality control in our study. However, a study by Nanda et al., 2013, the sigma value for creatinine was 3.1 and the study done by Carl Garber; the sigma value was found to be 6.[9,10] The variations in sigma values for few analytes between our study and others can be due to the difference in the methodology, Traceability calibrators used, instrument used, quality control material used, and other preanalytical and analytical conditions. For parameters such as AST and ALT, the sigma value was 4–5 sigma in level 1, but for Level-2, the sigma value was 5–6 sigma. These parameters which demonstrated a wide variation in the sigma values between both the levels of IQC should be evaluated with discretion. There is a need to strictly comply with Westgard multirules so as to abolish this discrepancy.[8] For parameters such as urea, albumin, total cholesterol, and potassium, the sigma value was found to be <3 for both levels of IQC in our study. The QGI ratio for these parameters with sigma <3 depicts the problem for urea, albumin, and potassium which could be due to imprecision (QGI <0.8), but for cholesterol, the problem could be due to inaccuracy (QGI >1.2). Hence, a very stringent IQC protocol needs to be followed, frequency of IQC should be increased, and corrective action should be taken for these parameters based on Westgard et al. 2006.[7]
A simple guideline for choosing the Westgard rules and levels of IQC processed are as follows: for the biochemical parameters with Sigma Scale 6 or above (excellent performance), evaluate with one level of QC per day (alternating levels between days) and follow 1-3 s Westgard rule alone. With Sigma Scale 4–6 (good/acceptable performance), evaluate with two levels of control once daily and follow 1-3 s, 2-2 s, R4 s Westgard multirules. With Sigma Scale 3–4 (poor performance), use two levels of controls twice daily and follow 1-3 s, 2-2 s, R4s, and 4-1 s Westgard's multirules. With Sigma Scale of <3 (problem analyte), root cause analysis should be performed; method performance must be improved before the method can be routinely used.[7]
This study shows that sigma metrics is a good quality tool to assess the analytical performance of a clinical chemistry laboratory. There are certain limitations in clinical application of sigma metrics for few analytes like hormones, for which IQC-CV% and EQAS-Bias% prove to be more reliable than sigma, provided they are within the total allowable error limits of CLIA. The next effort is to apply the sigma metrics to all phases of laboratory process and to assess their performance on a Sigma Scale.
Conclusion
On applying sigma metrics for the analytical phase in our laboratory, the world class/excellent performance was noted for ALP, magnesium, triglyceride, and HDL-C whose sigma was >6 and the problem analytes were noted to be urea, albumin, cholesterol, and magnesium with sigma value <3. On application of QGI for analytes <3 sigma, the problem is identified to be imprecision for urea, albumin, and magnesium and inaccuracy for total cholesterol. Thus, sigma metric analysis provides a benchmark for the laboratory to design a protocol for IQC, address poor assay performance, and assess the efficiency of existing laboratory process.
Financial support and sponsorship
Nil.
Conflicts of interest
There are no conflicts of interest.
References
- 1.Westgard JO. Internal quality control: Planning and implementation strategies. Ann Clin Biochem. 2003;40:593–611. doi: 10.1258/000456303770367199. [DOI] [PubMed] [Google Scholar]
- 2.Coskun A, Inal T, Unsal I, Serteser M. Six Sigma as a Quality Management Tool: Evaluation of Performance in Laboratory Medicine Quality Management and Six Sigma. InTechOpen: Rijeka, Croatia. 2010:248–61. [Google Scholar]
- 3.Angmo D, Kant S. Six sigma implementation in healthcare industry: Past, present and future. Int J Eng Res Technol. 2015;4:1078–82. [Google Scholar]
- 4.Nevalainen D, Berte L, Kraft C, Leigh E, Picaso L, Morgan T, et al. Evaluating laboratory performance on quality indicators with the six sigma scale. Arch Pathol Lab Med. 2000;124:516–9. doi: 10.5858/2000-124-0516-ELPOQI. [DOI] [PubMed] [Google Scholar]
- 5.Westgard JO, Westgard SA. An assessment of σ metrics for analytic quality using performance data from proficiency testing surveys and the CLIA criteria for acceptable performance. J Vet Diagn Invest. 2008;20:536–44. [PubMed] [Google Scholar]
- 6.Geneva: International Organization for Standardization (ISO); 2007. International Organization for Standardization. Medical Laboratories – Particular Requirements for Quality and Competence. ISO 15189. [Google Scholar]
- 7.Westgard JO. Six Sigma Quality Design and Control. 2nd ed. Madison, WI: Westgard QC Inc; 2006. [Google Scholar]
- 8.Singh B, Goswami B, Gupta VK, Chawla R, Mallika V. Application of sigma metrics for the assessment of quality assurance in clinical biochemistry laboratory in India: A Pilot study. Indian J Clin Biochem. 2011;26:131–5. doi: 10.1007/s12291-010-0083-1. [DOI] [PMC free article] [PubMed] [Google Scholar]
- 9.Nanda SK, Ray L. Quantitative application of sigma metrics in medical biochemistry. J Clin Diagn Res. 2013;7:2689–91. doi: 10.7860/JCDR/2013/7292.3700. [DOI] [PMC free article] [PubMed] [Google Scholar]
- 10.Garber C. Six sigma, its role in the clinical laboratory, from basic to advanced series. Clin Lab News. 2004:10–4. [Google Scholar]


