

Abstract
The environmental contaminant 2,3,7,8-tetrachlorodibenzo-p-dioxin (TCDD) induces hepatic steatosis mediated by the aryl hydrocarbon receptor. To further characterize TCDD-elicited hepatic lipid accumulation, mice were gavaged with TCDD every 4 days for 28 days. Liver samples were examined using untargeted lipidomics with structural confirmation of lipid species by targeted high-resolution MS/MS, and data were integrated with complementary RNA-Seq analyses. Approximately 936 unique spectral features were detected, of which 379 were confirmed as unique lipid species. Both male and female samples exhibited similar qualitative changes (lipid species) but differed in quantitative changes. A shift to higher mass lipid species was observed, indicative of increased free fatty acid (FFA) packaging. For example, of the 13 lipid classes examined, triglycerides increased from 46 to 48% of total lipids to 68−83% in TCDD treated animals. Hepatic cholesterol esters increased 11.3-fold in male mice with moieties consisting largely of dietary fatty acids (FAs) (i.e., linolenate, palmitate, and oleate). Phosphatidylserines, phosphatidylethanolamines, phosphatidic acids, and cardiolipins decreased 4.1-, 5.0-, 5.4- and 7.4-fold, respectively, while ceramides increased 6.6-fold. Accordingly, the integration of lipidomic data with differential gene expression associated with lipid metabolism suggests that in addition to the repression of de novo fatty acid synthesis and β-oxidation, TCDD also increased hepatic uptake and packaging of lipids, while inhibiting VLDL secretion, consistent with hepatic fat accumulation and the progression to steatohepatitis with fibrosis.
Graphical abstract

INTRODUCTION
Exposure to 2,3,7,8-tetrachlorodibenzo-p-dioxin (TCDD) and related compounds has been linked to metabolic disorders such as nonalcoholic fatty liver disease (NAFLD) in humans and rodent models.1−5 In mice, a single bolus dose of TCDD induces the reversible accumulation of lipids in the liver, while continuous treatment promotes progression to steatohepatitis (steatosis and inflammation) with fibrosis.3,6,7 These responses are mediated by the aryl hydrocarbon receptor (AhR) which, upon activation, dissociates from chaperone proteins, translocates to the nucleus, and dimerizes with the AhR nuclear translocator (ARNT).4 The AhR-ARNT heterodimer then binds to dioxin response elements (DREs) and elicits changes in gene expression. In mice, AhR-mediated differential expression has consistently included genes associated with lipid transport, processing, and metabolism.5,8−10
NAFLD describes a spectrum of hepatic disorders ranging from steatosis to fibrosis. Triglyceride (TG) accumulation initially serves a protective role against lipotoxicity caused by free fatty acids (FFAs). However, hepatic and/or serum lipid analyses in humans and rodents also implicate other changes associated with NAFLD development and progression to more complex metabolic disorders including type II diabetes (T2D) and metabolic syndrome (MetS).11,12 For example, ceramides promote oxidative stress and inflammation which contribute to T2D and MetS development.13 TCDD induces hepatic lipid accumulation, mediated at least in part by the induction of the lipid transporter CD36,10,14 and characterized by increased dietary mono- and polyunsaturated fatty acid levels.15,16 Although previous studies suggest hepatic lipid composition is altered by TCDD,15−18 few have examined changes across lipid classes including effects on cholesterol esters and phospholipids.
In the presented study, we qualitatively and quantitatively examined AhR-mediated hepatic lipid changes using an untargeted lipidomic approach. Lipid changes were evaluated in liver samples from male and female mice from our previous studies which facilitated the integration of available phenotypic, RNA-Seq, and ChIP-Seq data19−21 to further elucidate pathways involved in TCDD-elicited steatohepatitis with fibrosis. Although male and female hepatic lipid species were qualitatively similar, quantitative increases were greater in male mice. In addition to hepatic TG accumulation, alterations in cholesterol, cholesterol esters (CEs), phospholipids, ceramides (CERs), and cardiolipins (CLs) were found, indicative of impaired hepatic function and disease progression. Collectively, the integration of lipidomic, mRNA-Seq, and ChIP-Seq data are consistent with the AhR-mediated gene expression changes associated with hepatic fat accumulation and packaging, and reduced de novo lipid biosynthesis and export.
EXPERIMENTAL PROCEDURES
Animal Treatment
Postnatal day 25 (PND25) male and female C57BL/6 mice (Charles River Laboratories, Portage, MI) were housed and treated as previously described.19,21 Briefly, female mice were housed in polycarbonate cages with cellulose fiber chips (Aspen Chip Laboratory Bedding, Warrensberg, NY), and male mice were housed in Innovive cages (Innovive inc., San Diego, CA) with ALPHA-dri (Shepherd Specialty Papers, Chicago, IL) bedding at 30−40% humidity and a 12 h light/dark cycle were fed ad libitum (Harlan Teklad 22/5 Rodent Diet 8940, Madison, WI) with free access to water. Housing conditions between sexes differ due to changes within the animal care facilities at Michigan State University. No significant differences in TCDD-elicited responses due to these changes have been observed. On PND 28 and every following fourth day, animals (N = 5) were orally gavaged with 0.1 mL of sesame oil or 0.01, 0.03, 0.1, 0.3, 1, 3, 10, and 30 μg/kg TCDD (Dow Chemical Company, Midland, MI) for a total of 28 days (d). Doses for this study were selected to cover the range of TCDD levels reported in human serum and tissues.3 Four days following the final dose (PND 56), mice were sacrificed by cervical dislocation. Liver samples were collected and immediately frozen in liquid nitrogen, while the epithelium of the jejunum was collected directly into TRIzol (Invitrogen, Carlsbad, CA) following flushing of the intestine with Ca2+/Mg2+-free phosphate buffered saline (PBS; Sigma-Aldrich). Collected tissues were stored at −80 °C until analysis. All procedures were approved by the All-University Committee on Animal Use and Care.
Lipid Extraction
Monophasic lipid extraction in methanol/chloroform/water (2:1:0.74) was performed using 5 mg of frozen liver tissue from the sesame oil vehicle or 30 μg/kg TCDD treated animals as previously described.22 Prior to extraction, each homogenate was spiked with synthetic phosphatidylcholine (PC; 14:0/14:0), phosphatidylethanolamine (PE; 14:0/14:0), and phosphatidylserine (PS; 14:0/14:0) obtained from Avanti Polar Lipids (Alabaster, AL) at 1 nmol/mg tissue as internal standards for relative lipid quantitation. Dried extracts were washed three times with 10 mM ammonium bicarbonate, dried under vacuum, and resuspended in isopropanol/methanol/chloroform (4:2:1, v:v:v) using 100 μL/mg tissue extracted.
Derivatization of Aminophospholipids and Plasmalogen-Containing Lipids
For positive ionization mode analysis, extracts were subjected to sequential functional group selective modification of (i) amine-containing PE and PS lipids using 13C1-S,S′-dimethylthiobutanoylhydroxysuccinimide ester (13C1-DMBNHS) and (ii) the O-alkenyl-ether double bond of plasmalogen lipids using iodine and methanol, as previously described.23 Derivatized lipids were dried under nitrogen and washed twice with 10 mM ammonium bicarbonate. Reconstituted derivatized lipid sample (40 μL) was transferred to a Whatman multichem 96-well plate (Sigma-Aldrich, St. Louis, MO) and evaporated under nitrogen. Immediately prior to analysis, lipid extracts were resuspended in isopropanol/methanol/chloroform (4:2:1 v/v/v) containing 20 mM ammonium formate and sealed with Teflon Ultrathin Sealing Tape (Analytical Sales and Services, Pompton Plains, NJ). For comparative analysis, samples were diluted to ensure lipid concentrations were approximately equal and within the linear range of the detector response.22
High Resolution/Accurate Mass Spectrometry and Tandem Mass Spectrometry
High resolution/accurate mass-tandem mass spectrometry was used for confirmation of untargeted lipidomic identification. For TG lipids, only the top 50 most abundant species were subjected to MS/MS verification. Lipid samples (10 μL) were aspirated and directly infused at approximately 250 nL/min by nanoelectrospray ionization (nESI) into a high resolution/accurate mass Thermo Scientific model LTQ Orbitrap Velos mass spectrometer (San Jose, CA) using an Advion Triversa Nanomate nESI source (Advion, Ithaca, NY) with a spray voltage of 1.4 kV and a gas pressure of 0.3 psi. High resolution spectra were acquired in positive ionization mode from derivatized lipid extracts and in negative ionization mode from nonderivatized lipid extracts, using the FT analyzer operating at 100,000 mass resolving power. Each spectrum was signal averaged for 2 min over the range of 200−2000 m/z. Higher-Energy Collision Induced Dissociation (HCD-MS/MS) product ion spectra were acquired in positive and negative ionization modes to confirm lipid headgroups and acyl chain compositions of selected ions of interest using the FT analyzer operating at 100,000 mass resolving power and default activation times.
Peak Finding, Lipid Identification, and Quantification
Lipids were identified using the Lipid Mass Spectrum Analysis (LIMSA) v.1.0 software linear fit algorithm, in conjunction with a user-defined database (Table S1) of hypothetical lipids for automated peak finding and 13C isotope effect correction. Relative quantification of abundance between samples was performed by normalization of target ion peak areas to the PS(14:0/14:0) internal standard. Because of the lack of available standards for each lipid species analyzed, no attempts were made to quantitatively correct for different ESI responses of lipid classes or individual species due to concentration, acyl chain length, or degree of unsaturation. The reported normalized abundances of lipid molecular species are not intended to represent absolute concentrations. Individual data for confirmed lipid species are provided in Table S2.
Gene Expression and AhR Binding Analyses
Untargeted lipidomic data were integrated with published hepatic RNA-Seq and AhR ChIP-Seq data19,20 available in the Gene Expression Omnibus (GEO) repository (GSE62902, GSE87519) and are MINSEQE compliant (http://fged.org/projects/minseqe/). Lipidomic and RNA-Seq data were obtained from liver samples taken from the same animals. Jejunal epithelium RNA-sequencing was performed as previously described and is MINSEQE compliant and deposited in GEO (GSE87519). Jejunal epithelial samples were also obtained from the same animals as the liver samples. Briefly, total RNA was isolated using TRIzol according to the manufacturer’s instructions with an additional phenol/chloroform extraction. Total RNA was subjected to DNase treatment prior to library preparation using the Ovation Mouse RNA-Seq System (NuGen, San Carlos, CA) and then sequenced on a HiSeq2500 (Illumina, San Diego, CA) at a depth of ∼30M, performed at the Michigan State University Research Technology Support Facility Genomics Core (rtsf.natsci.msu.edu/genomics). Trimmomatic v0.3224 was used to trim adaptor sequences, and FastQC v0.11.2 (www.bioinformatics.babraham.ac.uk/projects/fastqc/) was used for quality control. Sequences were mapped to the mouse reference genome (GRCm38 release 81) using Bowtie2 v2.2.3 and TopHat2 v2.0.12.25 Counting of aligned reads was performed using HTSeq v0.6.126 in intersection-nonempty mode (-m intersection-nonempty). The counts were transformed using variance stabilizing transformation (VST) from the DESeq package.27 Published microarray data for female jejunal epithelium (GSE70379)28 was used for comparison to male differential gene expression. Male and female data were analyzed independently by normalization using a semiparametric approach, and analyzed using an empirical Bayes method which calculates a posterior probability (P1(t)) value on a per gene and dose basis as previously described.19,29,30 All genes presented are described using their official gene symbol with full gene names defined by https://www.ncbi.nlm.nih.gov/gene. ChIP-Seq and putative DREs (pDREs) data are included in heat maps to assess the role of the AhR, and distinguish DRE-dependent and -independent responses, as well as potential secondary responses.
Statistics
Statistical analyses used R version 3.2.5 (R Foundation for Statistical Computing) and the mixOmics and RVAideMemoire packages. Significance (P ≤ 0.05) was determined using a one-way ANOVA followed by Student−Newman−Keuls posthoc test.
RESULTS
Alterations in the Hepatic Lipidome
Histological evaluation of livers demonstrate that repeated TCDD exposure results in hepatic vacuolization (accumulation of lipid droplets), immune cell infiltration, collagen deposition, and bile duct proliferation (Figure 1) consistent with others reports of TCDD-elicited hepatotoxicities in mice.4,8,10,20,31−34 Notably, hepatic lipid accumulation was observed in male mice at doses ≥0.3 μg/kg TCDD, inflammation at doses ≥3 μg/kg TCDD, and collagen deposition and bile duct proliferation at dose ≥30 μg/kg TCDD. Female mice were found to exhibit hepatic lipid accumulation at doses ≥10 μg/kg TCDD and all other features at doses ≥30 μg/kg TCDD with reduced severity compared to males.35 To further characterize the hepatic lipid accumulation, untargeted metabolomic analyses were performed using extracts from male and female mice gavaged every 4d for 28d. A total of 936 spectral features (unique m/z signals) were detected based on Orbitrap accurate mass measurements, 379 of which were structurally confirmed as unique lipid species through targeted high resolution MS/MS verification (Figure 2A). Evaluation of lipid mass (m/z) indicated a shift to higher molecular weight species in TCDD-treated samples (Figure 2B,C). Moreover, total MS ion abundance corresponding to confirmed lipid species normalized to tissue weight increased 2.0-fold in both sexes, indicative of lipid accumulation.
Figure 1.

Representative photomicrographs from livers of female and male mice gavaged with sesame oil vehicle control or TCDD every 4 days for 28 days. Livers were stained with hematoxylin and eosin (H&E) to survey hepatic lesions. Scale bar represents 100 μm, portal veins are denoted by the letter v and bile ducts with the letter b. Solid black arrows indicate regions of inflammation, vacuolization (fatty change) is indicated by a black dashed arrow, and the yellow solid arrow shows collagen deposition.
Figure 2.

Lipidomic characterization of liver extracts from male and female mice gavaged with sesame oil vehicle control or 30 μg/kg TCDD every 4 days for 28 days. (A) Livers collected from animals were initially analyzed by an untargeted analysis approach with identified species confirmation by high-resolution MS/MS. Distribution of lipid species (unique m/z) was determined in (B) males and (C) females. Pareto plots show the total lipid signal (maximum left y-axis value) and percent composition (right y-axis and dotted line) for individual lipid classes (ranked from most abundant to least) in (D) male and (E) female samples.
Confirmed species included TGs, FFAs, cholesterol esters (CE), cardiolipins (CL), diacylglycerols (DG), phosphatidylglycerols (PG), phosphatidic acids (PA), phosphatidylcholines (PC), phosphatidylethanolamines (PE), phosphatidylinositols (PI), phosphatidylserines (PS), sphingomyelin (SM), and ceramides (CER). In control males, TGs (47−48%) represented the most abundant species, followed by FFAs (22−31%), PCs (11−17%), and PEs (8−9%) (Figure 2D,E). TCDD altered the lipid rank order with TGs increasing to 83%, followed by PCs (7.9%), FFAs (4.4%), and CEs (2.6%) in male mice (Figure 2D). In females, total lipid levels were less when compared to accumulation in males, while the rank order was unchanged (Figure 2E). Partial least-squares determinant analysis (PLS-DA) distinguished vehicle and TCDD-treated samples (Figure 3A,B) with separation driven by increases in TGs, DGs, and two PCs in male mice (PC34:1 ether and PC36:1; Figure 3C,D). In fact, the top ranked lipid species based on their variable importance in projection (VIP) score in males included 17 TGs with acyl moieties containing 52−56 total carbons (sum of 3 acyl groups). Although difficult to distinguish specific acyl chain composition of TG species using our lipidomic method, palmitic acid (16:0), oleic acid (18:1), and linoleic acid (18:2) were the most common moieties detected within TGs by high resolution MS/MS and represent the most abundant FFAs in rodent chow.16 Qualitatively, responses were largely conserved between the sexes, while males showed larger quantitative changes. In the following sections, male data will be presented unless stated otherwise due to the qualitative similarities and more pronounced quantitative responses.
Figure 3.

Partial least-squares determinant analysis (PLS-DA) of lipidomic profiles from (A) male and (B) female liver extracts of mice gavaged with sesame oil vehicle control or 30 μg/kg TCDD every 4 days for 28 days. Variable importance in projection (VIP) scores of individual lipid species are shown with their respective fold-change for (C) male and (D) female samples.
Effects on FFA Packaging and Hydrolysis
FFA accumulation has the potential to disrupt membrane integrity and fluidity and alter cellular acid−base homeostasis, as well as serve as substrates for bioactive lipids. They can also generate reactive oxygen species (ROS) that compromised cellular function and energy production, as well as induce cell death and inflammation.36−38 Channeling excess FFAs to TGs is not only important for energy storage but also confers protection from lipotoxicity as demonstrated in mice unable to synthesize TGs.38−40 TCDD increased hepatic TG content 3.0-fold from 46% of lipids in controls to 84% in TCDD-treated male mice (Figures 2D,E and 3).
Hepatic TG synthesis using the glycerol-3-phosphate (G3P) pathway involves G3P acylation with a fatty acyl-CoA by Gpam or Agpat producing lysophosphatidic acid (LPA), followed sequentially by a second acylation by LPA acyltransferases (Agpat) at the sn-2 position (Figure 4B, boxes 2 and 3). Dephosphorylation by phosphatidate phosphatase (Lpin) yields DG (Figure 4B, box 5). Diacylglycerol O-acyltransferases (Dgat) catalyzes the formation of TGs from DGs and a fatty acyl-CoA (Figure 4B, box 6). In TCDD treated mice, Agpat1, 4, and 9, which catalyze these acylation reactions, were dose-dependently induced 1.7-, 2.1-, and 5.2-fold, respectively, while Agpat2 and 6 exhibited dose-dependent repression (12.2-, and 2.4-fold, respectively) (Figure 4A, boxes 3 and 4). Moreover, Lpin2 and 3 were induced 2.2- and 3.4-fold suggesting increased TG synthesis (Figure 4A, box 5). Dgat2, however, which is implicated in steatosis development in diabetic (db/db) mice fed a methionine choline deficient (MCD) diet,38 was repressed 5.6-fold (Figure 4A, box 6). Similarly, monoacylglycerol O-acyltransferase (Mogat1 and Mogat2) which producees DG from monoacylglycerol (MG) and a fatty acyl-CoA exhibited an inverted U-shaped dose−response, suggesting feedback inhibition following TG accumulation (Figure 4B, box 8). Accordingly, hepatic DGs, which are lipotoxic, were also increased 3.2-fold by TCDD, while MGs were not detected (Figures 2 and 4B).
Figure 4.

Overview of free fatty acid uptake and triglyceride breakdown and biosynthesis in the liver. (A) Functions in the heat map associated with differentially expressed genes represented: (0) glycerol biosynthesis, (1) FA uptake, (2) extracellular and intracellular lipolysis, (3) glycerol-3-phosphate acyltransferase, (4) acylglycerol-3-phosphate acyltransferase, (5 and −5) phosphatase and kinase, (6) diacyltriglycerol acyltransferase, (7) monoglyceride lipase, and (8) monoacylglycerol acyltransferase. (B) Differentially expressed genes and changes in lipid species levels were integrated in the pathway overview. The color scale represents the log2(fold-change) for genes and metabolites in all figure panels. Gray indicates metabolites not measured or detected. Genes are identified as rectangles and metabolites as circles. Functional gene characterization, level of expression, effect of treatment (i.e., induced or repressed) on gene expression, P1(t) values for gene expression/metabolite changes, and effect of treatment on substrate/metabolite levels (i.e., induced or repressed) were all taken into consideration where possible to determine what color to fill a step (box). Split red/blue boxes were used when there was no clear indication of which gene was the principal contributor to the denoted overall activity at that step. The presence of pDREs (DRE; MSS ≥ 0.89) and AhR enrichment peaks (FDR ≤ 0.05) was determined by ChIP-Seq20 and shown as green boxes. Counts represent the maximum raw number of aligned reads to each transcript across doses indicating the potential level of hepatic expression, where yellow represents a low level of expression (≤500 reads), and pink represents a higher level of expression (≥10,000).
TG hydrolysis counterbalances their accumulation (Figure 4B, box 2). Adipose triglyceride lipase (Pnpla2 aka ATGL), hormone sensitive lipase (Lipe aka HSL), and monoglyceride lipase (Mgll), catalyze the sequential hydrolysis of intracellular TG to DG and MG, and finally, glycerol and FFAs (Figure 4B, boxes 2 and 7). In TCDD-treated mouse liver samples, Pnpla2, Lipe, and Mgll were induced 3.9-, repressed 2.4-, and induced 2.3-fold, respectively, in a largely dose-dependent manner. However, the Pnpla2 coactivators Abhd5 (CGI-58) and Serpinf1 (PEDF) were repressed 1.5- (males only) and 14.3-fold, respectively. Similarly, the Pnpla2 inhibitor G0s2 was also repressed 3.6-fold. Despite the differential expression of Pnpla2, Abhd5, Serpinf1, and G0s2, ATGL is extensively regulated posttranslationally, and therefore, mRNA levels may not be an accurate indication of enzyme activity.37 Hepatic TGs, DGs, and MGs can also be hydrolyzed by highly expressed endoplasmic reticulum-associated carboxylesterases (Ces) and arylacetamide deacetylase (Aada), or in lysosomes by lysosomal acid lipase (Lipa).41 Ces isoforms, Ces1c, Ces1d, Ces1e, Ces1g, and Ces2a, Ces2e, Ces3a, Ces3b, and Ces4a, as well as Aadac and Lipa were all repressed (3.4-, 31.7-, 21.9-, 6.1-, 39.7-, 3.2-, 3062-, 1176-, 11.7-, 25-, and 1.9-fold, respectively) by TCDD with several Ces isoforms following inverted U shaped dose− responses (Ces2c, Ces1b, Ces2h, and Ces2b). Notably, Lipa deficient mice develop lipid storage diseases (Wolman disease or CE storage disease), characterized by hepatic TG and CE accumulation.42
Inhibition of Cholesterol Biosynthesis
Hepatic CE levels which increased 11.3-fold in male mice and 5.6-fold in females (Figure 2D,E) showed the largest lipid class increase relative to controls. Hepatic cholesterol levels were also increased 9-fold in male mice but not detected in female mice in untargeted lipidomic analysis (not confirmed by high resolution MS/MS). Hepatic cholesterol levels were also reported to be higher in female mice in NMR lipidomic studies.18 Nine cholesterol ester species were increased including 16:0, 16:1, 18:1, 18:2, 18:3, and 20:3 (11.5-, 5.6-, 14.8-, 10.1-, 8.3-, and 20.7-fold, respectively), while 20:2 increased from undetected to detected (Figure 5). The essential dietary FFAs, linoleic (18:2) and α-linolenic (18:3) acid, as well as palmitic (16:0) and oleic acid (18:1), the predominant FFAs in the diet, have previously been shown to increase in the liver following TCDD treatment.16 Elovl2, Elovl3, Elovl5, and Elovl7 were dose-dependently repressed 11.9-, 736.3-, 3.4-, and 1.8-fold, respectively, as were Fads1, 2, 3, 6, and Scd1 and 3 (26.7-, 20.5-, 2.2-, 1.5-, 20.2-, and 2.2-fold, respectively), which are considered to be transcriptionally regulated,43 consistent with the accumulation of exogenous lipids from dietary and/or mobilized peripheral fat depots. Only Elovl7 (27.9-fold), associated with C20:0, C22:0, and C24:0 production as well as Scd2 (5.1-fold) responsible for monounsaturated species, was dose-dependently induced.43
Figure 5.
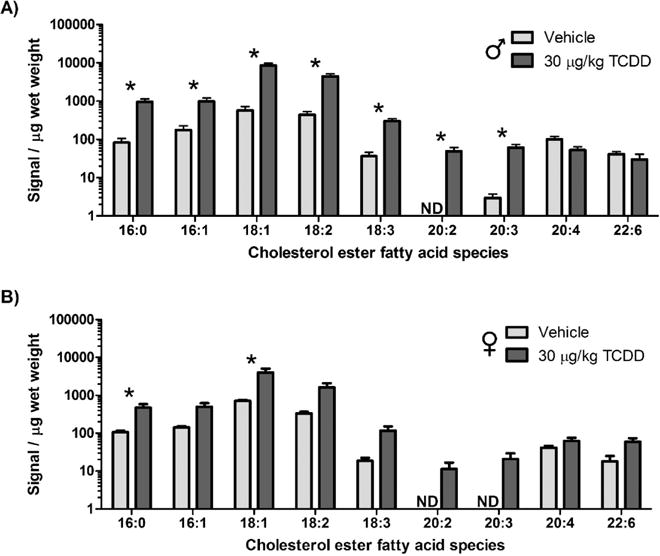
Cholesterol ester species in liver extracts of (A) male and (B) female mice gavaged with sesame oil vehicle control or 30 μg/kg TCDD every 4 days for 28 days. Bars represent the mean ± SEM for 5 animals (N = 5). Asterisks (*) indicate a significant difference (P ≤ 0.05) compared to that of the vehicle control determined by one-way ANOVA followed by Student−Newman−Keuls posthoc test. ND indicates that the lipid species was not detected.
Although cholesterol (not confirmed by high resolution MS/MS) and CE levels were increased by TCDD, gene expression associated with the cholesterol biosynthesis pathway was largely repressed at 30 μk/kg TCDD including Hmgcs2, Idi1, Cyp51, Fdft1, and Sqle (1.5-, 7.5-, 5.8-, 4.0-, and 4.3-fold, respectively) (Figure 6A, box 3). In male mice, most of these genes showed increased expression at lower doses, while the rate-limiting step Hmgcr was induced at all doses suggesting potential feedback inhibition. In agreement, Srebf 2, which promotes de novo cholesterol biosynthesis, was repressed 2.7-fold. Conversely, in female mice cholesterol biosynthesis gene expression was repressed at all doses including the rate limiting Hmgcr step, while Srebf 2 expression was unchanged. Interestingly, Hmgcr exhibited ChIP-Seq AhR enrichment in the absence of DREs in both male and female mice.
Figure 6.

Overview of cholesterol uptake, biosynthesis, and esterification in the liver and jejunal epithelial cells. Pathways (A) and heat map of gene expression (B) were categorized based on the following function or pathway: (1 and 5) Uptake of cholesterol and cholesterol esters, (2 and 6) cholesterol acyltransferase, (3 and 4) cholesterol biosynthesis and regulation, (7) cholesterol export, and (8) chylomicron packaging. Altered lipid species were integrated in the pathway overview. Published microarray data for the female jejunal epithelium28 was used for comparison to male differential gene expression. The color scale represents the log2(fold-change) for genes and metabolites in all figure panels. Gray indicates genes of metabolites not measured or detected. Genes are identified as rectangles and metabolites as circles. Functional gene characterization, level of expression, effect of treatment (i.e., induced or repressed) on gene expression, P1(t) values for gene expression/metabolite change, and effect of treatment on substrate/metabolite levels (i.e., induced or repressed) were all taken into consideration where possible to determine what color to fill a step (box). Split red/blue boxes were used when there was no clear indication of which gene was the principal contributor to the denoted overall activity at that step. The presence of pDREs (DRE; MSS ≥ 0.89) and AhR enrichment peaks (FDR ≤ 0.05) determined by ChIP-Seq are shown as green boxes.20 Counts represent the maximum raw number of aligned reads to each transcript across doses indicating the potential level of hepatic expression, where yellow represents a low level of expression (≤500 reads), and pink represents a higher level of expression (≥10,000).
Hepatic CEs are synthesized following the endocytosis of lipoproteins through the esterification of dietary or imported cholesterols. Intracellular cholesterol esterification is catalyzed by sterol-O-acyltransferases Soat1 and 2 (Figure 6A, box 2), which are not to be confused with genes whose official symbols are Acat1 and 2 (ACAT1 and 2). Soat1 and 2 use acyl-CoA as a substrate and store CEs in intracellular lipid droplets or package them into lipoproteins for export.44,45 Similar to TGs, this strategy minimizes cytotoxicity associated with cholesterol accumulation.46 Soat1 and 2 were induced 3.6-fold and repressed 2.0-fold, respectively (Figure 6B). Although Soat1 was induced, it is not believed to play a significant role in hepatic CE synthesis, whereas Soat2 repression suggests hepatic CE accumulation is primarily due to lipoprotein endocytosis.44,45,47 Lecithin-cholesterol acyltransferase (Lcat) which uses lecithin as substrate for cholesterol esterification destined for LDL was repressed 2.5-fold suggesting that LDL cholesterol esterification prior to hepatic uptake is not increased but rather taken up as premade CE from peripheral sources. In the liver, HSL (Lipe) and Lipa catalyze CE and retinyl ester hydrolysis but were repressed 2.3- and 1.9-fold, respectively, which may further add to CE accumulation.37,42
Phospholipid Metabolism Disruption
Phospholipids represent one of the most abundant lipid classes with important roles in membrane structure, transport, and signaling.48 PEs and PSs were reduced 5.0- and 4.1-fold, respectively, by TCDD. PA, a precursor for phospholipid biosynthesis was also reduced 5.8-fold, while PIs and PCs were modestly increased 2.4- and 1.6-fold, respectively, albeit not reaching statistical significance (Figure 7). CERs, another key membrane constituent, were also increased 6.9-fold, while CLs were reduced 7.4-fold.
Figure 7.

Changes in phospholipid total signal and percent of total lipid signal in liver extracts of (A) male and (B) female mice gavaged with sesame oil vehicle control or 30 μg/kg TCDD every 4 days for 28 days. Bars represent the mean ± SEM for 5 animals (N = 5). Asterisks (*) indicate a significant difference (P ≤ 0.05) compared to the vehicle control determined by one-way ANOVA followed by Student−Newman−Keuls posthoc test.
Hepatic PC can be synthesized via the CDP-choline pathway (Kennedy pathway) or phosphatidylethanolamine methyltransferase (PEMT) pathway (Figure 8A). In the CDP-choline pathway, choline is imported and phosphorylated to phosphocholine by choline kinase alpha (Chka), which is used as a substrate for phosphate cytidyltransferase (Pcyt1a), producing CDP-choline (Figure 8A, boxes 4 and 5). CDP-choline and 1,2-DAG are then combined to generate PC by choline phosphotransferase (Chpt1) (Figure 8A, box 6). Despite the 5.1- and 3.3-fold repression of Chka and Chpt1, respectively, PC levels were unchanged in male mice (Figure 8). Although choline kinase activity is reported to be a primary AhR-mediated response in rat liver, TCDD did not induce activity in mouse Hepa1c1c7 cells.49 Conversely, a 1.7-fold repression of Chpt1 in female mice was associated with reduced PC levels (as a percentage of total lipids) (Figure 8C). In the PEMT pathway, PE undergoes three methylation reactions, using S-adenosyl methionine (SAM) as a cofactor, catalyzed by Pemt which was repressed 3.7-fold with ChIP-Seq AhR enrichment (Figure 8A, box 7). Varying fatty acyl chain profiles of these substrates (1,2-DAG vs PE) results in pathway-dependent PC composition with the CDP-choline pathway producing more mono- and diunsaturated species and the PEMT pathway producing polyunsaturated species, particularly docosahexaenoic (DHA; 22:6n3) species.50,51 Overall, most genes involved in the CDP-choline and PEMT pathways were repressed. Nonetheless, TCDD modestly increased mono-, di-, and poly unsaturated PC species (Figure 9A,B), suggesting continued biosynthesis using both pathways. However, DHA phosphatidylcholine species were not detected.
Figure 8.

Overview of hepatic (A) phospholipid and (B) phospholipid related species metabolism. Differentially expressed genes are represented in the heat map (C) and categorized based on the following function or pathway: (1 and 4) kinase, (2 and 5) phosphate cytidyltransferase, (3 and 6) phosphotransferase, (7) methyltransferase, (8 and 9) PS synthase, (10) PS decarboxylase, (11) CDP-DG synthase, (12) phospholipase, (13) cardiolipin synthesis, (14) acyltransferase, (15) CDP-DG inositol 3-phosphatidyltransferase, (16) ceramide biosynthesis, and (17) sphingomyelin synthesis. Altered lipid species were integrated into the pathway overview. The color scale represents the log2(fold-change) for genes and metabolites in all figure panels. Gray indicates metabolites or genes not measured or detected. Genes are identified as rectangles and metabolites as circles. Functional gene characterization, level of expression, effect of treatment (i.e., induced or repressed) on gene expression, P1(t) values for gene expression/metabolite change, and effect of treatment on substrate/metabolite levels (i.e., induced or repressed) were all taken into consideration where possible to determine what color to fill a step (box). Split red/blue boxes were used when there was no clear indication of which gene was the principal contributor to the denoted overall activity at that step. The presence of pDREs (DRE; MSS ≥ 0.89) and AhR enrichment peaks (FDR ≤ 0.05) determined by ChIP-Seq20 are shown as green boxes. Counts represent the maximum raw number of aligned reads to each transcript across doses indicating the potential level of hepatic expression, where yellow represents a low level of expression (≤500 reads) and pink represents a higher level of expression (≥10,000).
Figure 9.

Changes in the total number of double bonds (A) and carbons (B) within acyl groups of lipid classes in male or (C,D) female liver extracts from mice gavaged with 30 μg/kg TCDD every 4 days for 28 days. Fold-changes represent the difference in total signal normalized to tissue weight except in cases where the signal went from undetected to detected, and the maximum value was used. Gray indicates that the lipid species was not detected. The numbers represent the sum for all acyl groups (e.g., all three acyl chains within a triglyceride).
Similarly, PSs and PEs are also generated by two pathways.48 PSs are synthesized by Ptdss1 using PCs as substrates, while Ptdss2 use PEs (Figure 8A, boxes 8 and 9). TCDD repressed Ptdss1 1.6-fold with ChIP-Seq AhR enrichment within its genomic region, while Ptdss2 was unchanged. PE biosynthesis, on the other hand, mirrors the CDP-choline pathway for PC biosynthesis. Ethanolamine kinase (Etnk1 or 2) produces phosphoethanolamine, a substrate for phosphotransferase (Pcyt2) which then produces CDP-ethanolamine followed by the generation of PE using 1,2-DAG by ethanolaminephosphotransferase 1 (Ept1) (Figure 8A, boxes 1−3). TCDD induced Etnk1 1.7-fold but repressed Pcyt2 and Ept1 5.9- and 2.0- fold, respectively (Figure 8C). Alternatively, PS decarboxylase (Pisd) produces PE from PS in the inner mitochondrial membrane. Psid expression was unchanged by TCDD (Figure 8A, boxes 10). Although levels of PS were reduced, di- and triunsaturated species increased similarly to PC species.
CDP-DAG in mammalian cells provides the substrate for PI and CL synthesis (Figure 8B). The PI synthase, Cdipt, which uses CDP-DAG to produce PI (increased 1.6-fold), was induced 2.5-fold. PGP Synthase 1 (Pgs1) catalyzes the formation of phosphatidylglycerols (PGs) which were modestly affected by TCDD (unchanged in males, repressed 1.9-fold in females). Subsequently, PG is combined with CDP-DAG by CL synthase (Crls1) in the inner mitochondrial membrane, producing nascent CLs found exclusively in the inner mitochondrial membrane (Figure 8B, boxes 13). Nascent CLs are remodeled by successive removal of acyl-chains by phospholipase, followed by taffazzin-mediated replacement from donor phospholipids or acyltransferase-mediated esterification requiring acyl-CoA (Figure 8B, box 14). Although, TCDD induced Pgs1 2.0-fold and Crls1 was unchanged, mitochondrial-located Acsl1 was repressed 2.6-fold, which prefers activating linoleate and directing linoleoyl-CoA to tetralinoleoyl-CL which makes up 50% of hepatic mitochondrial CL levels. Acsl1 repression is consistent with the 7.4-fold reduction in CLs as well as compromised mitochondrial function, although oxidative damage may also contribute to lower CL levels.
CER and SM also share a common biosynthesis pathway. SM (reduced 3.1-fold in female mice) is produced by sphingomyelin synthase (Sgms) using PC and CER as substrates (Figure 8B, box 17). In female mice, TCDD repressed Sgms2 1.8-fold (Figure 8). CER, on the other hand, is synthesized by the formation of 3-ketosphingosine using palmitoyl-CoA and serine by serine palmitoyltransferase (Sptlc2 induced 1.8-fold). 3-Ketosphingosine is further processed by 3-ketosphinganine reductase (Kdsr repressed 2.6-fold), ceramide synthase (Cers2 repressed 1.8- while Cers4, Cers5 and Cers6 were induced 1.7-, 1.9 -, and 1.5 -fold, respectively), and dihydroceramide desaturase (Degs2 induced 2.0-fold) to produce CER which was induced 6.9-fold (Figure 8B, box 16).
Altered Hepatic Lipoprotein Uptake and Secretion
Increased hepatic TG and CE levels, together with lipid biosynthesis inhibition and evidence of lipid accumulation from dietary sources and peripheral fat mobilization,16 suggest that TCDD-elicited steatosis is due to increased hepatic lipid uptake and impaired efflux. Dietary lipids are primarily absorbed in the jejunum where FFAs and cholesterol are imported by transporters Cd36, Npc1l1, and Abcg5 on the apical (lumen) side. TCDD induced Cd36 1.7-fold in the jejunal epithelium, while cholesterol uptake mediators Npc1l1 and Abcg5 were both repressed 1.5-fold (Figure 6A-5). Absorbed lipids are subsequently incorporated into ApoB48 (Apob)-containing chylomicrons by microsomal TG transfer protein (Mttp), which was unchanged by TCDD (Figure 6A-8). Jejunal Soats package cholesterol into chylomicrons through esterification, facilitating basolateral export into the portal circulation bypassing Acba1, which was repressed 3.7 fold (Figure 6A-7). Jejunal Soat1 was induced 2.4-fold, while Soat2, considered to be the major player in intestinal and hepatic cholesterol esterification,45,47,52,53 was unchanged (Figure 6A-6). Soat1 expression correlates with C20−22 esterified species levels which were largely reduced by TCDD, while Soat2 correlates with C16−18 FA esterified species which were increased (Figure 5).54 These results suggest improved jejunal efficiency of chylomicron packaging for delivery to peripheral tissues.
Lipases liberate FFAs from chylomicrons for uptake resulting in the production of remnants. Hepatic lipoprotein lipase (Lpl) and endothelial lipase (Lipg) were induced 6.8- and 4.5-fold by TCDD, respectively (Figure 4, box 2). While LIPG plays a key role in regulating cholesterol and high density lipoprotein (HDL) metabolism, LPL hydrolyzes triglycerides for cellular uptake55,56 and is regulated primarily at the posttranslational level57 enhanced by the lipase maturation factor (Lmf1, repressed 1.5-fold) in the ER prior to transport by Gpihbp1 (induced 1.3-fold).
Chylomicron remnants are taken up by the liver through receptor mediated endocytosis via the low density lipoprotein (LDL) and very low density lipoprotein (VLDL) receptors (Ldlr/Vldlr) (Figure 4, box 1).58−61 Hepatic Ldlr exhibited dose-dependent induction up to 5-fold between 0.3−10 μg/kg TCDD but was repressed 2.5-fold at 30 μg/kg. Similarly, the LDL receptor associated protein (Lrpap1) which aids lipoprotein endocytosis by the LDLR was repressed 1.5-fold, while Pcsk9 which targets the LDLR for degradation (and consequently reduces lipid uptake) was induced up to 2.8-fold at 10 μg/kg but repressed 5.0-fold at 30 μg/kg TCDD. In contrast, Vldlr was dose-dependently induced up to 9.8-fold with significant induction 0.3 μg/kg TCDD and higher. Liberated FFAs can also be absorbed by fatty acid transporter proteins (FATP, Slc27a), caveolins, CD36, and intracellular fatty acid binding proteins (FABP). Hepatic Cd36 was induced 9.2-fold as were Cav1 (1.7-fold) and Cav2 (1.7-fold). FATPs associated with hepatic FA transport were not affected by treatment. Highly expressed Fabp1 and 4 were repressed 2.9-fold and induced 2.4-fold, respectively. Fabp2 and Fabp5 were also repressed 3.0- and 1.7-fold, respectively, while the lesser known Fabp12 was dose-dependently (from 0.1 to 30 μg/kg) induced up to 55.6-fold by TCDD. Conversely, the scavenger receptor class B member 1 (Scarb1) which can selectively uptake CE from HDL was repressed 2.5-fold (Figure 6A, box 1) suggesting chylomicrons rather than lipoproteins as the major source of hepatic CE accumulation.
Hepatic lipids are secreted as components of very low density lipoproteins (VLDL) using ApoB as a scaffold. ApoB is translocated across the endoplasmic reticulum (ER), lipidated, and folded by Mttp, or degraded. In TCDD treated mice, hepatic Apob and Mttp were repressed 3.8- and 1.9-fold, respectively, while Apobec3 involved in ApoB processing was induced 2.5-fold. In fact, the majority of hepatic apolipoproteins are repressed by TCDD (Figure 10). Similarly, Ces, Aadac, and Lipc which channel lipids into a lipolysis/re-esterification cycle required for lipoprotein assembly were all repressed by TCDD, further impairing VLDL assembly.41 Hepatic VLDLs are also dependent on PC incorporation, and disrupted synthesis may compromise secretion.62,63 Alternatively, cholesterol and phospholipids can be effluxed from the liver via ABCA1 and ABCG1 on APOA1 scaffolds within HDL. HDL bound cholesterol can be eliminated through transintestinal cholesterol excretion (TICE) which facilitates cholesterol removal via a nonbiliary route.64 TCDD induced hepatic Abcg1 4.5-fold suggesting TICE may be induced to efflux excess cholesterol, although further studies are needed to evaluate cholesterol uptake and elimination kinetics.
Figure 10.

Hepatic apolipoprotein-related differential gene expression in male mice gavaged with TCDD every 4 days for 28 days. The color scale represents the log2(fold-change). The presence of pDREs (DRE; MSS ≥ 0.89) and AhR enrichment peaks (FDR ≤ 0.05) determined by ChIP-Seq are shown as green boxes.20 Counts represent the maximum raw number of aligned reads to each transcript across doses indicating the potential level of hepatic expression, where yellow represents a low level of expression (≤500 reads) and pink represents a higher level of expression (≥10,000).
DISCUSSION
Hepatic fat accumulation can result from increased uptake, reduced efflux, inhibition of β-oxidation, and/or the induction of de novo lipogenesis. The response to TCDD and related compounds is well conserved,7,10,20 characterized by increased lipid uptake,10,14,16 and the repression of β-oxidation10 and de novo FA synthesis.10,17,20 To further evaluate TCDD-elicited steatosis and progression to steatohepatitis with fibrosis, untargeted lipidomic data were integrated with complementary RNA-Seq and ChIP-Seq data sets. Our data confirm TCDD induced hepatic fat accumulation with lipid composition changes largely conserved across sexes, although quantitatively male mice were more sensitive and exhibited greater accumulation, as indicated by oil red O staining.35 As such, this discussion largely focused on male responses while highlighting notable differences in female mice.
TCDD not only increased hepatic lipid accumulation but also changed the percent composition of total lipids. For example, TCDD increased the levels of FFAs, cholesterol esters, DGs, and CERs, all of which have lipotoxicity potential. Accumulation of these lipid species may contribute to oxidative stress, lipid peroxidation, inflammation, and fibrosis.36,46,65,66 Furthermore, CERs have been linked to the induction of cytokines, insulin resistance, and the progression of NAFLD pathologies.13 Most dramatic was the 3.0-fold increase in TGs representing >80% of total hepatic lipids in TCDD treated mice compared to 47−48% in controls. FFA packaging into TGs minimizes lipotoxicity as demonstrated in Dgat null mice that are unable to synthesize TGs.38,67 The FFAs packaged into TGs are those largely those found in the rodent diet or obtained exclusively from the diet,16 consistent with AhR-mediated jejunal and hepatic differential gene expression associated with lipid accumulation in the liver.16,28
Cholesterol (not confirmed by high resolution MS/MS) and CE levels were also increased by TCDD, despite the coordinated repression of cholesterol biosynthesis as previously reported in female mice.8,18 β-Naphthoflavone, a labile AhR agonist, and TCDD are also reported to repress gene expression associated with cholesterol biosynthesis in human primary hepatocytes and rat liver, respectively.9,68−70 In male mice, cholesterol biosynthesis was largely repressed at 30 μg/kg but induced at lower doses suggesting negative feedback regulation, possibly through SREBP-2 (Srebf 2) which was unchanged at lower doses but repressed by TCDD at 30 μg/kg. In females, cholesterol biosynthesis gene expression was repressed or unchanged. Although intestinal cholesterol transporters of the apical membrane (lumen) were repressed, enterocyte differential gene expression suggests increased chylomicron packaging efficiency of dietary cholesterol as CE. Similar to TGs, CE formation minimizes potential cholesterol lipotoxicity as well as serves as an additional sink for excess FFAs. Peripheral tissues, such as gonadal white adipose tissue (gWAT) weight in TCDD treated mice,35 may be another source of CEs delivered by reverse cholesterol transport (RCT). Indeed, gWAT has been identified as the source of increased circulating cholesterol levels in hibernating animals.71
Alterations in lipid composition can influence membrane structure and dynamics. In addition to increases in CEs and TGs, TCDD reduced phospholipids and CL levels, all of which are major lipid membrane constituents. Repression of choline kinase and phosphate cytidyltransferase (Pcyt1a) likely compromise PC biosynthesis via the CDP-choline pathway, while the repression of phosphate cytidyltransferase (Pcyt2), ethanolaminephosphotransferase (Ept1), and phosphatidylethanolamine methyltransferase (Pemt) limits biosynthesis via the CDP-ethanolamine pathway. Phospholipid head groups (e.g., ethanolamine, serine, and choline) serve important interaction roles with other lipids and proteins, while the length, saturation, and position of the acyl group affect interactions with cholesterol in the bilayer affecting membrane rigidity and fluidity.72 TCDD altered not only the degree of saturation but also the acyl chain length in a phospholipid-specific manner with unknown consequences on membrane structure and function, and signaling. In the mitochondria, CLs account for 10−20% of total phospholipids with important roles in membrane structure and function. CL reductions, as observed in TCDD treated samples, compromise oxidative phosphorylation and increase susceptibility to ROS.73 Moreover, CL oxidation and depletion in hepatic mitochondria is reported in NAFLD.74 Ultimately, TCDD-elicited changes in phospholipids and CLs likely compromise membrane structure and function.
Changes in phospholipid ratios also affect lipid export and delivery to peripheral tissues. Despite increased FFA packaging into TGs and CEs, gene expression and lipidomic changes were indicative of reduced VLDL export. TCDD repressed genes associated with TGs hydrolysis (e.g., Ces isoforms, Aadac, and Lipa), lowered serum ApoB100 and ApoB48 levels, and disrupted phospholipid metabolism, all critical to VLDL assemble and secretion.10,15,75 Moreover, phospholipids and related species are also involved in bile acid transport into bile ducts. High levels of PC are found in bile and impaired synthesis and/or depletion has been associated with reduced cholesterol elimination via bile secretion.76,77 Accordingly, hepatic CE accumulation and alterations in phospholipid profiles may also be associated with reported increases in hepatic and serum bile acids.35
In summary, TCDD elicits dose-dependent effects on many key events associated with the progression of steatosis to steatohepatitis with fibrosis.78 The inhibition of β-oxidation and increased FFA uptake resulted in hepatic steatosis with FFA sequestration into TGs and CEs, a cytoprotective strategy to channel excess FFAs into lipid droplets to minimize potential lipotoxicity. In addition, TCDD altered hepatic lipid composition by increasing the number of carbons and double bonds within acyl chains. FFAs, CERs, and DGs were also increased, while other lipid classes (e.g., CL, PS, PE, and PC) critical to membrane structure, integrity, and function were reduced relative to controls. Accentuating lipid accumulation and hepatotoxicity was the inhibition of VLDL efflux as well as bile acid secretion, the primary excretion pathway for cholesterol.35 Consequently, lipid accumulation likely contributes to the overall hepatotoxicity burden, triggering further inflammation and eventual collagen deposition in the progression along the NAFLD spectrum. Despite demonstrations of increased FFA levels in human primary hepatocytes,79 the significance of AhR-mediated disruption of lipid uptake, processing, and transport in relation to complex metabolic diseases in humans such as NAFLD, MetS, and diabetes remains to be determined.
Supplementary Material
Acknowledgments
Funding
This work was supported by the National Institute of Environmental Health Sciences Superfund Research Program (NIEHS SRP P42ES04911). T.R.Z. is supported by AgBioR-esearch at MSU. R.N. was supported by the MSU Barnett Rosenberg Endowed Assistantship and Integrative Training in the Pharmacological Sciences grant (NIH 5T32GM092715). K.A.F. is supported by the Canadian Institutes of Health Research (CIHR) Doctoral Foreign Study Award (DFS-140386).
ABBREVIATIONS
- AhR
aryl hydrocarbon receptor
- ARNT
aryl hydrocarbon receptor nuclear translocator
- CE
cholesterol ester
- CER
ceramide
- CL
cardiolipin
- DG
diacylgrlycerol
- DRE
dioxin response element
- ER
endoplasmic reticulum
- G3P
glycerol-3-phosphate
- gWAT
gonadal white adipose tissue
- HCD-MS/ MS
high energy induced dissociation MS/MS
- HDL
high density lipoprotein
- LDL
low density lipoprotein
- LPA
lysophosphatidic acid
- MCD
methionine-choline deficient
- MetS
metabolic syndrome
- MG
monoacylglycerol
- NAFLD
nonalcoholic fatty liver disease
- nESI
nanoelectrospray ionization
- PA
phosphatidic acid
- PC
phosphatidylcholine
- PE
phosphatidylethanolamine
- PG
phosphatidylglycerol
- PI
phosphatidylinositol
- PLS-DA
partial least-squares determinant analysis
- PND
postnatal day
- PS
phosphatidylserine
- RCT
reverse cholesterol transport
- ROS
reactive oxygen species
- SAM
s-adenosylmethionine
- SM
sphingomyelin
- T2D
type 2 diabetes
- TCDD
2,3,7,8-tetrachlorodibenzo-p-dioxin
- TG
triglyceride
- TICE
transintestinal cholesterol export
- VIP
variance in projection
- VLDL
very low density lipoprotein
- VST
variance stabilizing transformation
Footnotes
Supporting Information
The Supporting Information is available free of charge on the ACS Publications website at DOI: 10.1021/acs.chemrestox.6b00430.
User-defined database used for the identification of lipid species by the untargeted lipidomics approach (XLSX) Signals for the detected lipid species in male and female mice gavaged with TCDD every 4 days for 28 days (XLSX)
ORCID
Rance Nault: 0000-0002-6822-4962
Notes
The content is solely the responsibility of the authors and does not necessarily represent the official views of the NIEHS.
The authors declare no competing financial interest.
References
- 1.Lee DH, Lee IK, Porta M, Steffes M, Jacobs DR., Jr Relationship between serum concentrations of persistent organic pollutants and the prevalence of metabolic syndrome among non-diabetic adults: results from the National Health and Nutrition Examination Survey 1999−2002. Diabetologia. 2007;50:1841–1851. doi: 10.1007/s00125-007-0755-4. [DOI] [PubMed] [Google Scholar]
- 2.Taylor KW, Novak RF, Anderson HA, Birnbaum LS, Blystone C, Devito M, Jacobs D, Kohrle J, Lee DH, Rylander L, Rignell-Hydbom A, Tornero-Velez R, Turyk ME, Boyles AL, Thayer KA, Lind L. Evaluation of the association between persistent organic pollutants (POPs) and diabetes in epidemiological studies: a national toxicology program workshop review. Environ Health Perspect. 2013;121:774–783. doi: 10.1289/ehp.1205502. [DOI] [PMC free article] [PubMed] [Google Scholar]
- 3.Nault R, Fader KA, Ammendolia DA, Dornbos P, Potter D, Sharratt B, Kumagai K, Harkema JR, Lunt SY, Matthews J, Zacharewski T. Dose-Dependent Metabolic Reprogramming and Differential Gene Expression in TCDD-Elicited Hepatic Fibrosis. Toxicol Sci. 2016;154:253–266. doi: 10.1093/toxsci/kfw163. [DOI] [PMC free article] [PubMed] [Google Scholar]
- 4.Fernandez-Salguero PM, Hilbert DM, Rudikoff S, Ward JM, Gonzalez FJ. Aryl-hydrocarbon receptor-deficient mice are resistant to 2,3,7,8-tetrachlorodibenzo-p-dioxin-induced toxicity. Toxicol Appl Pharmacol. 1996;140:173–179. doi: 10.1006/taap.1996.0210. [DOI] [PubMed] [Google Scholar]
- 5.Duval C, Teixeira-Clerc F, Leblanc AF, Touch S, Emond C, Guerre-Millo M, Lotersztajn S, Barouki R, Aggerbeck M, Coumoul X. Chronic Exposure to Low Doses of Dioxin Promotes Liver Fibrosis Development in the C57BL6/J Diet-Induced Obesity Mouse Model. Environ Health Perspect. 2017 doi: 10.1289/EHP316. [DOI] [PMC free article] [PubMed] [Google Scholar]
- 6.Kopec AK, Boverhof DR, Nault R, Harkema JR, Tashiro C, Potter D, Sharratt B, Chittim B, Zacharewski TR. Toxicogenomic Evaluation of Long-term Hepatic Effects of TCDD in Immature, Ovariectomized C57BL/6 Mice. Toxicol Sci. 2013;135:465–475. doi: 10.1093/toxsci/kft156. [DOI] [PMC free article] [PubMed] [Google Scholar]
- 7.Pierre S, Chevallier A, Teixeira-Clerc F, Ambolet-Camoit A, Bui LC, Bats AS, Fournet JC, Fernandez-Salguero P, Aggerbeck M, Lotersztajn S, Barouki R, Coumoul X. Aryl hydrocarbon receptor-dependent induction of liver fibrosis by dioxin. Toxicol Sci. 2014;137:114–124. doi: 10.1093/toxsci/kft236. [DOI] [PubMed] [Google Scholar]
- 8.Boverhof DR, Burgoon LD, Tashiro C, Chittim B, Harkema JR, Jump DB, Zacharewski TR. Temporal and dose-dependent hepatic gene expression patterns in mice provide new insights into TCDD-Mediated hepatotoxicity. Toxicol Sci. 2005;85:1048–1063. doi: 10.1093/toxsci/kfi162. [DOI] [PubMed] [Google Scholar]
- 9.Tanos R, Patel RD, Murray IA, Smith PB, Patterson AD, Perdew GH. Aryl hydrocarbon receptor regulates the cholesterol biosynthetic pathway in a dioxin response element-independent manner. Hepatology. 2012;55:1994–2004. doi: 10.1002/hep.25571. [DOI] [PMC free article] [PubMed] [Google Scholar]
- 10.Lee JH, Wada T, Febbraio M, He J, Matsubara T, Lee MJ, Gonzalez FJ, Xie W. A novel role for the dioxin receptor in fatty acid metabolism and hepatic steatosis. Gastro-enterology. 2010;139:653–663. doi: 10.1053/j.gastro.2010.03.033. [DOI] [PMC free article] [PubMed] [Google Scholar]
- 11.Puri P, Baillie RA, Wiest MM, Mirshahi F, Choudhury J, Cheung O, Sargeant C, Contos MJ, Sanyal AJ. A lipidomic analysis of nonalcoholic fatty liver disease. Hepatology. 2007;46:1081–1090. doi: 10.1002/hep.21763. [DOI] [PubMed] [Google Scholar]
- 12.Qi Y, Jiang C, Cheng J, Krausz KW, Li T, Ferrell JM, Gonzalez FJ, Chiang JY. Bile acid signaling in lipid metabolism: metabolomic and lipidomic analysis of lipid and bile acid markers linked to anti-obesity and anti-diabetes in mice. Biochim Biophys Acta, Mol Cell Biol Lipids. 2015;1851:19–29. doi: 10.1016/j.bbalip.2014.04.008. [DOI] [PMC free article] [PubMed] [Google Scholar]
- 13.Pagadala M, Kasumov T, McCullough AJ, Zein NN, Kirwan JP. Role of ceramides in nonalcoholic fatty liver disease. Trends Endocrinol Metab. 2012;23:365–371. doi: 10.1016/j.tem.2012.04.005. [DOI] [PMC free article] [PubMed] [Google Scholar]
- 14.Yao L, Wang C, Zhang X, Peng L, Liu W, Liu Y, He J, Jiang C, Ai D, Zhu Y. Hyperhomocysteinemia activates the aryl hydrocarbon receptor/CD36 pathway to promote hepatic steatosis in mice. Hepatology. 2016;64:92–105. doi: 10.1002/hep.28518. [DOI] [PubMed] [Google Scholar]
- 15.Angrish MM, Dominici CY, Zacharewski TR. TCDD-elicited effects on liver, serum, and adipose lipid composition in C57BL/6 mice. Toxicol Sci. 2013;131:108–115. doi: 10.1093/toxsci/kfs277. [DOI] [PMC free article] [PubMed] [Google Scholar]
- 16.Angrish MM, Mets BD, Jones AD, Zacharewski TR. Dietary Fat Is a Lipid Source in 2,3,7,8-Tetrachlorodibenzo-rho-Dioxin (TCDD)-Elicited Hepatic Steatosis in C57BL/6 Mice. Toxicol Sci. 2012;128:377–386. doi: 10.1093/toxsci/kfs155. [DOI] [PMC free article] [PubMed] [Google Scholar]
- 17.Tanos R, Murray IA, Smith PB, Patterson A, Perdew GH. Role of the Ah receptor in homeostatic control of fatty acid synthesis in the liver. Toxicol Sci. 2012;129:372–379. doi: 10.1093/toxsci/kfs204. [DOI] [PMC free article] [PubMed] [Google Scholar]
- 18.Forgacs AL, Kent MN, Makley MK, Mets B, DelRaso N, Jahns GL, Burgoon LD, Zacharewski TR, Reo NV. Comparative metabolomic and genomic analyses of TCDD-elicited metabolic disruption in mouse and rat liver. Toxicol Sci. 2012;125:41–55. doi: 10.1093/toxsci/kfr262. [DOI] [PMC free article] [PubMed] [Google Scholar]
- 19.Nault R, Fader KA, Zacharewski T. RNA-Seq versus oligonucleotide array assessment of dose-dependent TCDD-elicited hepatic gene expression in mice. BMC Genomics. 2015;16:373. doi: 10.1186/s12864-015-1527-z. [DOI] [PMC free article] [PubMed] [Google Scholar]
- 20.Nault R, Fader KA, Kirby MP, Ahmed S, Matthews J, Jones AD, Lunt SY, Zacharewski TR. Pyruvate Kinase Isoform Switching and Hepatic Metabolic Reprogramming by the Environmental Contaminant 2,3,7,8-Tetrachlorodibenzo-p-Dioxin. Toxicol Sci. 2016;149:358–371. doi: 10.1093/toxsci/kfv245. [DOI] [PMC free article] [PubMed] [Google Scholar]
- 21.Fader KA, Nault R, Kirby MP, Markous G, Matthews J, Zacharewski TR. Convergence of hepcidin deficiency, systemic iron overloading, heme accumulation, and REV-ERBalpha/beta activation in aryl hydrocarbon receptor-elicited hepatotoxicity. Toxicol Appl Pharmacol. 2017;321:1. doi: 10.1016/j.taap.2017.02.006. [DOI] [PMC free article] [PubMed] [Google Scholar]
- 22.Lydic TA, Busik JV, Reid GE. A monophasic extraction strategy for the simultaneous lipidome analysis of polar and nonpolar retina lipids. J Lipid Res. 2014;55:1797–1809. doi: 10.1194/jlr.D050302. [DOI] [PMC free article] [PubMed] [Google Scholar]
- 23.Lydic TA, Townsend S, Adda CG, Collins C, Mathivanan S, Reid GE. Rapid and comprehensive ’shotgun’ lipidome profiling of colorectal cancer cell derived exosomes. Methods. 2015;87:83–95. doi: 10.1016/j.ymeth.2015.04.014. [DOI] [PMC free article] [PubMed] [Google Scholar]
- 24.Bolger AM, Lohse M, Usadel B. Trimmomatic: a flexible trimmer for Illumina sequence data. Bioinformatics. 2014;30:2114–2120. doi: 10.1093/bioinformatics/btu170. [DOI] [PMC free article] [PubMed] [Google Scholar]
- 25.Langmead B, Trapnell C, Pop M, Salzberg SL. Ultrafast and memory-efficient alignment of short DNA sequences to the human genome. Genome biology. 2009;10:R25. doi: 10.1186/gb-2009-10-3-r25. [DOI] [PMC free article] [PubMed] [Google Scholar]
- 26.Anders S. HTSeq: Analysing High-Throughput Sequencing Data with Python. 2010 doi: 10.1093/bioinformatics/btac166. http://www-huber.embl.de/users/anders/HTSeq/doc/overview.html. [DOI] [PMC free article] [PubMed]
- 27.Anders S, Huber W. Differential expression analysis for sequence count data. Genome biology. 2010;11:R106. doi: 10.1186/gb-2010-11-10-r106. [DOI] [PMC free article] [PubMed] [Google Scholar]
- 28.Fader KA, Nault R, Ammendolia DA, Harkema JR, Williams KJ, Crawford RB, Kaminski NE, Potter D, Sharratt B, Zacharewski TR. 2,3,7,8-Tetrachlorodibenzo-p-Dioxin Alters Lipid Metabolism and Depletes Immune Cell Populations in the Jejunum of C57BL/6 Mice. Toxicol Sci. 2015;148:567–580. doi: 10.1093/toxsci/kfv206. [DOI] [PMC free article] [PubMed] [Google Scholar]
- 29.Eckel JE, Gennings C, Chinchilli VM, Burgoon LD, Zacharewski TR. Empirical bayes gene screening tool for time-course or dose-response microarray data. J Biopharm Stat. 2004;14:647–670. doi: 10.1081/BIP-200025656. [DOI] [PubMed] [Google Scholar]
- 30.Eckel JE, Gennings C, Therneau TM, Burgoon LD, Boverhof DR, Zacharewski TR. Normalization of two-channel microarray experiments: a semiparametric approach. Bio-informatics. 2005;21:1078–1083. doi: 10.1093/bioinformatics/bti105. [DOI] [PubMed] [Google Scholar]
- 31.Nault R, Colbry D, Brandenberger C, Harkema JR, Zacharewski TR. Development of a computational high-throughput tool for the quantitative examination of dose-dependent histological features. Toxicol Pathol. 2015;43:366–375. doi: 10.1177/0192623314544379. [DOI] [PMC free article] [PubMed] [Google Scholar]
- 32.Vos JG, Moore JA, Zinkl JG. Toxicity of 2,3,7,8-tetrachlorodibenzo-p-dioxin (TCDD) in C57B1/6 mice. Toxicol Appl Pharmacol. 1974;29:229–241. doi: 10.1016/0041-008x(74)90060-x. [DOI] [PubMed] [Google Scholar]
- 33.McConnell EE, Moore JA, Haseman JK, Harris MW. The comparative toxicity of chlorinated dibenzo-p-dioxins in mice and guinea pigs. Toxicol Appl Pharmacol. 1978;44:335–356. doi: 10.1016/0041-008x(78)90195-3. [DOI] [PubMed] [Google Scholar]
- 34.Nault R, Fader KA, Kopec AK, Harkema JR, Zacharewski TR, Luyendyk JP. From the Cover: Coagulation-Driven Hepatic Fibrosis Requires Protease Activated Receptor-1 (PAR-1) in a Mouse Model of TCDD-Elicited Steatohepatitis. Toxicol Sci. 2016;154:381–391. doi: 10.1093/toxsci/kfw175. [DOI] [PMC free article] [PubMed] [Google Scholar]
- 35.Fader, K. A., Nault, R., Zhang, C., and Zacharewski, T., unpublished results.
- 36.Brookheart RT, Michel CI, Schaffer JE. As a matter of fat. Cell Metab. 2009;10:9–12. doi: 10.1016/j.cmet.2009.03.011. [DOI] [PMC free article] [PubMed] [Google Scholar]
- 37.Zechner R, Zimmermann R, Eichmann TO, Kohlwein SD, Haemmerle G, Lass A, Madeo F. FAT SIGNALS– lipases and lipolysis in lipid metabolism and signaling. Cell Metab. 2012;15:279–291. doi: 10.1016/j.cmet.2011.12.018. [DOI] [PMC free article] [PubMed] [Google Scholar]
- 38.Yamaguchi K, Yang L, McCall S, Huang J, Yu XX, Pandey SK, Bhanot S, Monia BP, Li YX, Diehl AM. Inhibiting triglyceride synthesis improves hepatic steatosis but exacerbates liver damage and fibrosis in obese mice with nonalcoholic steatohepatitis. Hepatology. 2007;45:1366–1374. doi: 10.1002/hep.21655. [DOI] [PubMed] [Google Scholar]
- 39.Buzzetti E, Pinzani M, Tsochatzis EA. The multiple-hit pathogenesis of non-alcoholic fatty liver disease (NAFLD) Metab, Clin Exp. 2016;65:1038–1048. doi: 10.1016/j.metabol.2015.12.012. [DOI] [PubMed] [Google Scholar]
- 40.Koliwad SK, Streeper RS, Monetti M, Cornelissen I, Chan L, Terayama K, Naylor S, Rao M, Hubbard B, Farese RV., Jr DGAT1-dependent triacylglycerol storage by macrophages protects mice from diet-induced insulin resistance and inflammation. J Clin Invest. 2010;120:756–767. doi: 10.1172/JCI36066. [DOI] [PMC free article] [PubMed] [Google Scholar]
- 41.Quiroga AD, Lehner R. Liver triacylglycerol lipases. Biochim Biophys Acta, Mol Cell Biol Lipids. 2012;1821:762–769. doi: 10.1016/j.bbalip.2011.09.007. [DOI] [PubMed] [Google Scholar]
- 42.Du H, Heur M, Duanmu M, Grabowski GA, Hui DY, Witte DP, Mishra J. Lysosomal acid lipase-deficient mice: depletion of white and brown fat, severe hepatosplenomegaly, and shortened life span. Journal of lipid research. 2001;42:489–500. [PubMed] [Google Scholar]
- 43.Guillou H, Zadravec D, Martin PG, Jacobsson A. The key roles of elongases and desaturases in mammalian fatty acid metabolism: Insights from transgenic mice. Prog Lipid Res. 2010;49:186–199. doi: 10.1016/j.plipres.2009.12.002. [DOI] [PubMed] [Google Scholar]
- 44.Lee RG, Shah R, Sawyer JK, Hamilton RL, Parks JS, Rudel LL. ACAT2 contributes cholesteryl esters to newly secreted VLDL, whereas LCAT adds cholesteryl ester to LDL in mice. J Lipid Res. 2005;46:1205–1212. doi: 10.1194/jlr.M500018-JLR200. [DOI] [PubMed] [Google Scholar]
- 45.Buhman KK, Accad M, Novak S, Choi RS, Wong JS, Hamilton RL, Turley S, Farese RV., Jr Resistance to diet-induced hypercholesterolemia and gallstone formation in ACAT2-deficient mice. Nat Med. 2000;6:1341–1347. doi: 10.1038/82153. [DOI] [PubMed] [Google Scholar]
- 46.Warner GJ, Stoudt G, Bamberger M, Johnson WJ, Rothblat GH. Cell toxicity induced by inhibition of acyl coenzyme A:cholesterol acyltransferase and accumulation of unesteri-fied cholesterol. J Biol Chem. 1995;270:5772–5778. doi: 10.1074/jbc.270.11.5772. [DOI] [PubMed] [Google Scholar]
- 47.Meiner VL, Cases S, Myers HM, Sande ER, Bellosta S, Schambelan M, Pitas RE, McGuire J, Herz J, Farese RV., Jr Disruption of the acyl-CoA:cholesterol acyltransferase gene in mice: evidence suggesting multiple cholesterol esterification enzymes in mammals. Proc Natl Acad Sci U S A. 1996;93:14041–14046. doi: 10.1073/pnas.93.24.14041. [DOI] [PMC free article] [PubMed] [Google Scholar]
- 48.Vance JE. Phospholipid synthesis and transport in mammalian cells. Traffic. 2015;16:1–18. doi: 10.1111/tra.12230. [DOI] [PubMed] [Google Scholar]
- 49.Paulson BK, Porter TJ, Kent C. The effect of polycyclic aromatic hydrocarbons on choline kinase activity in mouse hepatoma cells. Biochim Biophys Acta, Lipids Lipid Metab. 1989;1004:274–277. doi: 10.1016/0005-2760(89)90278-6. [DOI] [PubMed] [Google Scholar]
- 50.Watkins SM, Zhu X, Zeisel SH. Phosphatidylethanolamine-N-methyltransferase activity and dietary choline regulate liver-plasma lipid flux and essential fatty acid metabolism in mice. J Nutr. 2003;133:3386–3391. doi: 10.1093/jn/133.11.3386. [DOI] [PubMed] [Google Scholar]
- 51.Pynn CJ, Henderson NG, Clark H, Koster G, Bernhard W, Postle AD. Specificity and rate of human and mouse liver and plasma phosphatidylcholine synthesis analyzed in vivo. J Lipid Res. 2011;52:399–407. doi: 10.1194/jlr.D011916. [DOI] [PMC free article] [PubMed] [Google Scholar]
- 52.Chang CC, Sakashita N, Ornvold K, Lee O, Chang ET, Dong R, Lin S, Lee CY, Strom SC, Kashyap R, Fung JJ, Farese RV, Jr, Patoiseau JF, Delhon A, Chang TY. Immunological quantitation and localization of ACAT-1 and ACAT-2 in human liver and small intestine. J Biol Chem. 2000;275:28083–28092. doi: 10.1074/jbc.M003927200. [DOI] [PubMed] [Google Scholar]
- 53.Parini P, Davis M, Lada AT, Erickson SK, Wright TL, Gustafsson U, Sahlin S, Einarsson C, Eriksson M, Angelin B, Tomoda H, Omura S, Willingham MC, Rudel LL. ACAT2 is localized to hepatocytes and is the major cholesterol-esterifying enzyme in human liver. Circulation. 2004;110:2017–2023. doi: 10.1161/01.CIR.0000143163.76212.0B. [DOI] [PubMed] [Google Scholar]
- 54.Jain M, Ngoy S, Sheth SA, Swanson RA, Rhee EP, Liao R, Clish CB, Mootha VK, Nilsson R. A systematic survey of lipids across mouse tissues. American journal of physiology Endocrinology and metabolism. 2014;306:E854–868. doi: 10.1152/ajpendo.00371.2013. [DOI] [PMC free article] [PubMed] [Google Scholar]
- 55.Su Z, Ishimori N, Chen Y, Leiter EH, Churchill GA, Paigen B, Stylianou IM. Four additional mouse crosses improve the lipid QTL landscape and identify Lipg as a QTL gene. J Lipid Res. 2009;50:2083–2094. doi: 10.1194/jlr.M900076-JLR200. [DOI] [PMC free article] [PubMed] [Google Scholar]
- 56.Ishida T, Choi S, Kundu RK, Hirata K, Rubin EM, Cooper AD, Quertermous T. Endothelial lipase is a major determinant of HDL level. J Clin Invest. 2003;111:347–355. doi: 10.1172/JCI16306. [DOI] [PMC free article] [PubMed] [Google Scholar]
- 57.Hosseini M, Ehrhardt N, Weissglas-Volkov D, Lai CM, Mao HZ, Liao JL, Nikkola E, Bensadoun A, Taskinen MR, Doolittle MH, Pajukanta P, Peterfy M. Transgenic expression and genetic variation of Lmf1 affect LPL activity in mice and humans. Arterioscler, Thromb, Vasc Biol. 2012;32:1204–1210. doi: 10.1161/ATVBAHA.112.245696. [DOI] [PMC free article] [PubMed] [Google Scholar]
- 58.Feingold KR, Grunfeld C. Introduction to Lipids and Lipoproteins. In: De Groot LJ, Beck-Peccoz P, Chrousos G, Dungan K, Grossman A, Hershman JM, Koch C, McLachlan R, New M, Rebar R, Singer F, Vinik A, Weickert MO, editors. Endotext. MDText.com, Inc.; South Dartmouth, MA: 2000. [Google Scholar]
- 59.Cooper AD. Hepatic uptake of chylomicron remnants. J Lipid Res. 1997;38:2173–2192. [PubMed] [Google Scholar]
- 60.Blasiole DA, Davis RA, Attie AD. The physiological and molecular regulation of lipoprotein assembly and secretion. Mol BioSyst. 2007;3:608–619. doi: 10.1039/b700706j. [DOI] [PubMed] [Google Scholar]
- 61.Jo H, Choe SS, Shin KC, Jang H, Lee JH, Seong JK, Back SH, Kim JB. Endoplasmic reticulum stress induces hepatic steatosis via increased expression of the hepatic very low-density lipoprotein receptor. Hepatology. 2013;57:1366–1377. doi: 10.1002/hep.26126. [DOI] [PubMed] [Google Scholar]
- 62.Yao ZM, Vance DE. The active synthesis of phosphatidylcholine is required for very low density lipoprotein secretion from rat hepatocytes. J Biol Chem. 1988;263:2998–3004. [PubMed] [Google Scholar]
- 63.Noga AA, Vance DE. A gender-specific role for phosphatidylethanolamine N-methyltransferase-derived phosphatidyl-choline in the regulation of plasma high density and very low density lipoproteins in mice. J Biol Chem. 2003;278:21851–21859. doi: 10.1074/jbc.M301982200. [DOI] [PubMed] [Google Scholar]
- 64.Bura KS, Lord C, Marshall S, McDaniel A, Thomas G, Warrier M, Zhang J, Davis MA, Sawyer JK, Shah R, Wilson MD, Dikkers A, Tietge UJ, Collet X, Rudel LL, Temel RE, Brown JM. Intestinal SR-BI does not impact cholesterol absorption or transintestinal cholesterol efflux in mice. J Lipid Res. 2013;54:1567–1577. doi: 10.1194/jlr.M034454. [DOI] [PMC free article] [PubMed] [Google Scholar]
- 65.Ioannou GN. The Role of Cholesterol in the Pathogenesis of NASH. Trends Endocrinol Metab. 2016;27:84–95. doi: 10.1016/j.tem.2015.11.008. [DOI] [PubMed] [Google Scholar]
- 66.Zambo V, Simon-Szabo L, Szelenyi P, Kereszturi E, Banhegyi G, Csala M. Lipotoxicity in the liver. World J Hepatol. 2013;5:550–557. doi: 10.4254/wjh.v5.i10.550. [DOI] [PMC free article] [PubMed] [Google Scholar]
- 67.Listenberger LL, Han X, Lewis SE, Cases S, Farese RV, Jr, Ory DS, Schaffer JE. Triglyceride accumulation protects against fatty acid-induced lipotoxicity. Proc Natl Acad Sci U S A. 2003;100:3077–3082. doi: 10.1073/pnas.0630588100. [DOI] [PMC free article] [PubMed] [Google Scholar]
- 68.Fletcher N, Wahlstrom D, Lundberg R, Nilsson CB, Nilsson KC, Stockling K, Hellmold H, Hakansson H. 2,3,7,8-Tetrachlorodibenzo-p-dioxin (TCDD) alters the mRNA expression of critical genes associated with cholesterol metabolism, bile acid biosynthesis, and bile transport in rat liver: a microarray study. Toxicol Appl Pharmacol. 2005;207:1–24. doi: 10.1016/j.taap.2004.12.003. [DOI] [PubMed] [Google Scholar]
- 69.Kakizuka S, Takeda T, Komiya Y, Koba A, Uchi H, Yamamoto M, Furue M, Ishii Y, Yamada H. Dioxin-Produced Alteration in the Profiles of Fecal and Urinary Metabolomes: A Change in Bile Acids and Its Relevance to Toxicity. Biol Pharm Bull. 2015;38:1484–1495. doi: 10.1248/bpb.b15-00235. [DOI] [PubMed] [Google Scholar]
- 70.Lakshman MR, Chirtel SJ, Chambers LL, Coutlakis PJ. Effects of 2,3,7,8-tetrachlorodibenzo-p-dioxin on lipid synthesis and lipogenic enzymes in the rat. J Pharmacol Exp Ther. 1989;248:62–66. [PubMed] [Google Scholar]
- 71.Otis JP, Sahoo D, Drover VA, Yen CL, Carey HV. Cholesterol and lipoprotein dynamics in a hibernating mammal. PLoS One. 2011;6:e29111. doi: 10.1371/journal.pone.0029111. [DOI] [PMC free article] [PubMed] [Google Scholar]
- 72.van Meer G, Voelker DR, Feigenson GW. Membrane lipids: where they are and how they behave. Nat Rev Mol Cell Biol. 2008;9:112–124. doi: 10.1038/nrm2330. [DOI] [PMC free article] [PubMed] [Google Scholar]
- 73.Paradies G, Paradies V, Ruggiero FM, Petrosillo G. Oxidative stress, cardiolipin and mitochondrial dysfunction in nonalcoholic fatty liver disease. WJG. 2014;20:14205–14218. doi: 10.3748/wjg.v20.i39.14205. [DOI] [PMC free article] [PubMed] [Google Scholar]
- 74.Petrosillo G, Portincasa P, Grattagliano I, Casanova G, Matera M, Ruggiero FM, Ferri D, Paradies G. Mitochondrial dysfunction in rat with nonalcoholic fatty liver Involvement of complex I, reactive oxygen species and cardiolipin. Biochim Biophys Acta, Bioenerg. 2007;1767:1260–1267. doi: 10.1016/j.bbabio.2007.07.011. [DOI] [PubMed] [Google Scholar]
- 75.Jacobs RL, van der Veen JN, Vance DE. Finding the balance: the role of S-adenosylmethionine and phosphatidylcholine metabolism in development of nonalcoholic fatty liver disease. Hepatology. 2013;58:1207–1209. doi: 10.1002/hep.26499. [DOI] [PubMed] [Google Scholar]
- 76.Vance DE, Vance JE. Physiological consequences of disruption of mammalian phospholipid biosynthetic genes. J Lipid Res. 2009;50(Suppl):S132–137. doi: 10.1194/jlr.R800048-JLR200. [DOI] [PMC free article] [PubMed] [Google Scholar]
- 77.Jungst D, Lang T, Huber P, Lange V, Paumgartner G. Effect of phospholipids and bile acids on cholesterol nucleation time and vesicular/micellar cholesterol in gallbladder bile of patients with cholesterol stones. J Lipid Res. 1993;34:1457–1464. [PubMed] [Google Scholar]
- 78.Angrish MM, Kaiser JP, McQueen CA, Chorley BN. Tipping the Balance: Hepatotoxicity and the 4 Apical Key Events of Hepatic Steatosis. Toxicol Sci. 2016;150:261–268. doi: 10.1093/toxsci/kfw018. [DOI] [PubMed] [Google Scholar]
- 79.Forgacs AL, Dere E, Angrish MM, Zacharewski TR. Comparative Analysis of Temporal and Dose-Dependent TCDD-Elicited Gene Expression in Human, Mouse, and Rat Primary Hepatocytes. Toxicol Sci. 2013;133:54–66. doi: 10.1093/toxsci/kft028. [DOI] [PMC free article] [PubMed] [Google Scholar]
Associated Data
This section collects any data citations, data availability statements, or supplementary materials included in this article.