

Abstract
Renal impairment (RI) is a major health concern with a growing prevalence. RI leads to various physiologic changes, in addition to a decrease in glomerular filtration rate, that impact the pharmacokinetics (PK) and, specifically, the renal clearance (CLR) of compounds, including alterations of drug transporter (DT)/drug-metabolizing enzyme expression and activity, as well as protein binding. The objectives of this study were to use a physiologically based pharmacokinetic modeling platform to 1) assess the impact of alterations in DT expression, toxin-drug interactions (TDIs), and free fraction (fu) on PK predictions for the organic cation transporter 2/multidrug and toxin extrusion protein 1 substrate metformin in RI populations; and 2) use available in vitro data to improve predictions of CLR for two actively secreted substrates, metformin and ranitidine. The goal was to identify changes in parameters other than glomerular filtration rate—namely, fu and DT expression/activity—that are consistent with in vitro and clinical data in RI, and predict the importance of these parameters in the PK of metformin and ranitidine in RI patients. Our results demonstrated that including alterations in DT expression and fu, and including TDIs affecting DT activity, as indicated by in vitro data, improved the simulated predictions of CLR and other PK parameters for both metformin and ranitidine in RI. Our simulations suggest that modifications of DT expression/activity and fu are necessary for improved predictions of CLR in RI for compounds that are actively secreted, and that improvement of PK predictions in RI populations for metformin and ranitidine can be obtained by incorporating in vitro data.
Introduction
Renal impairment (RI) is a major health concern; the current prevalence of RI is 13.2% with a projected prevalence in 2030 of 16.7% in the United States alone (Hoerger et al., 2015). RI accompanies many other disease states, including nephritis, glomerulonephritis, type 2 diabetes, and auto-immune diseases, such as lupus erythematosus (National Kidney Foundation, 2014). Since renal clearance (CLR) is a major route of elimination for many drugs, kidney function is a relevant factor in the pharmacokinetics (PK) of these compounds. The Food and Drug Administration (FDA) currently recommends clinical trials be conducted in RI populations for drugs where 30% or more of the drug is eliminated renally (FDA, 2010). Further characterization of the impact of RI on the PK of drugs is desirable because it may improve the accuracy of predictions for PK in RI populations.
RI is characterized by a decrease in the glomerular filtration rate (GFR), with decreasing estimates of GFR leading to more severe classes of RI (Inker et al., 2014). However, many other changes have been reported to occur in RI that are relevant to the clearance and distribution of drugs, including changes in drug transporter (DT) and drug-metabolizing enzyme expression, as well as changes in protein binding (Keller et al., 1984; Vanholder et al., 1988; Dreisbach and Lertora, 2008; Nolin et al., 2008; Naud et al., 2011). In addition to these changes, some compounds are known to accumulate to toxic concentrations in RI, and some of these compounds have been shown to inhibit the activity of major DTs, including members of the solute carrier and ATP-binding cassette families (Nigam et al., 2015; Katsube et al., 2017). One such compound, creatinine, has been shown to specifically inhibit transport via organic cation transporter 2 (OCT2), a major secretory transporter located on the basolateral membrane in the kidney proximal tubule (Ciarimboli et al., 2012; Sauzay et al., 2016). The presence of elevated levels of uremic toxins introduces the possibility of toxin-drug interactions (TDIs), resulting in altered drug clearance.
The impact of RI on PK is of particular interest for drugs that are actively secreted in the kidney, such as metformin, an antidiabetic drug, and ranitidine, an H2-receptor antagonist (Roberts, 1984; Gusler et al., 2001). Both metformin and ranitidine are actively transported from the blood to the proximal tubule via OCT2 and, subsequently, out of the proximal tubule cell into the kidney lumen via multidrug and toxin extrusion protein 1 (MATE1) (Neuhoff, 2013; Hacker et al., 2015; Burt et al., 2016). OCT2 substrates are of particular interest as the FDA recommends testing drugs that are actively secreted in the kidney to determine if they are substrates for OCT2 (FDA, 2012). Metformin and ranitidine are well characterized in RI populations, making them attractive model substrates for this study (Tucker et al., 1981; Zech et al., 1983; Roberts, 1984; Garg et al., 1986; Dixon et al., 1994; Sambol et al., 1995; Koch et al., 1997). It is currently difficult to predict potential changes in drug PK based on in vitro data and in vivo PK studies in normal volunteers. Using simulations based on metformin and ranitidine, which incorporate in vitro DT data as well as PK data in normal volunteers and RI patients, we can identify mechanisms that are important for the PK alteration in RI patients. This information will be important for further predictions for other OCT2/MATE1 substrates in assessing the potential changes in PK in RI.
Physiologically based pharmacokinetic (PBPK) modeling has been increasingly used for prediction of PK in specialized populations (Rowland et al., 2015). The PBPK modeling platform Simcyp (Cerata, Princeton, NJ) is useful for this approach, as it contains specialized populations, including those for RI. The advantage of PBPK platforms is they incorporate physiologically relevant information about specialized populations, including organ size and function, and are able to incorporate additional information from in vitro studies.
The objectives of this work were to use the physiologically based pharmacokinetic modeling platform Simcyp to 1) assess the impact of alterations in GFR, DT expression, and free fraction (fu), as well as TDIs, on PK predictions for metformin in RI populations; and 2) use available in vitro data to improve predictions of CLR for two OCT2/MATE1 substrates, metformin and ranitidine. Simulated data are compared with observed clinical data for these drugs in RI. These studies will identify significant changes in protein binding, GFR, and DT expression/activity that are consistent with in vitro and clinical data and predictive of the PK alterations of metformin and ranitidine in RI patients.
Materials and Methods
Model for Metformin in Simcyp.
Simulations were performed in Simcyp V15.1 simulator using the SV-metformin [3-(diaminomethylidene)-1,1-dimethylguanidine] substrate file. This model was developed and validated previously by Burt et al. (2016), the PBPK model scheme is presented in Supplemental Fig. 1, and parameter values are available in the previous publication (Burt et al., 2016). This file was modified with regards to MATE1/2-K (SLC47A) transport, since the compound file did not contain Jmax and KM for MATE1/2-K transport, only the CLint obtained from Ito et al. (2012). Estimations for Jmax and KM were obtained from this same publication for MATE1 based on the Eadie-Hofstee plots for metformin transport in human MATE1–transfected HEK293 cells (Ito et al., 2012). The data were normalized per microgram of protein and then transformed to per million cells (the units compatible with Simcyp) using the conversion 0.93 mg protein/106 HEK293 cells (Burt et al., 2016). An estimate for Jmax was obtained from the y-intercept of digitized data (3245 pmol/min per 106 cells), and KM was obtained from the negative slope of the data (306.2 pmol/µl). The estimates were used for MATE transport in the kidney, with the assumption that MATE1 transport would be dominant and, therefore, drive the apical transport of metformin. This assumption was tested by running simulations using the estimated Jmax/KM for metformin and MATE1, compared with using the provided CLint for metformin and MATE transport. The PK parameters agreed very well for both parameterizations; therefore, the estimated Jmax/KM for MATE1 was used for all simulations (Supplemental Table 1). This was done to allow for the manipulation of Jmax/KM to incorporate changes in DT expression and activity. The determined Jmax/KM was scaled to human kidney transport through the same relative activity factor determined by Burt et al. (2016) via fitting. A representation of metformin transport in the kidney is provided in Fig. 1.
Fig. 1.

Schematic representation of metformin transport in the kidney. OCT2 and MATE1 participate in the active secretion of metformin. Metformin is taken up from the blood via OCT2 and transported into the proximal tubule cell. Metformin is effluxed out of the proximal tubule cell via MATE1 and MATE2-K.
Renal clearance is a result of several processes, including renal filtration (CLRF or fuGFR), renal secretion (CLRS), and renal reabsorption (eq. 1). This study highlights the impact of mechanistic modification of the renal secretion component of CLR for compounds that are actively secreted, such as metformin and ranitidine.
| (1) |
Dose Dependency of CLR.
Simulations were performed utilizing both healthy and RI populations in Simcyp. Sim-Healthy Volunteers, Sim_RenalGFR_30-60 (moderate RI), and Sim_RenalGFR_less_30 (severe RI) populations were used to represent GFR of 100%, 50%, and 10%, respectively. Two sets of simulations were performed, in exclusively male and female populations, to determine if there was a sex-specific effect of RI as well. The doses used were 500, 1250, and 2000 mg.
Impact of DT Expression on CLR.
To assess the impact of DT expression on the CLR of metformin in the presence and absence of RI, simulations were performed with varying DT expression in healthy and RI populations. The same populations (healthy volunteers, Sim_RenalGFR_30-60, and Sim_RenalGFR_less_30) were used to represent healthy, moderate, and severe RI with approximate GFRs of 100%, 50%, and 10%, respectively. DT expression changes were incorporated in the model indirectly by altering transporter function via Jmax to reflect changes in protein expression (capacity). Both OCT2 and MATE1 were altered individually for each simulation by ±2- and ±5-fold. A single dose of 2000 mg of metformin was administered in a fasted state. Simulations were performed separately in exclusively male and female populations, with each simulation including 10 trials of 10 individuals.
Impact of TDI on RI-Induced Changes in CLR.
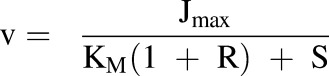
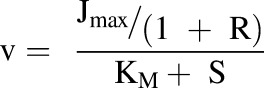
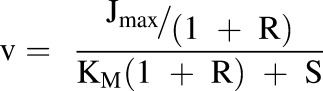
TDIs were incorporated into the model in the form of inhibition through the manipulation of Jmax and KM. This was done with the parameter R, which is defined as the ratio of the concentration of the inhibitor (I) to its inhibition constant (Ki) (eq. 2). This parameter was used to include competitive, noncompetitive, and uncompetitive inhibition in the model via eqs. 3–5, respectively:
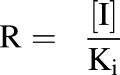 |
(2) |
 |
(3) |
 |
(4) |
 |
(5) |
R was varied from 0 to 100 to assess the impact of inhibition over a wide range of possible concentrations and potencies of inhibitors. Using this method, the degree of inhibition was constant throughout the simulation. This would be most relevant in the case of a TDI caused by a uremic toxin.
Simulations were performed with varying R values (0, 1, 10, and 100) for OCT2 and MATE1 separately. This resulted in four simulations being run for each transporter in each of the three populations representing varying renal function (Sim-healthy volunteers, Sim_RenalGFR_30-60, and Sim_RenalGFR_less_30). This set of 24 simulations was repeated for each type of inhibition. All simulations were performed for a single oral dose of 2000 mg of metformin administered in a fasted state, and simulations included 10 trials with 10 subjects in each. Simulations were performed separately for male and female populations.
Impact of fu on RI-Induced Changes in CLR with Varying DT Expression.
To assess the impact of potential changes in fu in RI populations, simulations were performed with metformin with varying degrees of fu, from 0.1 to 1. This was also assessed with varying degrees of DT (OCT2/MATE1) expression to establish the potential relationship between these two factors. As with the TDI simulations, a single oral dose of 2000 mg of metformin was administered in a fasted state; simulations included 10 trials with 10 subjects in each, and these were performed separately in male and female populations. Simulations were performed for varying fu values (0.1, 0.5, 0.9 and 1.0) for each population (Sim-healthy volunteers, Sim_RenalGFR_30-60, and Sim_RenalGFR_less_30), resulting in a set of 12 simulations. This set of simulations was repeated with varying DT expression by changing Jmax +/− 2- and +/−5-fold for OCT2 and MATE1 at the same time.
Impact of fu on RI-Induced Changes in CLR in the Presence and Absence of TDI.
The impact of varying fu was also investigated in the presence of TDI. As with the previously described TDI studies, competitive, noncompetitive, and uncompetitive inhibition was incorporated via the parameter R, as described through eqs. 2–5. Simulations were performed with Sim-healthy volunteers, Sim_RenalGFR_30-60, and Sim_RenalGFR_less_30 populations to represent GFRs of 100%, 50%, and 10%, respectively. Inhibition was incorporated into the simulations through manipulation of Jmax, KM, and Jmax/KM for each transporter separately. For each population, fu was varied (0.1, 0.5, 0.9, and 1.0) for each value of R (0, 1, 10, and 100) tested, leading to a total of 48 simulations per transporter. A dose of 2000 mg of metformin was administered in a fasted state to an exclusively male population; each simulation included 10 trials with 10 subjects in each. Simulations were not performed in a female population due to the observed similarity in trends and overall results between males and females.
Assessment of Clinical Relevance of RI Changes.
To assess whether the potential additional changes in RI, beyond a decrease in GFR, were important to predictions of PK in RI populations, simulations were performed with the available RI populations in Simcyp with additional changes supported by the literature. Literature references of clinical data in healthy and RI populations were used for comparison for metformin and ranitidine ((E)-1-N'-[2-[[5-[(dimethylamino)methyl]furan-2-yl]methylsulfanyl]ethyl]-1-N-methyl-2-nitroethene-1,1-diamine) (Sambol et al., 1995; Koch et al., 1997). For the clinical ranitidine reference, PK parameters from groups 2 and 3 were averaged to represent the moderate RI population. The same was done for groups 4 and 5 to represent the severe RI population. The observed area under the curve (AUC) for ranitidine was calculated as dose/total clearance (CL), and the amount excreted into urine (Ae) was calculated as the ratio of CLR to CL multiplied by dose. A previously developed compound file for ranitidine was used for simulations of ranitidine PK (Neuhoff, 2013). Simulations included five trials with five subjects each. For metformin, the reference did not state the proportion of female subjects in the study, and therefore, a reasonable proportion of 0.34 was chosen for these simulations (Sambol et al., 1995). For ranitidine, the reported proportion of females was used (0.17) (Koch et al., 1997). For both metformin and ranitidine simulations, age ranges were manipulated to match the reference. Relevant PK parameters were obtained from simulations and compared with observed values.
Changes reported in the literature relevant to metformin and ranitidine PK were then incorporated into the simulations, and PK parameters were obtained for comparison. The relevant changes included a decrease in OCT2 expression to 20% of its original value for both metformin and ranitidine. This reduction in expression is based on protein expression data obtained in adenine-induced Chronic renal failure (CRF) rat kidneys (Komazawa et al., 2013). Changes in organic anion transporter 3 (OAT3) were also included for ranitidine, as this transporter is also involved in the basolateral uptake of ranitidine in the kidney. OAT3 expression for ranitidine simulations was reduced to 10% of its original expression based on data from CRF rat kidneys (Komazawa et al., 2013). MATE1 expression was not reduced, as a transgenic mouse model of RI demonstrated no change in MATE1 mRNA in RI (Pedersen et al., 2016). OCT1 mediates metformin uptake into the liver (Burt et al., 2016). OCT1 expression was shown to decrease to 10% of its original expression in adenine-induced CRF rat kidneys. Although expression data were not available for OCT1 in the liver, simulations were performed to incorporate this reduction into OCT1 expression to investigate the impact of this transporter if hepatic and renal expression was affected in a similar manner by RI (Komazawa et al., 2013). Protein binding was not altered since both metformin and ranitidine are not extensively protein bound (Roberts, 1984; Burt et al., 2016).
Finally, TDI was included for OCT2, OAT3, and organic anion transporting polypeptide 1B3 (OATP1B3), a hepatic uptake transporter for ranitidine. This was based on available literature reports on potency of uremic toxins and the concentrations of these toxins in RI populations. Acrolein, a polyamine breakdown product and uremic toxin, was identified to inhibit OCT transport in vitro with a Ki of 93 ± 16 µM and demonstrated competitive or mixed-type inhibition (Schophuizen et al., 2013). The concentration of acrolein present in uremic populations has been reported to be 0.161 mM (total) or 1.35 µM (free). Based on these values, the R ([I]/Ki) would be 1.7 for total acrolein. An IC50 for creatinine inhibition of OCT2 has also been reported as 580 µM (Ciarimboli et al., 2012). The unbound concentration of creatinine in uremic patients is 1200 µM, and if IC50 is substituted for Ki, this would lead to an approximation of R of 2.0 (Hsueh et al., 2016). Therefore, competitive inhibition with an R of 2 was incorporated into the simulations as a potential TDI for OCT2.
For OAT3, several IC50 values have been identified for various uremic toxins, including creatinine (Hsueh et al., 2016). When compared with the concentrations of these toxins in uremic patients, the approximations of R were 1.3, 2.7, and 7.1 (Hsueh et al., 2016). For simplicity, competitive inhibition with an average R of 4 was incorporated into simulations as potential TDIs for OAT3. For hepatic uptake via OATP1B3, indoxyl sulfate has been demonstrated to inhibit methotrexate uptake in OATP1B3-expressing HEK293 cells (Sato et al., 2014). Sato et al. (2014) reported that indoxyl sulfate inhibited 40% of methotrexate transport at a concentration of 1000 µM. Since indoxyl sulfate has been reported to reach plasma concentrations as high as 940 µM, and if 1000 µM is approximated as the IC50 (this is the IC50 for the inhibition of methotrexate transport via OATP1B3 by indoxyl sulfate), this would lead to a possible approximation of R of 1 in RI populations (Vanholder et al., 2003; Sato et al., 2014). For this reason, competitive inhibition (R of 1) of ranitidine OATP1B3 hepatic uptake was investigated in this study. Other uremic toxins may be present in plasma concentrations that are greater than their IC50 or Ki values, resulting in potential TDIs. This study was intentionally limited to potential changes for which there is supporting literature.
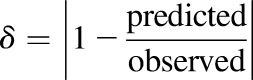
For metformin, the parameters assessed for improvement of prediction were time of maximal concentration (tmax), maximal concentration (Cmax), AUC, CLR, and Ae. For ranitidine, the parameters assessed for improvement of prediction were AUC, CL, CLR, and Ae. Improvement of prediction was based on the predicted/observed ratio for the mean parameter value. The absolute value of the difference between this ratio and 1 was determined (eq. 6) for each simulation, and is termed δ. This was computed for each parameter for each simulation; when δ was less than the value obtained with the base RI populations in Simcyp (Sim_RenalGFR_30-60 and Sim_RenalGFR_less_30), there was considered to be an improvement in the prediction of that parameter. As δ approaches 0, the predicted value approaches the observed value:
 |
(6) |
To assess the improvement in the overall prediction for a specific simulation, the δ for each parameter was summed and compared with the sum for the base RI populations. When the sum of δ for all parameters (Σδall) was less than Σδall for the base RI population, this was considered to be an improvement in the overall prediction. This was also assessed separately for the renal clearance parameters, CLR and Ae, as the sum of δ for CLR and Ae alone and is termed ΣδR. When the ΣδR for a particular simulation was less than ΣδR for the base RI population, this was considered to be an improvement in the prediction of renal clearance specifically. The results are discussed in terms of which conditions led to an improvement for each parameter, which conditions led to the three lowest Σδall, and which led to the lowest ΣδR.
Results
Dose Dependency of CLR.
The CLR of metformin did not exhibit dose dependency. CLR decreased as RI increased (i.e., GFR was decreased). There was an approximate 1.8-fold reduction in CLR when the severe RI population was used as opposed to the healthy population, regardless of dose (Fig. 2; Supplemental Table 2). Whereas values for CLR were slightly lower for females than males, the trend of the impact of RI, as well as the magnitude of the impact of changes, remained consistent for both sexes. Figures and tables regarding the results in females are provided for completeness in the supplemental information for all evaluations (Supplemental Figs. 5–8; Supplemental Tables 30–38).
Fig. 2.

Impact of RI on the dose dependency of metformin. Simulations were performed in Simcyp with oral metformin at 500, 1250, and 2000 mg. Simulations were performed in a male population with healthy and RI populations. Sim-healthy volunteers, Sim_RenalGFR_30-60, and Sim_RenalGFR_less_30 populations were used to represent GFRs of 100%, 50%, and 10%, respectively. Each simulation included 10 trials with 10 subjects in each.
Impact of DT Expression on CLR.
CLR increased as DT expression increased and decreased as DT expression decreased (Fig. 3; Supplemental Table 3). In a healthy population, when DT expression was increased 5-fold, CLR was increased 1.6-fold (Fig. 3; Supplemental Table 3). The impact of altering DT expression increased as renal function decreased. For a severe RI population, when DT expression was increased 5-fold, CLR was increased 2.2-fold (Fig. 3; Supplemental Table 3). When DT expression was decreased 5-fold in a healthy and severe RI population, CLR decreased 2.1- and 2.9-fold, respectively (Fig. 3; Supplemental Table 3).
Fig. 3.

Impact of RI and drug transporter expression on the renal clearance of metformin. Simulations were performed in Simcyp with Sim-healthy volunteers, Sim_RenalGFR_30-60, and Sim_RenalGFR_less_30 populations to represent GFRs of 100%, 50%, and 10%, respectively. A dose of 2000 mg of metformin was administered in a fasted state to an exclusively male population. Expression of OCT2 and MATE1 was changed by altering Jmax ±2- or ±5-fold. Each simulation included 10 trials with 10 subjects in each.
Impact of TDI on CLR.
The impact of all types of inhibition on the CLR of metformin was greater for OCT2 than for MATE1, and the results for noncompetitive inhibition are shown in Fig. 4. Competitive and noncompetitive inhibition yielded almost identical results for OCT2 inhibition, with maximum inhibition tested (R of 100) resulting in 4-, 6-, and 9-fold reductions in CLR for healthy, moderate, and severe RI populations, respectively (Fig. 4A; Supplemental Fig. 2A; Supplemental Tables 4 and 5). OCT2 uncompetitive inhibition had slightly greater effects compared with competitive and noncompetitive inhibition, with 4-, 7-, and 11-fold reductions in CLR for healthy, moderate, and severe RI populations, respectively (Supplemental Fig. 2B; Supplemental Table 6).
Fig. 4.

Effect of RI and inhibition on the renal clearance of metformin in males. Simulations were performed in Simcyp with Sim-healthy volunteers, Sim_RenalGFR_30-60, and Sim_RenalGFR_less_30 populations to represent GFRs of 100%, 50%, and 10%, respectively. A dose of 2000 mg of metformin was administered in a fasted state to an exclusively male population. Inhibition was incorporated through the parameter, R ([I]/Ki), which modified KM or Jmax for competitive and noncompetitive inhibition, respectively. R was varied from 0 to 100 to investigate varying levels of inhibition. Inhibition was applied to each transporter (OCT2/MATE1) separately. (A) Noncompetitive inhibition of OCT2. (B) Noncompetitive inhibition of MATE1. Each simulation included 10 trials with 10 subjects in each.
Competitive inhibition of MATE1 resulted in no change in CLR or any other PK parameter (Supplemental Fig. 2C; Supplemental Table 4). Noncompetitive inhibition had a slight effect, leading to 1.2-, 1.6-, and 2-fold reductions in CLR for healthy, moderate, and severe RI populations, respectively (Fig. 4B; Supplemental Table 5). As with OCT2, the effects of uncompetitive inhibition were slightly greater than those of noncompetitive inhibition, with reductions in CLR of 1.4-, 1.8-, and 2.2-fold for healthy, moderate, and severe RI populations (Supplemental Fig. 2D; Supplemental Table 6).
Impact of fu on RI-Induced Changes in CLR with Varying DT Expression.
When fu was increased from 0.1 to 1 in a healthy population, CLR of metformin increased 5.6-fold (Fig. 5A; Supplemental Table 7). The effect of increasing fu was slightly more pronounced as renal function decreased, with the moderate and severe RI populations resulting in 5.8- and 5.9-fold increases in CLR for the same change in fu (Fig. 5A; Supplemental Table 7). When DT expression was increased, the effect of fu on CLR was minimized. When DT expression was increased 5-fold and fu was increased from 0.1 to 1.0, CLR increased 2.7-, 3.0-, and 3.3-fold for healthy, moderate, and severe RI populations, respectively (Fig. 5C; Supplemental Table 8). Again, as renal function decreased, fu had a greater effect on CLR.
Fig. 5.

Effect of RI and fraction unbound on the renal clearance of metformin with varying expression of OCT2 and MATE1 in males. Simulations were performed in Simcyp with Sim-healthy volunteers, Sim_RenalGFR_30-60, and Sim_RenalGFR_less_30 populations to represent GFRs of 100%, 50%, and 10%, respectively. A dose of 2000 mg of metformin was administered in a fasted state to an exclusively male population. Fraction unbound was varied from 0.1 to 1.0. Expression of OCT2 and MATE1 was altered by increasing or decreasing Jmax 2- or 5-fold. (A) Original expression (Jmax) of OCT2/MATE1. (B and D) ±2-fold expression (Jmax) of OCT2/MATE1. (C and E) ±5-fold expression (Jmax) of OCT2/MATE1. Each simulation included 10 trials with 10 subjects in each.
When DT expression was decreased 5-fold, the effect of fu on CLR was magnified; for all degrees of RI, CLR was increased an average of 8-fold when fu was increased from 0.1 to 1.0 (Fig. 5E; Supplemental Table 9). When DT expression was decreased, unlike normal and increased expression, the effect of fu decreased slightly as renal function decreased. CLR increased 8.5-fold for the healthy population when fu increased from 0.1 to 1.0, but increases were slightly less (8.2- and 7.7-fold) for moderate and severe RI populations, respectively (Fig. 5E; Supplemental Table 9). Similar effects were observed when DT expression was altered ±2-fold (Fig. 5, B and D; Supplemental Tables 10 and 11).
Impact of fu on RI-Induced Changes in CLR in the Presence and Absence of TDI.
For both OCT2 and MATE1, the greatest reduction in CLR was observed with uncompetitive inhibition and when fu was minimal (Figs. 6 and 7; Supplemental Tables 12–17). As fu was increased, with the same degree of inhibition (R), the impact of inhibition of CLR was minimized. When fu was minimal (0.1), maximal uncompetitive inhibition of OCT2 (R of 100) led to reductions in CLR of metformin of 7-, 10-, and 15-fold for healthy, moderate, and severe RI populations (Fig. 6; Supplemental Tables 12–14). For the same degree of inhibition and renal impairment when fu was increased to its maximal value (1.0), CLR was reduced 4-, 7-, and 11-fold. For uncompetitive inhibition of MATE1, the reductions in CLR for healthy, moderate, and severe RI populations were 5.5-, 6.9-, and 7.7-fold when fu was minimal (0.1), and 1.4-, 1.7-, and 2.1-fold when fu was maximal (1.0) (Fig. 7; Supplemental Tables 15–17).
Fig. 6.

Effect of RI and fraction unbound on the renal clearance of metformin with accompanying inhibition of OCT2. Simulations were performed in Simcyp with Sim-healthy volunteers (A), Sim_RenalGFR_30-60 (B), and Sim_RenalGFR_less_30 (C) populations to represent GFRs of 100%, 50%, and 10%, respectively. A dose of 2000 mg of metformin was administered in a fasted state to an exclusively male population. Fraction unbound was varied from 0.1 to 1.0. R ([I]/Ki), which modified KM and Jmax for uncompetitive inhibition. R was varied from 0 to 100 to investigate varying levels of inhibition. Each simulation included 10 trials with 10 subjects in each.
Fig. 7.

Effect of RI and fraction unbound on the renal clearance of metformin with accompanying inhibition of MATE1. Simulations were performed in Simcyp with Sim-healthy volunteers (A), Sim_RenalGFR_30-60 (B), and Sim_RenalGFR_less_30 (C) populations to represent GFRs of 100%, 50%, and 10%, respectively. A dose of 2000 mg of metformin was administered in a fasted state to an exclusively male population. Fraction unbound was varied from 0.1 to 1.0. R ([I]/Ki), which modified KM and Jmax for uncompetitive inhibition. R was varied from 0 to 100 to investigate varying levels of inhibition. Each simulation included 10 trials with 10 subjects in each.
Competitive and noncompetitive inhibition yielded very similar results, and the trend with regard to fu was the same as uncompetitive inhibition. When fu was minimal (0.1), maximal competitive and noncompetitive inhibition of OCT2 (R of 100) led to 7-, 9-, and 13-fold reductions in CLR for healthy, moderate, and severe RI populations, respectively (Supplemental Fig. 3; Supplemental Tables 18–23). For the same type and degree of inhibition and degree of renal impairment, CLR was reduced 4-, 6-, and 9-fold when fu was maximal (1.0).
For MATE1, competitive inhibition did not impact CLR, regardless of changes in fu (Supplemental Fig. 4, A–C; Supplemental Tables 24–26). For noncompetitive and uncompetitive inhibition of MATE1, the same trend was observed where an increase in fu minimized the effect of inhibition on CLR (Fig. 7; Supplemental Fig. 4, D–F). Again, this effect was much more pronounced for uncompetitive inhibition than noncompetitive inhibition. For noncompetitive inhibition of MATE1, the reductions in CLR for healthy, moderate, and severe RI populations were 1.4-, 1.7-, and 2.2-fold when fu was minimal (0.1), and 1.2-, 1.5-, and 1.9-fold when fu was maximal (1.0) (Supplemental Fig. 4, D–F; Supplemental Tables 27–29).
Assessment of Clinical Relevance of RI changes.
For metformin, δ was lower for the majority of simulations that included additional changes in RI with respect to OCT2 and OCT1 expression and function compared with the simulations for the base RI populations (Supplemental Table 39; Table 1). The parameter for which there was the least improvement was Ae; this was true for both moderate and severe RI, but was more pronounced with severe RI (Supplemental Table 39; Table 1). This was due to the base severe RI population producing an accurate prediction of Ae with a δ of only 0.036 (Table 1). For both RI populations, inclusion of a modification in OCT2 transport resulted in the best overall prediction and prediction of renal clearance parameters (lowest Σδall and ΣδR, respectively). For moderate RI, the inclusion of a reduction in OCT2 expression to 20% of its original value resulted in the best predictions (4- and 10-fold reduction for Σδall and ΣδR, respectively), whereas inclusion of inhibition of OCT2 (R of 2), not an expression change, resulted in the best prediction for severe RI (3- and 6-fold reduction for Σδall and ΣδR, respectively) (Table 1). The improvements in prediction of observed clinical data are presented in Fig. 8, where the prediction by the base Simcyp RI population is plotted for both moderate and severe RI (Fig. 8, A and C). The most improved simulations, determined by the most improvement in parameter predictions given in Table 1, are plotted for moderate and severe RI (Fig. 8, B and D). While the observed data are not completely predicted, most notably there is an underprediction of later time points for all simulations, the inclusion of expression changes and inhibition of OCT2 does lead to an improvement of prediction for both RI populations.
TABLE 1.
Comparison of predicted and observed values for PK parameters for metformin
Simulation conditions are listed by rank order according to Σδall. δ is the absolute difference between one and the ratio of the predicted value of the parameter over the observed value, as defined by eq. 6 in the Materials and Methods section. Supplemental Table 39 provides actual parameter estimates as well as δ values.
| δ | Σδall | ΣδR | |||||
|---|---|---|---|---|---|---|---|
| tmax | Cmax | AUC | CLR | Ae | |||
| Healthy | |||||||
| Sim healthy volunteers | 0.191 | 0.007 | 0.172 | 0.162 | 0.062 | 0.595 | 0.224 |
| Moderate RI | |||||||
| Sim GFR 30–60 | 0.328 | 0.536 | 0.674 | 2.15 | 0.249 | 3.94 | 2.40 |
| OCT2 20% | 0.040 | 0.347 | 0.374 | 0.192 | 0.056 | 1.01 | 0.248 |
| OCT2 20% OCT2 R2 | 0.152 | 0.262 | 0.185 | 0.303 | 0.234 | 1.14 | 0.537 |
| OCT2 20% OCT1 10% | 0.248 | 0.150 | 0.038 | 0.191 | 0.524 | 1.15 | 0.715 |
| OCT2 20% OCT1 10% OCT2 R2 | 0.536 | 0.000 | 0.470 | 0.303 | 0.361 | 1.67 | 0.664 |
| OCT2 R2 | 0.136 | 0.403 | 0.477 | 0.631 | 0.048 | 1.69 | 0.679 |
| OCT1 10% OCT2 R2 | 0.088 | 0.243 | 0.197 | 0.631 | 0.565 | 1.72 | 1.20 |
| OCT1 10% | 0.232 | 0.439 | 0.559 | 2.15 | 0.654 | 4.04 | 2.81 |
| Severe RI | |||||||
| Sim GFR less than 30 | 0.282 | 0.463 | 0.563 | 1.10 | 0.036 | 2.45 | 1.14 |
| OCT2 R2 | 0.012 | 0.310 | 0.278 | 0.018 | 0.186 | 0.806 | 0.204 |
| OCT1 10% OCT2 R2 | 0.197 | 0.102 | 0.197 | 0.018 | 0.304 | 0.818 | 0.322 |
| OCT2 20% | 0.077 | 0.247 | 0.131 | 0.317 | 0.297 | 1.07 | 0.614 |
| OCT2 20% OCT1 10% | 0.347 | 0.008 | 0.608 | 0.318 | 0.248 | 1.53 | 0.566 |
| OCT2 20% OCT2 R2 | 0.167 | 0.160 | 0.133 | 0.644 | 0.487 | 1.59 | 1.13 |
| OCT1 10% | 0.162 | 0.341 | 0.377 | 1.10 | 0.428 | 2.41 | 1.53 |
| OCT2 20% OCT1 10% OCT2 R2 | 0.676 | 0.181 | 1.235 | 0.645 | 0.000 | 2.74 | 0.645 |
Fig. 8.

Metformin plasma profiles for observed and simulated renally impaired populations. Observed plasma concentrations for metformin were plotted (black dots) for both moderate (A and B) and severe (C and D) renally impaired populations following an 850-mg oral dose of metformin obtained from Sambol et al. (1995). The mean, 5th, and 95th percentile data from simulations with Simcyp were then overlaid with the observed data for comparison. Simulations were performed with demographics and study conditions to match Sambol et al. (1995). The pictured simulations include the base Simcyp RI population and the most improved simulation as determined by improvement in the prediction/observed values for parameters given in Table 1. (A) Sim_RenalGFR_30-60. (B) Sim_RenalGFR_30-60 with 20% OCT2 expression (compared with normal expression). (C) Sim_RenalGFR_less_30 (D) Sim_RenalGFR_less_30 with OCT2 inhibition of R2 (competitive). Each simulation included 10 trials with 10 subjects in each.
For ranitidine, inclusion of expression and activity changes for OCT2, OCT1, and OATP1B3 did result in some degree of improvement for both populations (Supplemental Table 40; Table 2). More improvement was observed for the severe RI population; δ was lower for the majority of simulations for severe RI populations when compared with the δ for the base RI population provided in Simcyp. Fewer improvements were observed for the moderate RI populations, as the base moderate RI population provided reasonably accurate estimates for the PK parameters. The greatest improvements for the moderate RI population were observed in the CLR and Ae parameters for ranitidine (Supplemental Table 40; Table 2). As with metformin, modification of the expression and activity of OCT2 led to the greatest improvements in CLR and Ae for ranitidine. The greatest improvement was seen with the inclusion of inhibition of OCT2 (R of 2), with a ΣδR of 0.142, followed by a decrease in the expression of OCT2 to 20% of its original value with a ΣδR of 0.187 (Table 2). These two conditions led to a decrease in ΣδR of over 4- and 3-fold when compared with the ΣδR for the base moderate RI population, respectively (Table 2). The greatest improvement in overall prediction of the PK parameters was observed with modification of OAT3, not OCT2. When OAT3 expression was reduced to 10% of its original value and inhibition was included (R of 4), the lowest value for Σδall was achieved. This set of conditions also led to a similar improvement in ΣδR, as was achieved with reduction of OCT2 expression, with a ΣδR of 0.188 (Table 2).
TABLE 2.
Comparison of predicted and observed values for PK parameters for ranitidine
Simulation conditions are listed by rank order according to Σδall. δ is the absolute difference between one and the ratio of the predicted value of the parameter over the observed value, as defined by eq. 6 in the Materials and Methods section. This table has been abbreviated to contain only the top-five simulations for each dose/RI combination. Supplemental Table 40 provides values for each simulation including actual parameter estimates as well as δ values.
| Dose |
δ |
Σδall | ΣδR | ||||
|---|---|---|---|---|---|---|---|
| AUC | CL | CLR | Ae | ||||
| mg | |||||||
| Healthy | |||||||
| Sim-healthy volunteers | 50 | 0.34 | 0.235 | 0.400 | 0.160 | 1.14 | 0.560 |
| Sim-healthy volunteers | 25 | 0.53 | 0.331 | 0.487 | 0.179 | 1.53 | 0.666 |
| Moderate RI | |||||||
| Sim GFR 30–60 | 50 | 0.083 | 0.090 | 0.360 | 0.256 | 0.789 | 0.616 |
| OAT3 10% OAT3 R4 | 50 | 0.083 | 0.075 | 0.060 | 0.128 | 0.346 | 0.188 |
| OAT3 10% | 50 | 0.067 | 0.060 | 0.090 | 0.140 | 0.357 | 0.230 |
| OAT3 R4 | 50 | 0.044 | 0.045 | 0.120 | 0.156 | 0.365 | 0.276 |
| OCT2 R2 | 50 | 0.139 | 0.120 | 0.066 | 0.076 | 0.401 | 0.142 |
| OCT2 20% | 50 | 0.206 | 0.170 | 0.167 | 0.020 | 0.563 | 0.187 |
| Severe RI | |||||||
| Sim GFR less than 30 | 50 | 0.423 | 0.692 | 3.95 | 2.27 | 7.33 | 6.22 |
| OCT2 20% OAT3 10% OCT2 R2 OAT3 R4 | 50 | 0.019 | 0.037 | 0.069 | 0.129 | 0.254 | 0.198 |
| OCT2 20% OAT3 10% OCT2 R2 | 50 | 0.006 | 0.019 | 0.059 | 0.254 | 0.338 | 0.313 |
| OCT2 20% OCT2 R2 OAT3 R4 | 50 | 0.035 | 0.019 | 0.221 | 0.396 | 0.671 | 0.617 |
| OCT2 20% OAT3 10% OAT3 R4 | 50 | 0.058 | 0.037 | 0.377 | 0.527 | 1.00 | 0.904 |
| OCT2 20% OAT3 10% | 50 | 0.079 | 0.065 | 0.500 | 0.621 | 1.27 | 1.12 |
| Sim GFR less than 30 | 25 | 0.396 | 0.670 | 20.3 | 11.5 | 32.9 | 31.8 |
| OCT2 20% OAT3 10% OCT2 R2 OAT3 R4 | 25 | 0.065 | 0.055 | 2.98 | 3.34 | 6.44 | 6.32 |
| OCT2 20% OAT3 10% OCT2 R2 | 25 | 0.039 | 0.028 | 3.52 | 3.82 | 7.41 | 7.34 |
| OCT2 20% OCT2 R2 OAT3 R4 | 25 | 0.009 | 0.000 | 4.19 | 4.37 | 8.57 | 8.56 |
| OCT2 20% OAT3 10% OCT2 R2 OAT3 R4 OATP1B3 R1 | 25 | 0.452 | 0.308 | 2.98 | 4.85 | 8.59 | 7.83 |
| OCT2 20% OAT3 10% OCT2 R2 OATP1B3 R1 | 25 | 0.413 | 0.289 | 3.52 | 5.46 | 9.69 | 8.98 |
For the severe RI population, nearly every simulation which included expression and activity changes for OCT2, OCT1, and OATP1B3 resulted in a reduction in δ for every parameter when compared with the base severe RI population δ (Supplemental Table 40; Table 2). The conditions that improved the Σδall and ΣδR were mainly identical between the two doses tested (50 and 25 mg). The lowest values for Σδall and ΣδR were achieved when the expression and activity of both OCT2 and OAT3 were reduced. Expression was reduced to 20% and 10% for OCT2 and OAT3, respectively, and inhibition was included for both transporters with an R of 2 and 4, respectively. When these changes were included, Σδall and ΣδR were both reduced by approximately 30- and 5-fold for the 50- and 25-mg doses, respectively, when compared with Σδall and ΣδR for the predictions obtained from the base severe RI population in Simcyp (Table 2). The next most accurate simulation was obtained with the same conditions, with the removal of the inhibition of OAT3. For this simulation, Σδall and ΣδR were both reduced by approximately 21- and 4-fold for the 50- and 25-mg doses, respectively, when compared with Σδall and ΣδR for the predictions obtained from the base severe RI population in Simcyp (Table 2). The most improved predictions are depicted in Fig. 9 for ranitidine. The base RI populations for moderate and severe RI provide a reasonable prediction of the ranitidine plasma profile; however, inclusion of additional conditions in RI did lead to an improvement in prediction for both RI populations. The predictions given by the Simcyp moderate and severe RI populations are given in Fig. 9, A and C, respectively. The most improved simulation, as indicated in Table 2, is plotted for moderate RI and includes a reduction in OAT3 expression to 10% of normal and competitive inhibition of OAT3 with an R of 4 (Fig. 9B). For severe RI, the most improved simulation included the same modification of OAT3 as with moderate RI (10% and R4 OAT3), along with a reduction in OCT2 expression (20% of normal) and competitive inhibition of OCT2 (R of 2) (Fig. 9D).
Fig. 9.

Ranitidine plasma profiles for observed and simulated renally impaired populations. Observed plasma concentrations for ranitidine were plotted (black dots) for both moderate (A and B) and severe (C and D) renally impaired populations following a 50-mg intravenous dose of ranitidine obtained from Koch et al. (1997). The mean, 5th, and 95th percentile data from simulations with Simcyp were then overlaid with the observed data for comparison. Simulations were performed with demographics and study conditions to match Koch et al. (1997). The pictured simulations include the base Simcyp RI population and the most improved simulation as determined by improvement in the prediction/observed values for parameters given in Table 2. (A) Sim_RenalGFR_30-60. (B) Sim_RenalGFR_30-60 with 10% OAT3 expression (compared with normal expression) and OAT3 inhibition of R4 (competitive). (C) Sim_RenalGFR_less_30. (D) Sim_RenalGFR_less_30 with 10% OAT3 expression (compared with normal expression), OAT3 inhibition of R4 (competitive), 20% OCT2 expression (compared with normal expression), and OCT2 inhibition of R2 (competitive). Each simulation included 10 trials with 10 subjects in each.
Discussion
RI is a major and growing health concern worldwide which can occur alone or can accompany a number of disease states (National Kidney Foundation, 2014; Hoerger et al., 2015). Although a decrease in GFR characterizes this disease state, numerous other changes can occur within RI that have the potential to alter the PK of compounds. These changes are of particular interest for drugs that are actively secreted in the kidney, as alterations in expression of major drug transporters in the kidney as well as inhibition of these transporters with accumulated uremic toxins in RI have been reported (Vanholder et al., 2003; Dreisbach and Lertora, 2008; Nolin et al., 2008; Naud et al., 2011; Ciarimboli et al., 2012; Komazawa et al., 2013; Schophuizen et al., 2013; Sato et al., 2014; Hsueh et al., 2016; Sauzay et al., 2016). Beyond changes in transporter expression and activity, changes in drug-metabolizing enzyme expression and activity as well as modifications in protein binding can occur in RI (Keller et al., 1984; Vanholder et al., 1988; Dreisbach and Lertora, 2008; Nolin et al., 2008; Naud et al., 2011). To assess the potential impact of these changes, this study used Simcyp and two well characterized model substrates which undergo active secretion in the kidney involving OCT2 and MATE1: metformin and ranitidine.
The impact of dose, DT expression, TDIs, and the impact of altering fu along with DT expression and TDIs were systematically investigated utilizing metformin to establish quantitative relationships for the impact of these factors on CLR and overall PK for metformin. Neither the dose of metformin nor the sex of individuals in the trials altered the impact of RI on the predictions of metformin PK. This is a significant finding, as any trends that are determined to be vital to the proper prediction of metformin PK in RI populations will not be affected by these factors.
As expected, renal DT expression had an impact on the CLR of metformin. As DT expression was decreased, there was an accompanying decrease in CLR of metformin, as the active secretion component of CLR was minimized. The impact was greater when renal function was reduced. This suggests that any observed changes in DT expression in RI populations will be an increasingly important factor in prediction of PK as renal function decreases. The same trend was seen with inhibition of OCT2 and MATE1: as renal function was decreased, the impact of the same degree of inhibition resulted in greater decreases in CLR. TDIs are likely to be more severe as renal function declines. The accumulation of uremic toxins occurs with declining renal function; therefore, the CLR may be more drastically reduced than expected, based on a reduction in GFR in RI populations, if interactions with uremic toxins occur with actively secreted compounds. It is also of note that the type of inhibition (competitive, noncompetitive, uncompetitive) did not lead to very different estimates of metformin PK, suggesting the type of inhibition is not a major factor in the determining the impact of TDIs on PK.
Overall, our simulations indicated that inhibition of OCT2 played a much larger role in metformin PK than inhibition of MATE1. This may suggest that OCT2 transport is the rate-limiting step in the active secretion of metformin. However, cimetidine, a more potent inhibitor of MATE1 than OCT2, has been shown to clinically alter the CLR of metformin (Somogyi et al., 1987; Wang et al., 2008). This discrepancy may be explained by investigating the interplay between metformin efflux via MATE1 and influx via OCT2. OCT2 is an electrogenic transporter, and reduction of metformin efflux has been shown to increase the concentration of metformin, thereby reducing the driving force for metformin uptake via OCT2 in the proximal tubule (Burt et al., 2016). Incorporation of the electrogenic nature of OCT2 results in an increase in metformin plasma concentrations when MATE1/2-K inhibition is included in simulations (Burt et al., 2016). This is consistent with our findings, using the conventional (nonelectrogenic) version of the metformin model in Simcyp, that OCT2 inhibition is an important predictor of CLR of metformin, and MATE1 inhibition, on its own, is not. MATE1 inhibition would likely prove to be more significant when its effect on OCT2 transport is incorporated.
RI may cause a decrease in protein binding due to uremia, hypoalbuminemia, or drug interactions (Keller et al., 1984). In this study, we varied fu from 0.1 to 1.0 to investigate the maximal effects of potential changes in fu, despite the fact that metformin is negligibly protein bound, even in healthy populations (Burt et al., 2016). As fu was increased, there was a large increase in CLR which was magnified as renal function decreased. This indicates that changes in fu may have a greater effect as RI progresses. When DT expression was increased, the effect of fu on CLR was minimized, whereas when DT expression was decreased, the effect of fu was magnified. This indicates that DT expression can modulate the effect of fu on CLR. In a case, such as metformin, where OCT2 is a major DT that contributes to its CLR, if OCT2 expression decreases, any changes in fu may be magnified and play a more significant role than if normal expression was expected.
For changes in fu with concurrent TDI, it was observed that an increase in fu minimized the impact of inhibition on reducing CLR. When maximal inhibition was included in the simulation, the reduction in CLR was reduced when fu was increased. This suggests that if a TDI is expected to occur in RI, the expected reduction in CLR may be overpredicted if the fu of the drug of interest is also increased in RI. Incorporation of changes in protein binding, when they are expected to be significant, may lead to more accurate predictions of overall PK and CLR.
To improve the predictions of PK in RI populations, in vitro data were incorporated into the model for both metformin and ranitidine. For these simulations, a reduction in the activity and expression of OCT2 was included for both metformin and ranitidine (Ciarimboli et al., 2012; Komazawa et al., 2013; Schophuizen et al., 2013). Alterations in MATE1 transport were not included in simulations for comparison with clinical data, as no change in mRNA was observed in a transgenic mouse model of RI (Pedersen et al., 2016). Alterations in OAT3 were also included in simulations for ranitidine, as this transporter is involved in the renal uptake of the compound (Komazawa et al., 2013; Hsueh et al., 2016). Inhibition of hepatic transport for metformin (OCT1) and ranitidine (OATP1B3) was also evaluated (Vanholder et al., 2003; Ciarimboli et al., 2012; Komazawa et al., 2013; Schophuizen et al., 2013; Sato et al., 2014).
For metformin, including modifications of OCT2 expression and activity led to the most accurate predictions of overall PK and of renal clearance parameters (CLR and Ae). For moderate RI, reducing OCT2 expression led to the most accurate prediction, whereas inhibiting OCT2 transport led to the most accurate predictions for severe RI.
For ranitidine, the base moderate RI population in Simcyp provided a reasonably accurate prediction of ranitidine overall PK; despite this, improvements were still observed with the inclusion of some of these additional changes, especially for the renal clearance parameters CLR and Ae. As with metformin, alterations in OCT2 expression and activity led to the two best predictions of CLR and Ae for moderate RI. However, alterations in OAT3 expression and activity led to the best predictions of overall PK. This suggests that the impact of alteration of OAT3, not OCT2, in RI may be more significant for ranitidine, at least when RI is still moderate. For the severe RI populations, inclusion of additional changes in DT expression and activity resulted in an almost universal improvement in prediction over the base severe RI population in Simcyp. The conditions for simulation which provided the most accurate predictions of overall PK and for CLR and Ae were identical for both doses and included a decrease in both OCT2 and OAT3 expression, as well as inhibition of both of these transporters. These results highlight the importance of including the impact of RI on OCT2 and OAT3 to produce accurate predictions of ranitidine PK. Due to the changes in transporter expression induced in RI, it is possible that some compensatory mechanisms occur. This possibility was not explored in the current study.
This study highlights the importance of understanding the impact of RI on CLR on a mechanistic level with regard to DT expression, TDIs, and fu in RI populations (Fig. 10). The most accessible way to obtain mechanistic information about these factors is through in vitro studies, and we have demonstrated the usefulness of these data in improving the predictions of CLR for two OCT2/MATE1 substrates, metformin and ranitidine, in clinical RI populations. This information will enable more accurate prediction of other OCT2/MATE1 substrates, and a similar approach may allow for more accurate predictions for substrates of other transporters.
Fig. 10.

Summary of the potential physiologic impact of RI on metformin and ranitidine. Simulations show that for the probe substrate metformin, a decrease in protein binding leads to an increase in CLR, whereas a decrease in GFR, DT expression, and TDIs all lead to a decrease in CLR. Inclusion of a decrease in DT expression and TDIs also leads to an improvement of clinical PK in RI populations for metformin and ranitidine.
Abbreviations
- AUC
area under the curve
- CLR
renal clearance
- CRF
chronic renal failure
- DT
drug transporter
- GFR
glomerular filtration rate
- MATE1
multidrug and toxin extrusion protein 1
- OAT3
organic anion transporter 3
- OATP1B3
organic anion transporting polypeptide 1B3
- OCT2
organic cation transporter 2
- PBPK
physiologically based pharmacokinetic model
- PK
pharmacokinetics
- RI
renal impairment
- TDI
toxin-drug interaction
Authorship Contributions
Participated in research design: Follman, Morris.
Conducted experiments: Follman.
Performed data analysis: Follman, Morris
Wrote or contributed to the writing of the manuscript: Follman, Morris.
Footnotes
This work was supported by the National Institutes of Health National Institute on Drug Abuse [Grant R01DA023223]. K.E.F. was supported in part by a fellowship from Bristol-Myers Squibb.
 This article has supplemental material available at dmd.aspetjournals.org.
References
- Burt HJ, Neuhoff S, Almond L, Gaohua L, Harwood MD, Jamei M, Rostami-Hodjegan A, Tucker GT, Rowland-Yeo K. (2016) Metformin and cimetidine: physiologically based pharmacokinetic modelling to investigate transporter mediated drug-drug interactions. Eur J Pharm Sci 88:70–82. [DOI] [PubMed] [Google Scholar]
- Ciarimboli G, Lancaster CS, Schlatter E, Franke RM, Sprowl JA, Pavenstädt H, Massmann V, Guckel D, Mathijssen RH, Yang W, et al. (2012) Proximal tubular secretion of creatinine by organic cation transporter OCT2 in cancer patients. Clin Cancer Res 18:1101–1108. [DOI] [PMC free article] [PubMed] [Google Scholar]
- Dixon JS, Borg-Costanzi JM, Langley SJ, Lacey LF, Toon S. (1994) The effect of renal function on the pharmacokinetics of ranitidine. Eur J Clin Pharmacol 46:167–171. [DOI] [PubMed] [Google Scholar]
- Dreisbach AW, Lertora JJ. (2008) The effect of chronic renal failure on drug metabolism and transport. Expert Opin Drug Metab Toxicol 4:1065–1074. [DOI] [PMC free article] [PubMed] [Google Scholar]
- FDA (2010) Guidance for Industry Pharmacokinetics in Patients with Impaired Renal Function — Study Design, Data Analysis, and Impact on Dosing and Labeling, U.S. Department of Health and Human Services Food and Drug Administration, Silver Spring, MD. [Google Scholar]
- FDA (2012) Drug interaction studies-study design, data analysis, implications for dosing, and labeling recommendations, U.S. Department of Health and Human Services Food and Drug Administration, Silver Spring, MD.
- Garg DC, Baltodano N, Jallad NS, Perez G, Oster JR, Eshelman FN, Weidler DJ. (1986) Pharmacokinetics of ranitidine in patients with renal failure. J Clin Pharmacol 26:286–291. [DOI] [PubMed] [Google Scholar]
- Gusler G, Gorsline J, Levy G, Zhang SZ, Weston IE, Naret D, Berner B. (2001) Pharmacokinetics of metformin gastric-retentive tablets in healthy volunteers. J Clin Pharmacol 41:655–661. [DOI] [PubMed] [Google Scholar]
- Hacker K, Maas R, Kornhuber J, Fromm MF, Zolk O. (2015) Substrate-dependent inhibition of the human organic cation transporter OCT2: a comparison of metformin with experimental substrates. PLoS One 10:e0136451. [DOI] [PMC free article] [PubMed] [Google Scholar]
- Hoerger TJ, Simpson SA, Yarnoff BO, Pavkov ME, Ríos Burrows N, Saydah SH, Williams DE, Zhuo X. (2015) The future burden of CKD in the United States: a simulation model for the CDC CKD initiative. Am J Kidney Dis 65:403–411. [DOI] [PMC free article] [PubMed] [Google Scholar]
- Hsueh CH, Yoshida K, Zhao P, Meyer TW, Zhang L, Huang SM, Giacomini KM. (2016) Identification and quantitative assessment of uremic solutes as inhibitors of renal organic anion transporters, OAT1 and OAT3. Mol Pharm 13:3130–3140. [DOI] [PubMed] [Google Scholar]
- Inker LA, Astor BC, Fox CH, Isakova T, Lash JP, Peralta CA, Kurella Tamura M, Feldman HI. (2014) KDOQI US commentary on the 2012 KDIGO clinical practice guideline for the evaluation and management of CKD. Am J Kidney Dis 63:713–735. [DOI] [PubMed] [Google Scholar]
- Ito S, Kusuhara H, Yokochi M, Toyoshima J, Inoue K, Yuasa H, Sugiyama Y. (2012) Competitive inhibition of the luminal efflux by multidrug and toxin extrusions, but not basolateral uptake by organic cation transporter 2, is the likely mechanism underlying the pharmacokinetic drug-drug interactions caused by cimetidine in the kidney. J Pharmacol Exp Ther 340:393–403. [DOI] [PubMed] [Google Scholar]
- Katsube Y, Tsujimoto M, Koide H, Ochiai M, Hojyo A, Ogawa K, Kambara K, Torii N, Shima D, Furukubo T, et al. (2017) Cooperative inhibitory effects of uremic toxins and other serum components on OATP1B1-mediated transport of SN-38. Cancer Chemother Pharmacol 79:783–789. [DOI] [PubMed] [Google Scholar]
- Keller F, Maiga M, Neumayer HH, Lode H, Distler A. (1984) Pharmacokinetic effects of altered plasma protein binding of drugs in renal disease. Eur J Drug Metab Pharmacokinet 9:275–282. [DOI] [PubMed] [Google Scholar]
- Koch KM, Liu M, Davis IM, Shaw S, Yin Y. (1997) Pharmacokinetics and pharmacodynamics of ranitidine in renal impairment. Eur J Clin Pharmacol 52:229–234. [DOI] [PubMed] [Google Scholar]
- Komazawa H, Yamaguchi H, Hidaka K, Ogura J, Kobayashi M, Iseki K. (2013) Renal uptake of substrates for organic anion transporters Oat1 and Oat3 and organic cation transporters Oct1 and Oct2 is altered in rats with adenine-induced chronic renal failure. J Pharm Sci 102:1086–1094. [DOI] [PubMed] [Google Scholar]
- National Kidney Foundation (2014) About Chronic Kidney Disease, National Kidney Foundation, New York. [Google Scholar]
- Naud J, Michaud J, Beauchemin S, Hébert MJ, Roger M, Lefrancois S, Leblond FA, Pichette V. (2011) Effects of chronic renal failure on kidney drug transporters and cytochrome P450 in rats. Drug Metab Dispos 39:1363–1369. [DOI] [PubMed] [Google Scholar]
- Neuhoff S. (2013) A dynamic physiologically-based pharmacokinetic model for Ranitidine – including permeability-limited submodels for liver and kidney. Certara, Princeton, NJ.
- Nigam SK, Wu W, Bush KT, Hoenig MP, Blantz RC, Bhatnagar V. (2015) Handling of drugs, metabolites, and uremic toxins by kidney proximal tubule drug transporters. Clin J Am Soc Nephrol 10:2039–2049. [DOI] [PMC free article] [PubMed] [Google Scholar]
- Nolin TD, Naud J, Leblond FA, Pichette V. (2008) Emerging evidence of the impact of kidney disease on drug metabolism and transport. Clin Pharmacol Ther 83:898–903. [DOI] [PubMed] [Google Scholar]
- Pedersen L, Jensen JB, Wogensen L, Munk OL, Jessen N, Frøkiær J, Jakobsen S. (2016) Renal PET-imaging with (11)C-metformin in a transgenic mouse model for chronic kidney disease. EJNMMI Res 6:54. [DOI] [PMC free article] [PubMed] [Google Scholar]
- Roberts CJ. (1984) Clinical pharmacokinetics of ranitidine. Clin Pharmacokinet 9:211–221. [DOI] [PubMed] [Google Scholar]
- Rowland M, Lesko LJ, Rostami-Hodjegan A. (2015) Physiologically based pharmacokinetics is impacting drug development and regulatory decision making. CPT Pharmacometrics Syst Pharmacol 4:313–315. [DOI] [PMC free article] [PubMed] [Google Scholar]
- Sambol NC, Chiang J, Lin ET, Goodman AM, Liu CY, Benet LZ, Cogan MG. (1995) Kidney function and age are both predictors of pharmacokinetics of metformin. J Clin Pharmacol 35:1094–1102. [DOI] [PubMed] [Google Scholar]
- Sato T, Yamaguchi H, Kogawa T, Abe T, Mano N. (2014) Organic anion transporting polypeptides 1B1 and 1B3 play an important role in uremic toxin handling and drug-uremic toxin interactions in the liver. J Pharm Pharm Sci 17:475–484. [DOI] [PubMed] [Google Scholar]
- Sauzay C, White-Koning M, Hennebelle I, Deluche T, Delmas C, Imbs DC, Chatelut E, Thomas F. (2016) Inhibition of OCT2, MATE1 and MATE2-K as a possible mechanism of drug interaction between pazopanib and cisplatin. Pharmacol Res 110:89–95. [DOI] [PubMed] [Google Scholar]
- Schophuizen CM, Wilmer MJ, Jansen J, Gustavsson L, Hilgendorf C, Hoenderop JG, van den Heuvel LP, Masereeuw R. (2013) Cationic uremic toxins affect human renal proximal tubule cell functioning through interaction with the organic cation transporter. Pflugers Arch 465:1701–1714. [DOI] [PubMed] [Google Scholar]
- Somogyi A, Stockley C, Keal J, Rolan P, Bochner F. (1987) Reduction of metformin renal tubular secretion by cimetidine in man. Br J Clin Pharmacol 23:545–551. [DOI] [PMC free article] [PubMed] [Google Scholar]
- Tucker GT, Casey C, Phillips PJ, Connor H, Ward JD, Woods HF. (1981) Metformin kinetics in healthy subjects and in patients with diabetes mellitus. Br J Clin Pharmacol 12:235–246. [DOI] [PMC free article] [PubMed] [Google Scholar]
- Vanholder R, De Smet R, Glorieux G, Argilés A, Baurmeister U, Brunet P, Clark W, Cohen G, De Deyn PP, Deppisch R, et al. European Uremic Toxin Work Group (EUTox) (2003) Review on uremic toxins: classification, concentration, and interindividual variability. Kidney Int 63:1934–1943. [DOI] [PubMed] [Google Scholar]
- Vanholder R, Van Landschoot N, De Smet R, Schoots A, Ringoir S. (1988) Drug protein binding in chronic renal failure: evaluation of nine drugs. Kidney Int 33:996–1004. [DOI] [PubMed] [Google Scholar]
- Wang ZJ, Yin OQ, Tomlinson B, Chow MS. (2008) OCT2 polymorphisms and in-vivo renal functional consequence: studies with metformin and cimetidine. Pharmacogenet Genomics 18:637–645. [DOI] [PubMed] [Google Scholar]
- Zech PY, Chau NP, Pozet N, Labeeuw M, Hadj-Aissa A. (1983) Ranitidine kinetics in chronic renal impairment. Clin Pharmacol Ther 34:667–672. [DOI] [PubMed] [Google Scholar]