Abstract
The MODIS Level-2 cloud product (Earth Science Data Set names MOD06 and MYD06 for Terra and Aqua MODIS, respectively) provides pixel-level retrievals of cloud-top properties (day and night pressure, temperature, and height) and cloud optical properties (optical thickness, effective particle radius, and water path for both liquid water and ice cloud thermodynamic phases–daytime only). Collection 6 (C6) reprocessing of the product was completed in May 2014 and March 2015 for MODIS Aqua and Terra, respectively. Here we provide an overview of major C6 optical property algorithm changes relative to the previous Collection 5 (C5) product. Notable C6 optical and microphysical algorithm changes include: (i) new ice cloud optical property models and a more extensive cloud radiative transfer code lookup table (LUT) approach, (ii) improvement in the skill of the shortwave-derived cloud thermodynamic phase, (iii) separate cloud effective radius retrieval datasets for each spectral combination used in previous collections, (iv) separate retrievals for partly cloudy pixels and those associated with cloud edges, (v) failure metrics that provide diagnostic information for pixels having observations that fall outside the LUT solution space, and (vi) enhanced pixel-level retrieval uncertainty calculations. The C6 algorithm changes collectively can result in significant changes relative to C5, though the magnitude depends on the dataset and the pixel’s retrieval location in the cloud parameter space. Example Level-2 granule and Level-3 gridded dataset differences between the two collections are shown. While the emphasis is on the suite of cloud optical property datasets, other MODIS cloud datasets are discussed when relevant.
Index Terms: Aqua, cloud remote sensing, clouds, Moderate Resolution Imaging Spectroradiometer (MODIS), MOD06, MYD06, Terra, satellite applications, terrestrial atmosphere
I. Introduction
Since the launch of NASA’s Terra satellite on 18 December 1999, followed by Aqua on 4 May 2002, the Moderate-resolution Imaging Spectroradiometer (MODIS) has become one of the most widely used satellite remote sensing platforms for Earth science investigations. Designed to provide global observations of the Earth’s atmosphere, land, and oceans [1]–[4], MODIS measures reflected solar and emitted thermal radiation in 36 spectral channels ranging from the visible (VIS) to the infrared (IR) at a native spatial resolution of 250 m (0.66 and 0.87 μm channels), 500 m (five channels including 3 shortwave-infrared [SWIR]), and 1 km (all others). MODIS provides unique spectral and spatial capabilities for retrieving cloud properties. The NASA operational cloud product (Earth Science Data Set names MOD06 and MYD06 for Terra and Aqua MODIS, respectively, though for simplicity the modifier MOD will subsequently be used for both Terra and Aqua since the respective algorithms are nearly identical) [5] contains pixel-level retrievals of cloud top properties (pressure, temperature, and height during both day and night) and cloud optical and microphysical properties (cloud optical thickness [COT], effective particle radius [CER], and derived water path [CWP] for both liquid water and ice cloud thermodynamic phases during daytime only) (see [6]).
The cloud top properties algorithm, which relies on CO2-slicing channels (13–14 μm spectral region) and two IR window channels [7]–[8], has heritage with the High resolution Infrared Radiation Sounder (HIRS) (see [9]); spatial resolution is at both 5 km and 1 km for C6. The 1 km cloud optical and microphysical product algorithm makes primary use of six VIS, near-infrared (NIR), SWIR, and midwave-infrared (MWIR) MODIS channels, as well as several thermal IR channels. Relative to previous generation global imagers such as the Advanced Very High Resolution Radiometer (AVHRR), MODIS has a number of additional spectral channels, including window channels centered near 1.6 and 2.1 μm that, in addition to an AVHRR heritage channel near 3.7 μm, provide cloud microphysical information. The basic physical principle behind the simultaneous retrieval of COT and CER is the bi-spectral solar reflectance method first described in [10] and applied to airborne data. MOD06-specific heritage work is also described in [11] and [12] (microphysical retrievals using the AVHHR 3.7 μm channel), [13] (1.6–2.1 μm retrievals over snow/ice surfaces), and thermodynamic phase retrievals [14].
MODIS (re)processing streams are referred to as data collections. A major increment in the collection number denotes comprehensive changes to the instrument calibration and science algorithms. Collection 5 (C5) was completed in calendar year 2006, while a reprocessing to C5.1 was completed in calendar year 2010. MODIS Atmosphere Team Collection 6 (C6) Aqua Level-2 (L2), or pixel-level, reprocessing began in December 2013 and was completed in early May 2014 (data acquisition dates 4 July 2002 through 31 December 2013); Aqua forward processing began on 1 January 2014. Atmosphere Team C6 Terra L2 reprocessing began in November 2014 and was completed in March 2015 (data acquisition dates 24 January 2000 through 31 December 2014); Terra forward processing began on 1 January 2015. Atmosphere Team Level-3 (L3) (re)processing for Terra and Aqua began in October 2014 and was completed in March 2015.
Basic MOD06 optical property algorithm details are described in the C5 Algorithm Theoretical Basis Document (ATBD) addendum [15] and original ATBD [16]. An overview of the MODIS cloud product algorithms (at the time of Collection 4) along with example results is provided in [16] and [17]. Collection 5 algorithm-related work is described in various publications, e.g., ice radiative models [18]–[19], multilayer cloud detection [20]–[21], Clear Sky Restoral filtering [22]–[23], pixel-level retrieval uncertainties [24], and global aggregated statistics [25]. Evaluation-specific investigations include cloud phase [26]–[27], view angle biases [28]–[30], and the impacts of non-plane-parallel clouds [22], [31]–[32].
Due to the significant number of algorithm and dataset changes implemented in the latest collection, an overview paper of the C6 MOD06 cloud optical and microphysical property product is warranted. Here we focus on key changes with respect to C5 and the resulting impact to granule-level and global cloud property statistics. The MOD06 cloud optical and microphysical retrieval algorithm is numerically intensive, depending on explicit forward radiative calculations for cloud, gas, and surface interactions. Updates for C6 are representative of evolving passive imager cloud retrieval science as spectral information from MODIS and other capable sensors continues to be explored (e.g., synergistic A-Train [33] studies have provided important constraints on ice particle radiative models [34]). Meanwhile, the climate modeling community continues to improve its ability to exploit the product (see [23]) and cloud assessment reports [35]–[36] acknowledge the challenges in establishing cloud climate data records. Note that the MOD06 product should not be confused with a separate MODIS cloud product developed specifically for Clouds and the Earth’s Radiant Energy System (CERES) processing [37, 38]; comparisons between many CERES Edition-2 and MODIS C5 products are given in [38].
II. Summary of Collection 6 Updates
The C6 MOD06 cloud property product is the culmination of extensive multi-year development and testing. While the theoretical basis of the retrievals remains unchanged from C5, numerous algorithm updates and enhancements have been implemented that increase algorithm sophistication and performance. Note that only updates to the cloud optical and microphysical property retrievals are discussed here; updates to the cloud top property and IR-derived thermodynamic phase algorithms, including the new native 1 km resolution retrievals, are detailed in Baum et al. [8]. Notable updates to the optical and microphysical property retrievals include:
Radiative transfer and look-up table (LUT) improvements that reduce algorithm complexity and maintenance by eliminating the use of asymptotic theory, reduce linear interpolation errors by optimizing LUT grid point locations and separating the single and multiple scattering components, and include a new single-habit ice cloud radiative model based on the severely roughened aggregate of solid columns [39] that has been shown to provide better retrieval consistency with IR and lidar-based COT retrievals [34].
A redesigned cloud thermodynamic phase algorithm, based on a variety of independent tests with assigned weights, that provides improved skill in comparison with collocated lidar and polarimeter-based phase products.
Separate spectral retrievals of COT, CER, and derived CWP for channel combinations that include the 1.6, 2.1, and 3.7 μm channels that allow for independent Level-3 aggregation and ease retrieval inter-comparisons.
Separate Science Data Sets (SDSs) for lower quality scenes identified by C5-like Clear Sky Restoral algorithms (see [22]) that flag pixels not expected to be overcast (referred to as “partly cloudy” retrievals), a 1 km sub-pixel 250 m reflectance heterogeneity index, and an updated multilayer cloud detection scheme [40], [20]–[21]; this information can be used for improved retrieval quality assessment.
Retrieval failure metrics that provide diagnostic information for pixels where the reflectance observations fall outside the LUT solution space.
Improved pixel-level retrieval uncertainty estimates that include scene-dependent L1B uncertainties [41], cloud model and surface albedo error sources (cloud effective variance, ocean surface wind speed and direction), and 3.7 μm emission error sources; note these uncertainties do not include estimates of 3D radiative transfer biases or ice habit model error sources.
Updated handling of surface reflectance, including a new dynamic 8-day sampling surface spectral albedo dataset derived from gap-filled C5 Aqua+Terra MODIS data (MCD43B3, Schaaf et al. [42]), adoption of land spectral emissivities consistent with the cloud-top property algorithm [43], and wind speed interpolated bidirectional reflectance properties of water surfaces based on the parameterization of Cox and Munk [44].
A new L1B re-aggregation scheme for Aqua MODIS that accounts for focal plane misalignment between the 250 m resolution channels (0.66 and 0.87 μm) and the 500 m resolution channels (0.47, 0.55, 1.24, 1.6, and 2.1 μm); note that all maintained atmospheric products for Aqua MODIS use the new re-aggregated L1B, including the Dark Target [45] and enhanced Deep Blue [46] aerosol products.
A more detailed discussion of the C6 MOD06 cloud optical and microphysical property retrieval algorithm is provided in Section III below (note that the above lettering scheme is consistent with Section III organization), followed by a discussion of the impacts of the C6 updates on the Level-3 global gridded cloud property statistics and best-practice guidance for MOD06 product users.
III. C6 Algorithm Details
A. Cloud Radiative Models
The simultaneous retrieval of cloud optical thickness (COT) and effective particle radius (CER) can be achieved by simultaneously measuring the cloud reflectance in two spectral channels having a different amount of cloud particle absorption (e.g., VIS/NIR and SWIR, respectively) and comparing the measurements with theoretical forward model calculations, as demonstrated with airborne data [10] (see also [47]–[53], [11]–[12]). For previous MOD06 collections (C5 and earlier), the theoretical forward model calculations used asymptotic theory ([10], [51] and references therein) for optically thick atmospheres, coupled with a forward calculated LUT containing spectral cloud reflectance and fluxes at four discrete optically thin COT values. For C6, asymptotic theory has been replaced with cloud reflectance and emissivity LUTs containing the complete range of COT values. This change simplifies code maintenance such that multiple algorithm paths for optically thin and optically thick atmospheres, followed by interpolation between them, are no longer required; in addition, more optically thin COTs are included in the new LUTs. Note that for optically thick atmospheres, the resulting reflectance computations are the same as those obtained from asymptotic theory.
For the C6 LUTs, cloud top reflectance is calculated for six spectral channels, namely the non-absorbing 0.66, 0.86, and 1.24 μm channels that are primarily sensitive to COT, and the absorbing 1.6, 2.1, and 3.7 μm channels sensitive to CER. Effective cloud and surface emissivities [12] are also calculated for the 3.7 μm channel, whose TOA radiance has both solar and thermal components due to its location in the MWIR. The plane-parallel discrete-ordinates radiative transfer (DISORT) algorithm [54] is used for the forward RT calculations, ignoring above-cloud atmospheric gaseous absorption in all channels and above-cloud Rayleigh scattering in the 0.66 μm channel; these effects are included on a pixel-level basis during the retrieval process. For calculations over land, a non-reflecting Lambertian surface is assumed. Over oceans, the angular dependence of the ocean surface BRDF is defined as a function of wind speed using the parameterization of [44]. This treatment of ocean surface BRDF is an improvement over C5, which assumed the ocean as a Lambertian surface with a spectrally flat 0.05 albedo (appropriate for diffuse ocean reflectance).
In addition to cloud reflectance (and emissivity as needed), the reflected flux, transmitted flux, and spherical albedo for the above six channels, as well as for the thermal IR channel centered at 11 μm, are also computed and included in the land LUT for use with a pixel-level Lambertian surface albedo dataset that is incorporated during the retrieval process. The C6 ocean LUTs also contain effective surface and cloud emissivities for the 3.7 and 11 μm channels, the latter needed for modifying low cloud MOD06 cloud top temperature retrievals by accounting for non-unity cloud emissivity. While the cloud top properties algorithm [8] retrieves low cloud properties assuming unity emissivity in the infrared window, the optical property algorithm iterates on that solution using cloud emissivities calculated from the cloud optical thickness retrieval and without regard to potential non-unity cloud fraction within the pixel (see Clear Sky Restoral discussion in Section III.D). Effective emissivity calculations in both spectral channels follow the approach described in [12]. For the land LUTs, effective emissivities are calculated from forward-modeled flux and spherical albedo data. The LUT parameters are stored as a function of a defined range of COT, CER, and observation angle geometry (i.e., cosines of the solar [μ0] and sensor [μ] zenith angles, and relative azimuth [Δφ]), as well as surface wind speed for the ocean LUTs. Note that the ocean LUTs do not explicitly account for wind direction; LUT values are averages of RT calculations at the four principal wind directions, i.e., 0°, 90°, 180°, and 270° relative azimuth. Details of these defined ranges are provided in Table I. A minimum ice effective particle radius of 5 μm has continued to be used for consistency with C5 [18] and because retrievals below this value are relatively infrequent.
Table I.
Range of Values of Look up Table (LUT) Parameters
| Variable | Number of Grid Points | Range |
|---|---|---|
| COT | 34 | [0, 159] |
| CER (μm) | ||
| liquid water | 18 | [2, 30] |
| ice | 12 | [5, 60] |
| μ0 | 33 | [0.15, 1.0] |
| μ | 28 | [0.4, 1.0] |
| Δφ | 37 | [0°, 180°] |
| u (m·s−1) | 3 | [3, 7, 15] |
To minimize angular interpolation errors, only the multiple scattering (MS) component of the cloud top reflectance (R) is calculated and stored in the LUTs; the single scattering (SS) component is calculated during the retrieval process from the exact phase function using pixel-level geometric information, and is added dynamically to the interpolated MS component. For example, at a particular sun-satellite geometry, the SS part of the bidirectional reflectance (Rss) is calculated from the phase function (PF), such that
| (1) |
where τ’ = (1−f ω0) τ, re denotes CER, Θ is the scattering angle, f is the phase function truncation factor (i.e., the fraction of photons in the phase function forward peak due to diffraction), and ω0 is the single scattering albedo. The total cloud top reflectance is then found by adding RSS to the MS reflectance component that is interpolated from the LUTs. MS and total reflectance (MS + SS) at 0.66 μm as a function of sensor zenith angle in the forward and backscattered directions is shown in Fig. 1 for an example (a) liquid and (b) ice phase cloud. It is evident that the MS part of the reflectance (blue lines) is a smoother function compared to the total (MS + SS) reflectance (red lines), thus the angular features of the total reflectance arise from the SS component, and calculating the exact SS component minimizes LUT interpolation errors.
Fig. 1.

Total (red line) and multiple scattering (blue line) cloud top reflectance for MODIS channel 1 (0.66 μm) for (a) liquid water clouds with CER = 10 μm, and (b) ice clouds (severely roughened aggregated columns) with CER = 60 μm; all calculations assume COT = 4.14 and μ0 = 0.8125. The multiple scattering component is much smoother than the total reflectance that includes single plus multiple scattering.
In addition to separating the MS and SS reflectance components, the COT, μ, and μ0 LUT grid point spacing are also optimized to further minimize interpolation errors. For μ and μ0, LUT grid point spacing for C6 is 0.05 at μ and μ0 values less than 0.75, and 0.0125 for values between 0.75 and 1.0. Analysis of this discretization scheme has shown that typical full reflectance LUT interpolation errors averaged over all COT, CER, and relative azimuth are on the order of 0.1 – 0.2% reflectance. Furthermore, compared to other μ and μ0 discretization schemes considered during C6 development, this scheme also yields the smallest maximum interpolation error for the MS reflectance component, in particular at nadir (μ = 1), as shown by the polar plots in Fig. 2. Here, the maximum interpolation error at μ0= 0.725 for (a) an ice cloud with COT = 4.14 and CER = 30 μm, and (b) a liquid water cloud with COT = 4.14 and CER = 10 μm, is shown for three μ discretization schemes, namely the scheme selected for C6 (right column) as well as schemes with grid spacing of 0.05 (left column) and 0.025 (center column) across all μ. Note the sensor zenith μ varies from 1.0 at the center of each plot to 0.4 at plot edge, and the relative azimuth varies clockwise around each plot from 0 to 360°.
Fig. 2.
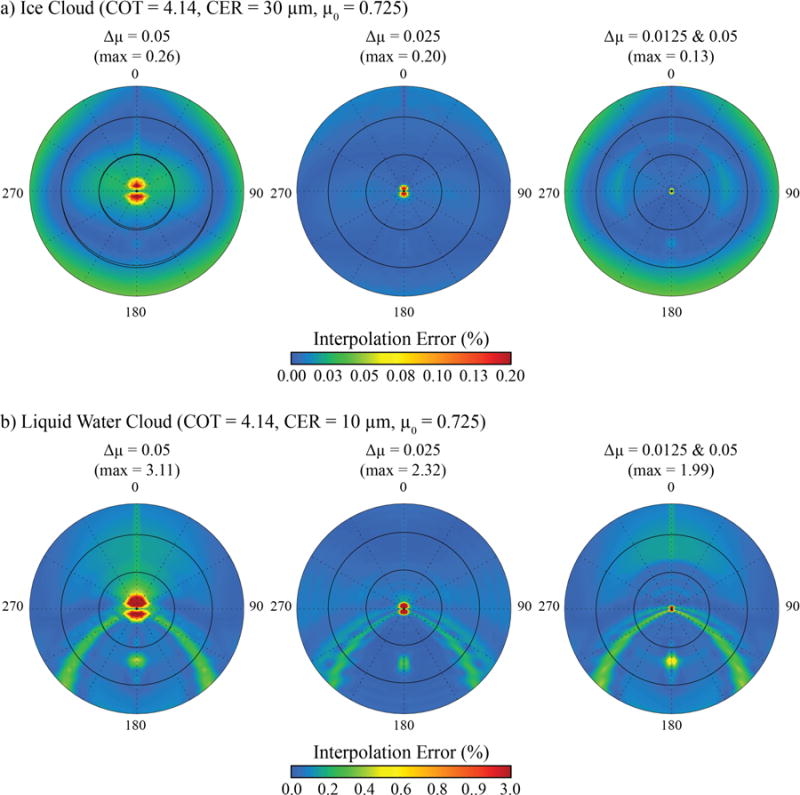
Maximum multiple scattering reflectance interpolation error for COT = 4.14 and μ0 = 0.725 for (a) ice clouds with CER = 30 μm (severely roughened aggregated columns) and (b) liquid water clouds with CER = 10 μm. The hybrid LUT discretization scheme adopted for C6 (right column) has the least error near nadir.
To create the LUTs, the forward RT calculations of cloud top reflectance require appropriate radiative transfer models that include the single scattering properties of liquid and ice phase clouds. For liquid phase clouds, the C6 single scattering properties are identical to those of C5, and are computed from Mie calculations assuming a modified gamma droplet size distribution with effective variance of 0.1. Wavelength-dependent liquid water complex refractive indices are obtained from [55] for visible wavelengths through 1.0 μm, [56] for 1.0 < λ < 2.6 μm, and [57] for λ > 3.5 μm.
For ice phase clouds, however, significant changes to the radiative transfer model are introduced for C6. Comparisons of forward RT calculations with satellite remote sensing using polarization of reflected sunlight from Polarization and Directionality of the Earth’s Reflectances (POLDER) suggest that ice crystals with roughened surfaces significantly outperform smooth ice crystals [58]. Moreover, reflectance-based COT retrievals using a single habit, namely severely roughened compact aggregates composed of eight solid columns (hereafter referred to as aggregated columns) [39], were found to provide closure with thermal IR-based retrievals and are in better agreement with Cloud-Aerosol Lidar with Orthogonal Polarization (CALIOP) [34]. Based on the aforementioned sensitivity studies, the smooth ice crystal size/habit distribution cloud models used in C5 [18] have been replaced with a gamma particle size distribution (effective variance 0.1) consisting of these severely roughened aggregated columns. Fig. 3 schematically illustrates the C5 (left panel) and C6 (right panel) ice crystal habit models. With respect to ice crystal habit mixture, the C5 model assumed four broad size bins defined in terms of the particle maximum dimension (Dmax): 100% droxtals for 0 < Dmax < 60 μm; 15% bullet rosettes, 60% solid columns, and 35% plates for 60 μm < Dmax < 1000 μm; 45% hollow columns, 45% solid columns, and 10% aggregates for 1000 μm < Dmax < 2500 μm; and 97% bullet rosettes and 3% aggregates for 2500 μm < Dmax.
Fig. 3.
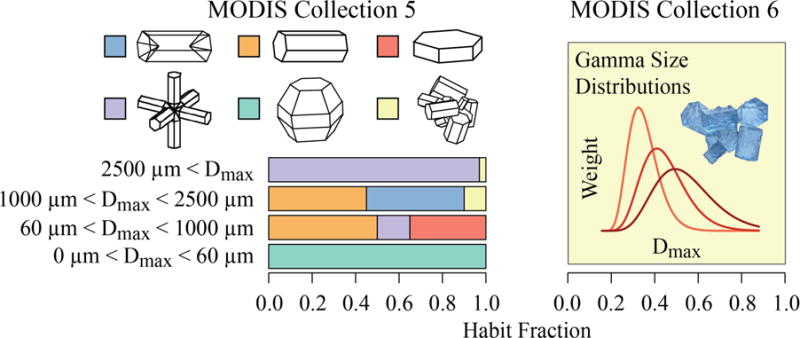
Left: MODIS C5 ice model with habit mixture prescribed as a function of particle size. Right: MODIS C6 single habit ice model along with example analytic Gamma size distributions used for C6 radiative calculations.
Fig. 4 shows the effect of using severely roughened ice crystals on calculations of the asymmetry factor, g, at the (a) 0.66 and (b) 2.1 μm wavelength channels. For the habits considered here (solid bullet rosettes, solid aggregate plates, and aggregated columns), roughened particles generally yield smaller asymmetry factors than the C5 models (black lines). To ascertain how decreasing the asymmetry parameter affects retrievals of COT, recall that the quantity τ(1−ωog), where τ refers to COT, has been found to be invariant [59]; for a non-absorptive channel (i.e., ωo →1), this reduces to τ(1−g), a quantity known as the “effective optical thickness” [59]. It then follows that differences between C5 COT retrievals and those using roughened particles (C6) can be approximated by
| (2) |
Thus using roughened ice crystals will yield smaller COT retrievals than those of C5, which have been shown to be biased high in the case of COT retrievals of optically thin clouds, i.e., those that can be retrieved by MODIS IR techniques and CALIOP [34]. Similarly, comparisons of MODIS Aqua COT retrievals against the AIRS infrared spectrometer version 6 product show excellent agreement for single layer low-latitude ice clouds [60].
Fig. 4.
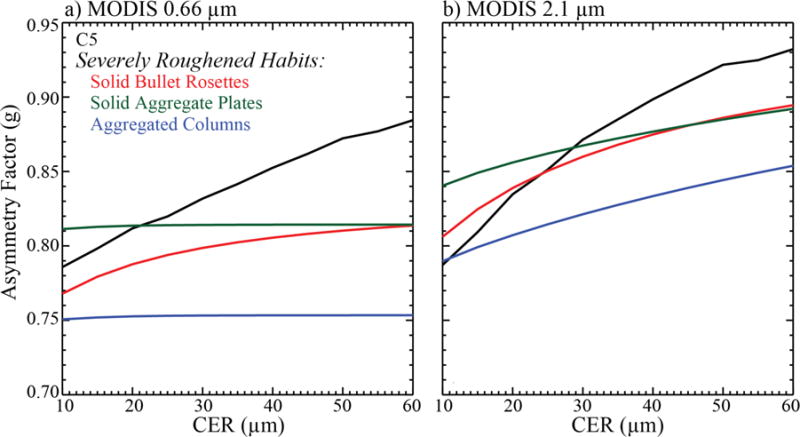
Asymmetry factor as a function of CER for ice crystals having the size/habit distribution used in C5 (black line), and gamma distribution of severely roughened solid bullet rosettes (red), solid aggregate plates (green), and the aggregated columns used in C6 (blue) for the (a) 0.66 μm (b) 2.1 μm wavelength channels. Note that ice crystals having severely roughened surfaces have significantly smaller asymmetry factors than those assumed in C5.
In addition to cloud asymmetry factor differences, the cloud single scattering albedo (ω0) derived from the new roughened ice crystal models is also generally larger at the absorbing SWIR wavelengths, as shown in Fig. 5 by the smaller values of co-albedo 1−ω0 for the 2.1 μm MODIS channel (a). For the MWIR 3.7 μm channel (b), 1−ω0 is larger than that found in C5. Because the SWIR and MWIR wavelength channels are primarily used to infer particle size, assuming roughened ice crystals will often lead to larger values of CER at 2.1 μm than the smooth ice crystal models of C5, and smaller values of CER at 3.7 μm, due to changes in ω0 alone; note CER retrieved from the 2.1 μm channel will be larger still due to the reduction in asymmetry factor g shown in Fig. 4, since forward-calculated cloud top reflectance will increase with decreasing g at constant CER. he sensitivity of ω0 at 2.1 and 3.7 μm to the effective variance (ve) of the assumed gamma size distribution of roughened aggregate columns is shown in Figs. 5(c) and 5(d), respectively. Although the true effective variance of ice clouds is not known, a value of 0.1 was chosen for the C6 models, consistent with the liquid water gamma distribution models; the sensitivity to this assumption is considered in calculating retrieval uncertainty estimates (see Section III F).
Fig. 5.
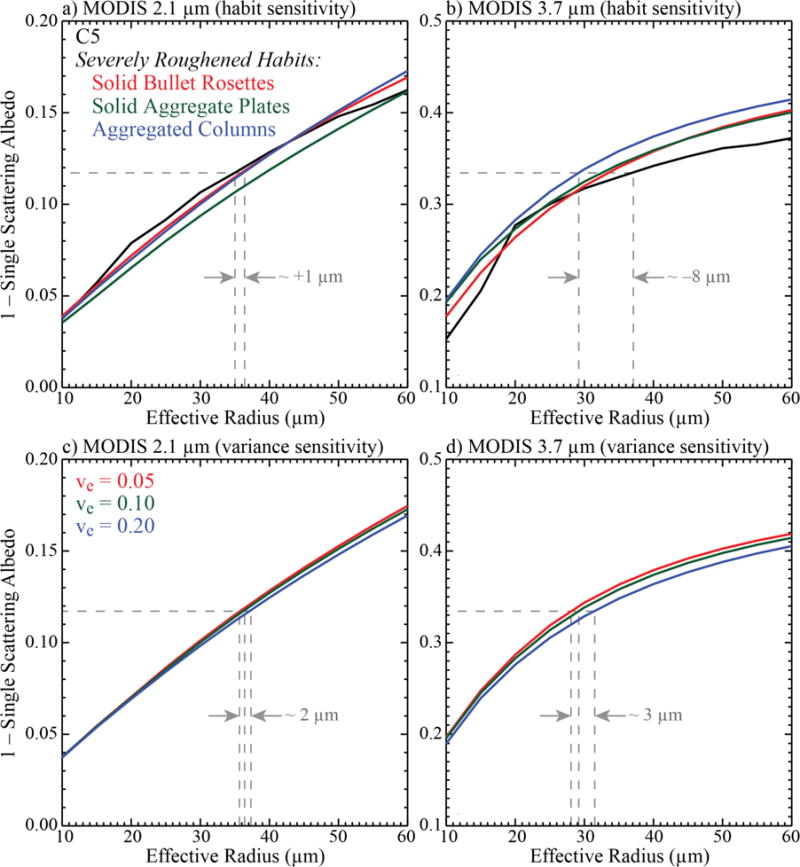
Simulations of co-albedo as a function of CER for crystals having the size/habit distribution used in C5 (black line), and gamma distribution of severely roughened solid bullet rosettes (red), solid aggregate plates (green), and the aggregated columns used in C6 (blue) for the (a) 2.1 μm and (b) 3.7 μm wavelength channels. Ice crystals having severely roughened surfaces have smaller (larger) absorption than those assumed in Collection 5 at 2.1 μm (3.7 μm), which can potentially lead to larger (smaller) values of CER in C6. Calculations of co-albedo for severely roughened aggregated columns at various values of effective variance are shown in (c) and (d) for 2.1 and 3.7 μm, respectively.
An example of the C6 ice model phase functions (dashed lines) for four MODIS channels (0.87, 1.6, 2.1, and 3.7 μm) is shown in Fig. 6 along with the corresponding C5 phase functions (solid lines). Phase functions for CER = 10 and 40 μm are shown in red and blue, respectively. Note that introducing surface roughness yields smoother phase functions for each channel.
Fig. 6.
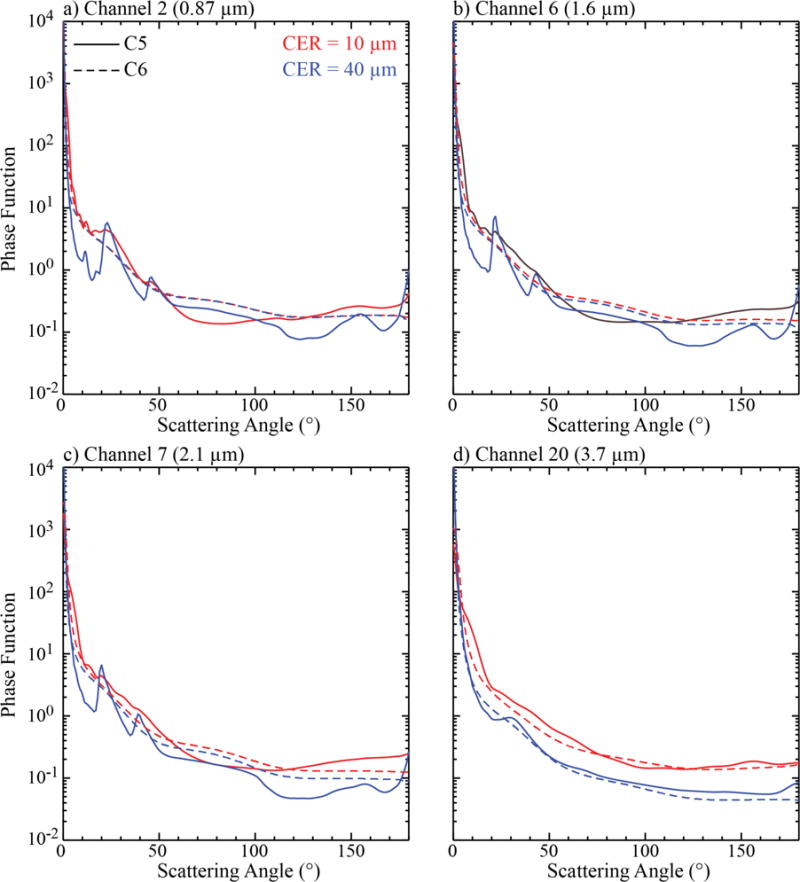
C5 (solid line) and C6 (dashed line) ice model phase functions at four wavelength channels for CER = 10 μm (red) and 40 μm (blue).
As a convenience for the user, C6 MOD06 files now provide SDSs of extinction efficiency, asymmetry factor, and single scattering albedo for both the ice and liquid water cloud radiative models as a function of spectral channel and CER. This allows a user to estimate appropriate adjustments (e.g., (2)) for comparisons with retrieval methods or radiative models that use different particle scattering assumptions.
B. Cloud Thermodynamic Phase
Because ice and liquid phase clouds have very different scattering and absorbing properties, an incorrect cloud phase decision can lead to substantial errors in COT, CER, and CWP. MOD06 provides two independent cloud phase products, namely an IR product that infers cloud phase using three channel pairs, i.e., 7.3/11 μm, 8.5/11 μm, and 11/12 μm [8], and a product that uses a combination of SWIR and IR tests [61] whose results are used to determine the processing path for the cloud optical and microphysical property retrievals (hereafter referred to as the COP phase algorithm). The COP phase algorithm categorizes a cloudy pixel as liquid, ice, or undetermined phase. While the undetermined phase category is assigned when the phase tests produce ambiguous results, pixels in this category are nonetheless processed as liquid phase. However, their resulting retrieval statistics are aggregated into separate SDSs in the Level-3 product (i.e., with the_Undetermined suffix). In addition, the COP phase algorithm provides phase results for all cloudy pixels regardless of the success of the cloud optical and microphysical retrievals.
For C6, the COP phase algorithm has been completely re-designed. Changes include a new voting logic versus the sequential decision tree logic of C5 that included individual spectral MOD35 cloud mask tests [14], as well as replacement of the C5 SWIR/NIR reflectance ratio tests with logic utilizing separate ice and liquid phase spectral CER retrievals (though the ratio tests are retained for optically thin clouds over snow and ice surfaces). The voting weights of the new COP phase algorithm have been optimized via extensive global and regional comparisons between Aqua MODIS and CALIOP, and have yielded improved phase determination skill over C5, particularly for broken clouds as well as optically thin ice cloud edges previously misidentified as liquid cloud phase; similar improvement is observed with respect to collocated polarimetric observations from POLDER.
Four main categories of tests comprise the C6 COP phase algorithm:
IR Phase Test: This test uses the 1 km IR phase product of Baum et al. [8] that is part of the MOD06 Cloud Top Properties algorithm.
Cloud Top Temperature Tests: These tests use the MOD06 1 km cloud top temperature (CTT) retrievals. Note that the C5 warm cloud sanity check, in which the phase is forced to liquid when CTT > 270 K, was retained in modified form for C6 (mainly as a larger liquid phase vote) only when the retrieved liquid phase COT > 2.
1.38 μm Test: This test uses the 1.38 μm high cloud flag from the MOD35 cloud mask product. The capacity of this test to discriminate high-altitude ice clouds from low-altitude liquid clouds is based on the strong water vapor absorption at 1.38 μm [62]. This test is applied only when sufficient water vapor is present, roughly 1 cm precipitable water, and when ice phase COT < 2 to avoid spurious ice votes in the case of optically thick, low altitude liquid clouds. In C5 this test was used only when the IR cloud phase decision was undetermined.
Spectral CER Tests: These tests replace the C5 SWIR/NIR reflectance ratio tests. It is difficult to define linear reflectance ratio thresholds to discriminate ice and liquid phase pixels since reflectance ratios can depend on COT, viewing geometry, etc.; CER retrievals implicitly account for such dependencies. Fig. 7 shows an example of the 0.86–2.1 μm COT and CER retrieval solution space for liquid (red curves) and ice (blue curves) phase clouds over a dark surface for the geometry specified in the caption. Some of the solution space is unambiguously liquid and some unambiguously ice, but there are overlapping regions in which either phase can yield a viable physical solution. Comparison of liquid and ice phase CER retrievals from all three SWIR/MWIR wavelengths can reduce ambiguity in the choice of thermodynamic phase. Thus the C6 COP phase algorithm requires six independent pixel-level retrievals, specifically liquid and ice phase CER at 1.6, 2.1, and 3.7 μm.
Fig. 7.
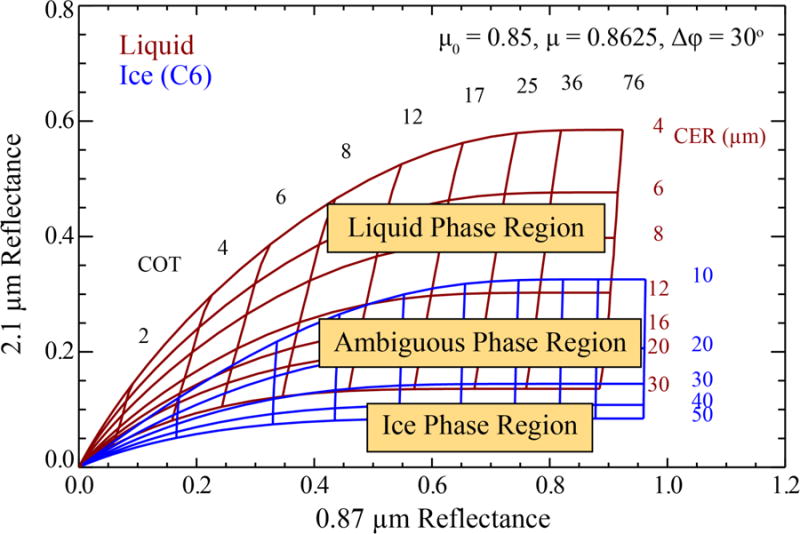
The theoretical relationship between top-of-cloud reflectance in the 0.87 and 2.1 μm MODIS channels for liquid water (red) and the C6 ice cloud model (blue) for various values of COT and CER. Reflectance observations can occur in regions of the solution space that are unambiguously liquid or ice, but may also lie in regions that are ambiguous regarding phase.
To evaluate the performance of the new C6 COP phase algorithm, extensive comparisons were performed with the collocated CALIOP cloud layer products. To quantify algorithm skill, we define a Phase Agreement Fraction (PAF) as the number of MODIS pixels where the C6 and CALIOP phase are in agreement divided by the total number of collocated cloudy pixels. Fig. 8 shows the global November 2012 PAF score on a 10 × 10° grid for (a) C5 and (b) C6 for the pixel population identified as “overcast” by the Clear Sky Restoral algorithm (CSR = 0 designation, see Section III D below for details). The C6 cloud phase improvement is broadly distributed, with a noticeable improvement over ocean. Moreover, the C5 cloud phase skill gradually decreased with increasing latitude, having a pronounced minimum over Antarctica, a shortcoming that has been greatly reduced for C6. Additional comparison results, as well as algorithm details, can be found in [61]. Comparisons of MODIS Aqua phase retrievals against the AIRS infrared spectrometer version 6 algorithm are discussed in [60].
Fig. 8.
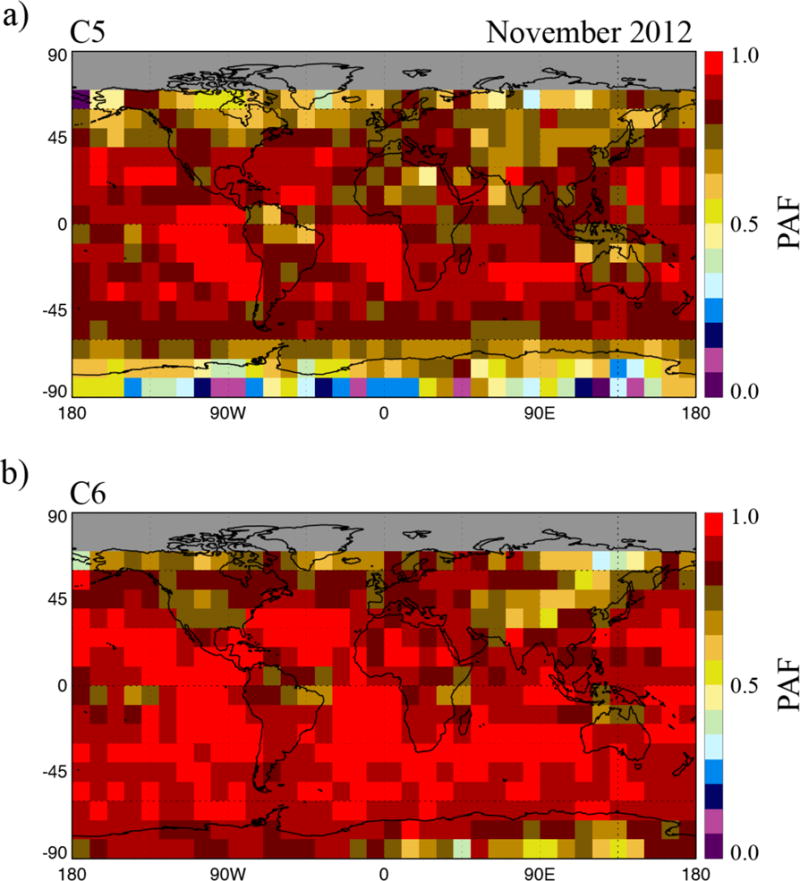
Global gridded phase agreement fraction (PAF) for the (a) C5 and (b) C6 COP thermodynamic phase algorithms for November 2012.
C. Separate Spectral Cloud Retrievals
To complement the heritage retrievals using the 2.1 μm channel, COT, CER, and CWP retrievals are now performed and reported separately for channel pairs that include the 1.6 and 3.7 μm channels. These spectral retrievals were also performed in C5, though they were reported only as differences with respect to 2.1 μm (i.e., CER(1.6 μm)– CER(2.1 μm), CER(3.7 μm)–CER(2.1 μm)), with the ‘primary’ suite of absolute retrievals being reported only for 2.1 μm. Note that C6 continues to provide a separate retrieval using the 1.6 and 2.1 μm channel pair over snow/ice and ocean surfaces [13]. By reporting the retrievals separately for all channel pairs, it is now possible to do analysis and L3 aggregations that ease spectral retrieval intercomparisons. Table II shows the new C6 SDSs and the difference from C5.
Table II.
Main Cloud Optical Property Scientific Data Set (SDS) Listing
| Spectral Retrieval | C5 SDS Name | C6 SDS Name |
|---|---|---|
| Optical Thickness 1.6μm | N/A | Cloud_Optical_Thickness_16 |
| Effective Radius 1.6μm | Effective_Radius_Difference (plane 1) | Cloud_Effective_Radius_16 |
| Water Path 1.6μm | N/A | Cloud_Water_Path_16 |
| Optical Thickness 2.1μm | Cloud_Optical_Thickness | Cloud_Optical_Thickness |
| Effective Radius 2.1μm | Cloud_Effective_Radius | Cloud_Effective_Radius |
| Water Path 2.1μm | Cloud_Water_Path | Cloud_Water_Path |
| Optical Thickness 3.7μm | N/A | Cloud_Optical_Thickness_37 |
| Effective Radius 3.7μm | Effective_Radius_Difference (plane 2) | Cloud_Effective_Radius_37 |
| Water Path 3.7μm | N/A | Cloud_Water_Path_37 |
| Optical Thickness 1.6–2.1μm | Cloud_Optical_Thickness_1621 | Cloud_Optical_Thickness_1621 |
| Effective Radius 1.6–2.1μm | Cloud_Effective_Radius_1621 | Cloud_Effective_Radius_1621 |
| Water Path 1.6–2.1μm | Cloud_Water_Path_1621 | Cloud_Water_Path_1621 |
In addition to the desired result of enabling easy intercomparisons among the different retrieval outcomes, it is important to appreciate that the primary three spectral cloud retrievals can have dramatically different failure patterns [63]. For example, retrievals may fail (i.e., the observed reflectance pair lies outside the LUT solution space) when using a Visible or Near-infrared (VNSWIR) and shortwave infrared 2.1 μm channel pair but may yield a successful retrieval when using a VNSWIR and 3.7 μm channel pair. Therefore, the pixel population comprising one retrieval pair may be significantly different than another; this can be particularly true for broken liquid water cloud scenes where cloud heterogeneity scales are on the order of, or less than, the 1 km nadir pixel resolution and/or for cases where a significant drizzle mode is found in the column [64], [32]. Thus the C5 sampling of spectral CER differences, for instance between 3.7 and 2.1 μm, was dependent not only on the 3.7 μm retrieval success rate, but on the 2.1 μm retrieval success rate as well. The C5 removal of successful spectral CER retrievals due to filtering by successful 2.1 μm retrievals also leads to a systematic shift in the CER retrieval histogram, as illustrated by the histograms in Fig. 9 derived from a Terra MODIS granule obtained on 1 April 2005 (0635 UTC). Here liquid (red lines) and ice (blue lines) phase 3.7 μm CER retrieval histograms are shown for C5 (dashed lines) and C6 (solid lines). The effect on liquid water retrievals is greater because liquid water 2.1 μm CER retrievals tend to fail more often than those at 3.7 μm. Global spectral CER statistics are shown in Section IV.
Fig. 9.
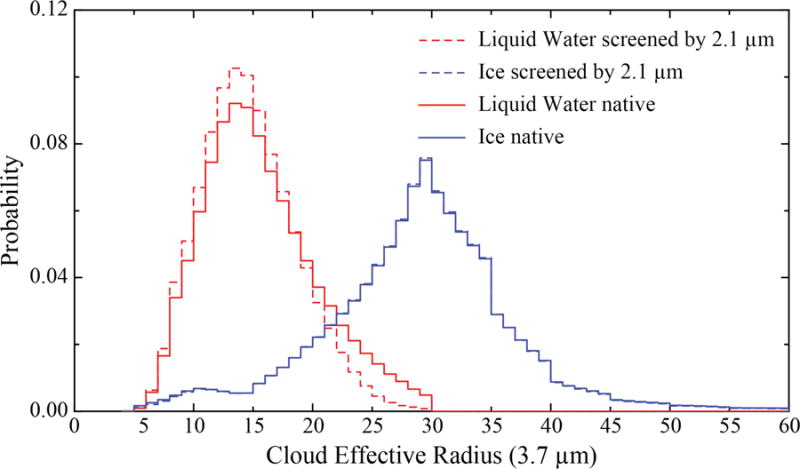
C6 3.7 μm CER retrieval histograms derived from a Terra MODIS granule obtained on April 1, 2005 (0635 UTC). Here liquid phase (red lines) and ice phase (blue lines) histograms are shown for C5 (dashed lines) and C6 (solid lines). The C5 removal of successful spectral CER retrievals due to filtering by successful 2.1 μm retrievals leads to a systematic shift in the CER retrieval histogram.
D. Quality Assurance Considerations: Processing of Partly Cloudy “PCL” Pixels and Multilayer Cloud Detection
Identifying cloudy pixels appropriate for the MOD06 cloud optical and microphysical property retrievals is largely accomplished using results from the MOD35 1 km cloud mask tests (note there are also two 250 m cloud mask spectral tests that can independently report the 1 km cloudy designations as clear sky with a separate set of bits). However, because MOD35 is designed to identify “not clear” pixels, certain situations exist in which pixels identified by MOD35 as “cloudy” are nevertheless likely to be poor retrieval candidates. For instance, near the edge of clouds or within broken cloud fields, a given 1 km MODIS field of view (FOV) may in fact only be partially cloudy. This can be problematic for the MOD06 retrievals because in these cases the assumptions of a completely overcast homogenous cloudy FOV and 1-dimensional plane-parallel radiative transfer no longer hold, and subsequent retrievals will be of low confidence. Furthermore, some pixels may be identified by MOD35 as “not clear" for reasons other than the presence of clouds, such as scenes with thick smoke or lofted dust, and should therefore not be treated as clouds. With such situations in mind, a Clear Sky Restoral (CSR) algorithm was introduced in C5 that attempts to identify pixels expected to be poor retrieval candidates.
All MOD35 “cloudy” pixels pass through the CSR logic and are assigned four possible outcomes:
Overcast Cloudy (CSR = 0): Pixels that are not identified as clear or partly cloudy by the CSR tests. Note, MOD35 “not cloudy” pixels will also have CSR=0.
Not Cloudy (CSR = 2): Pixels identified by cloud altitude (1 km MOD06 cloud top product coupled with 1.38 μm reflectance), VIS or NIR spatial reflectance variability, and VIS through SWIR spectral curvature tests as likely dust, smoke, or sunglint pixels, and are restored to clear sky.
Partly Cloudy (CSR = 3): Pixels over water surfaces that are identified by sub-pixel 250 m MOD35 cloud mask variability as partly cloudy.
Cloud Edge (CSR = 1): Overcast cloudy pixels (CSR = 0) with “clear” adjacent neighbors (i.e, adjacent pixels with MOD35 “not cloudy” or CSR = 2).
C6 updates to the CSR algorithm primarily focused on improving the skill of the CSR=2 category. For instance, the spatial variability tests employed in C5 were not without issue. It was possible to obtain an aerosol-like spatial variability signature from very uniform, optically thin marine stratus clouds. As a result, the CSR algorithm often created “holes” in cloud regions where retrievals should have been attempted. To remedy this issue, a neural net-based fast aerosol optical depth (AOD) retrieval algorithm was implemented with code from the Goddard Modeling and Assimilation Office (GMAO) used in GEOS-5 aerosol data assimilation. The algorithm was designed to operate in cloud-free conditions (used internally by GEOS-5 and not described in the literature). When this algorithm is applied to all MODIS pixels placed into the CSR=2 category, two distinct pixel populations emerge. One population has a reasonable aerosol optical depth retrieval while the other gives large values outside of the expected range. For present purposes, optical depth values with log(AOD+0.01) > 0.95 are assumed to be associated with cloudy scenes and the CSR category is re-set to cloudy.
Fig. 10 shows the CSR results for an example granule from Aqua MODIS, observed on 9 April 2005 (1050 UTC) over the Black Sea, Turkey, and the eastern Mediterranean Sea. What appears to be lofted dust is apparent over the Mediterranean at the bottom of the true color RGB (0.66–0.55–0.47 μm) in (a), and is identified as “cloudy”, or not clear, by the MOD35 cloud mask (b). This feature is correctly identified by the CSR algorithm (c), and is restored to clear sky by the CSR = 2 tests (light blue shade). Note also the CSR = 1 cloud edge pixels, visible as the regions of dark blue outlining the cloud features in the CSR image.
Fig. 10.
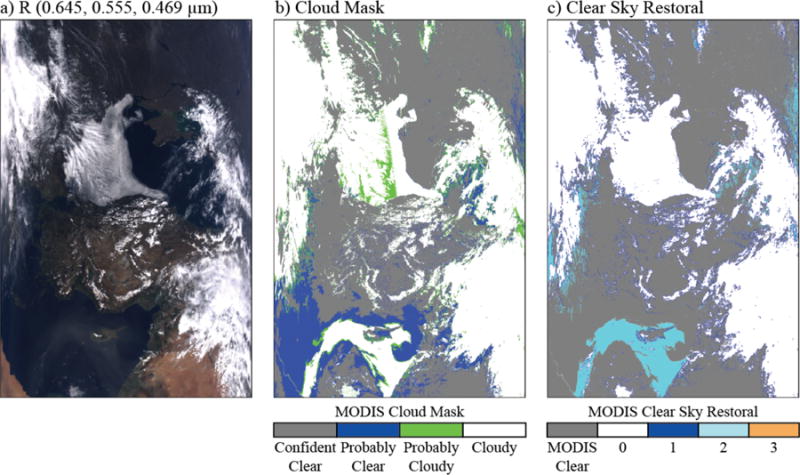
(a) True color RGB (0.66–0.55–0.47 μm) from an Aqua MODIS granule on April 9, 2005 (1050 UTC). (b) MOD35 cloud mask results. (c) MOD06 C6 CSR algorithm results (0: overcast; 1: cloud edge; 2: restored to clear sky; 3: partly cloudy).
An important change for C6 is the handling of the so-called “partly cloudy” (PCL) pixel population that includes both the partly cloudy CSR = 3 and cloud edge CSR = 1 pixels. Previously in C5, MOD06 cloud optical and microphysical retrievals were only attempted on cloudy pixels designated as overcast (CSR = 0) by the CSR algorithm. This implicit retrieval quality filtering necessarily limited the MOD06 retrieval population to those pixels thought to be appropriate for the homogeneous 1D plane-parallel assumption, and was driven by a desire to provide retrievals of the highest quality. Nevertheless, this denied users the ability to use retrievals of the PCL pixels in an informed manner if they so chose, and likely biased retrieval statistics towards optically thicker clouds. For C6, optical and microphysical retrievals are now attempted on these PCL pixels, though in order to reduce their unintentional use such successful retrievals are reported independently from overcast pixels in SDSs with a _PCL suffix identifier in the name.
Retrieval quality is also informed by the multilayer cloud detection algorithm [20, 21]. In C5, the multilayer cloud detection results were stored as an SDS with a confidence flag ranging from 1 (single layer cloud) to 8 (highest confidence multilayer cloud) based on which multilayer tests were positive; the results were also placed into the Quality_Assurance_1km SDS and combined with thermodynamic phase results to provide, e.g., “single layer ice cloud”, “multilayer ice cloud”, etc. information. In C6 the algorithm is updated so that the SDS now contains a total skill score. The skill score is a sum of individual test contributions with each test having a value based on its quality of detection result. Further, two additional tests were added in C6. One test is based on the difference in COT between the VNSWIR and the 1.6–2.1 μm retrievals when the phase is indicated as ice. Large COT retrieval differences (e.g., COT < 30 for the VNSWIR and COT > 80 for the 1.6–2.1 μm retrieval) can indicate the presence of multilayer cloud. The second test included in C6 is the Pavolonis-Heidinger (PH) multilayer cloud retrieval [40]. It was found, however, that when executed globally, the PH algorithm often identifies moderately thick single layer ice clouds as being multi-layered; this result was consistent with expectations from a synthetic multilayer radiance study [20]. The scale of over-detection was such that it was decided late in C6 development not to include pixels only identified by the PH algorithm in the L3 multilayer statistical aggregations, even though the result of the PH algorithm is still included in the total skill score. In order to identify which tests contributed to the total skill score, a sixth byte was included in the 1 km QA SDS to indicate the specific test(s) that were triggered. Users are strongly advised to use that QA information in conjunction with the SDS skill score and exclude areas where only the PH test is positive. The PH algorithm may be removed from consideration if further reprocessing is deemed to be warranted by the science team.
In summary, to identify potentially multilayer cloud pixels in MOD06 it is recommended that users look carefully at the 1 km QA Byte 6 and use the same filtering methodology used by the MOD06 team for L3 multilayer statistical aggregations as described above. Because of the high weighting given to the PH test in early C6 development, users should not use the Cloud_Multi_Layer_Flag SDS to infer overall confidence in the multilayer detection result.
E. Retrieval Failure Metric
Even if an optical/microphysical retrieval attempt fails, i.e., the observed pixel reflectance pair lies outside the LUT solution space such that the standard solution logic fails to produce a successful COT/CER retrieval pair, the location of the pixel’s observed reflectance with respect to the LUT can provide information useful in understanding the radiative equivalent COT and CER; note that a less frequent failure type involves observations that lie within the solution space but yield multiple CER solutions. Previously in C5, pixels outside the solution space resulted in either partial COT retrievals (i.e., COT retrieved assuming a CER of 10 or 30 μm for liquid or ice phase clouds, respectively), with CER assigned fill values, or completely failed retrievals, with both COT and CER assigned fill values; pixels inside the solution space with multiple possible CER solutions were assigned the largest valid CER solution. For C6, an alternate solution logic (ASL) algorithm is now implemented that gives the COT and/or CER of the LUT grid point closest to the observation, as well as a cost metric indicating the relative distance of the observation from the LUT solution space.
The ASL is schematically illustrated by the 0.87 and 2.1 μm channel liquid water phase LUT in Fig. 11, where the observation, denoted by the green diamond, is located below the edge of the solution space. The vector B points from the observation to the closest LUT point which, for this pixel, would yield a retrieved COT of 26 and a 30 μm CER. The closest LUT point is selected using a cost metric (CM), defined here as
| (3) |
where the vectors A and C are distances from the origin to the observation point and LUT grid point, respectively. Thus the cost metric is essentially a measure of the percent relative distance between the observation and the closest LUT COT and CER grid point.
Fig. 11.
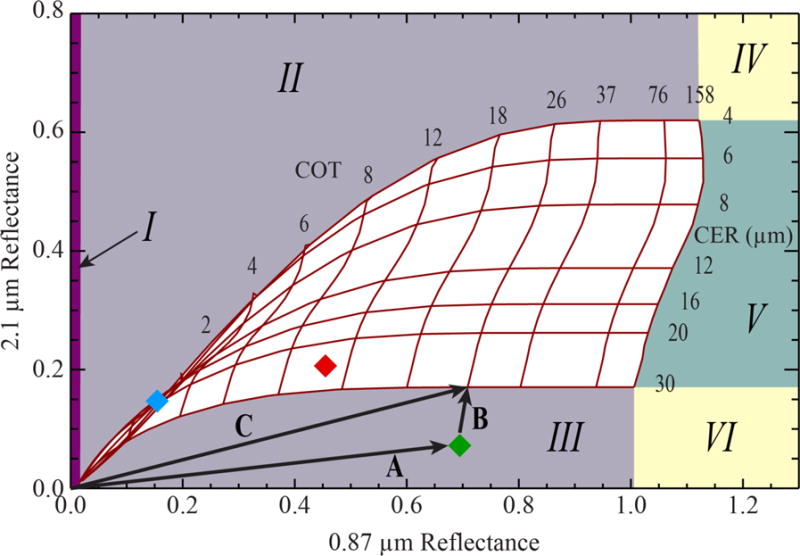
Retrieval space for a liquid phase cloud over an ocean surface (θ0 = 19.89°, θ = 22.39°, Φ = 174.4°, wind speed = 7 m×s−1), highlighting Retrieval Failure Metric (RFM) categories and cost metric assignments (see Table III). Also shown are example pixels illustrating a successful retrieval (red marker), a retrieval outside the solution space (green), and a multiple CER solution retrieval (blue). The vectors A, B, and C are used for computing the cost metric (3) for the pixel outside the solution space. The same logic also applies to ice cloud retrievals (see example solution space in Fig. 7).
The COT and/or CER and cost metric of failed retrievals for all channel pairs, reported in the Retrieval_Failure_Metric (RFM) SDSs, can be used to help diagnose retrieval failure causes and provide failure statistics as discussed in [63] for liquid water marine clouds. In order to make RFM assignments, the exterior of the LUT solution space is divided into six regions as shown by the shaded areas surrounding the example liquid water phase LUT in Fig. 11. Also shown are example pixel locations illustrating a successful full retrieval in the LUT interior (red diamond), a retrieval within the LUT interior having multiple CER solutions (ASL solution, blue diamond), and a retrieval in the LUT exterior (ASL solution, green diamond).
Table III provides an overview of the RFM SDS assignments for each region of the solution space in Fig. 11; regions outside of the LUT are labeled I through VI. These SDSs will be assigned fill values for pixels having successful COT/CER retrieval pairs present in either the standard overcast SDSs or the partly cloudy (PCL) SDSs. For all retrieval channel pairs except 1.6/2.1 μm, pixels with an x-axis VNSWIR reflectance larger than the maximum LUT reflectance (i.e., the green region to the right of the LUT in Fig. 11) are considered successful retrievals with COT set to the maximum allowed value (note that the LUT COT maximum is 158 but the maximum reported value is limited to 150); thus the RFM SDS for these pixels will contain fill values even though the solutions originate from the ASL routine. For the 1.6/2.1 μm channel pair, because of substantial cloud particle absorption for the x-axis 1.6 μm reflectance, only the ASL CER retrieval is useful when the reflectance pair is in the green region of the solution space, and is therefore reported in the RFM. Furthermore, as was previously discussed in Section III C, each spectral channel pairing has a different rate of retrieval failure [63] due to differences in the absorbing CER wavelengths (e.g., penetration depths, sensitivities to cloud inhomogeneity or 3D radiative effects, atmospheric transmittance corrections, etc.) [65], [22], [32], thus the various spectral RFM SDSs should not be expected to contain identical pixel populations.
Table III.
Mapping of Retrieved Solutions and Cost Metric from the Solution Space Regions in Fig. 11 to the Retrieval Failure Metric (RFM) SDS
| Region | Band Pairs | Retrieval Failure Metric SDS
|
||
|---|---|---|---|---|
| COT | CER | Cost Metric (CM) | ||
| Solution Space Interior | ||||
| Successful Solution | All | Fill | Fill | Fill |
| Multiple CER Solution | All | Valid | Valid | ≥0 |
|
| ||||
| Solution Space Exterior | ||||
| IV, VI | All | Fill | Fill | Max |
| I | All | Fill | Fill | Fill |
| II, III | All | Nearest LUT COT | Nearest LUT CER | ≥0 |
| V | 1.6–2.1μm | Fill | Valid | ≥0 |
| All Others | Fill | Fill | Fill | |
As an example, RFM statistics were analyzed for overcast pixels from an Aqua MODIS data granule southwest of Baja California on 2 July 2008, 2105 UTC. Comprising tropical storm Douglas, the granule contains a variety of liquid and ice phase clouds over both ocean and land surfaces (browse imagery available at lance.modaps.eosdis.nasa.gov/cgi-bin/imagery/realtime.cgi). Liquid phase CER (2.1 μm) retrieval failure rates corresponding to regions II and III of Fig. 11 were 4% and 11%, respectively. For liquid CER (3.7 μm) retrievals, 6% and 5% of attempted retrievals failed, respectively. Ice phase CER (2.1 μm) retrieval failure rates corresponding to regions II and III were 8% and 3%, respectively, while 6% and 7% of CER (3.7 μm) retrievals failed, respectively. For the global ocean liquid water cloud study reported in [63], there was an overall failure rate of about 16% and 10% for CER (2.1 μm) and CER (3.7 μm) retrievals, respectively; the majority of failures occurred in region III and were more likely to be associated with broken and heterogeneous cloudy scenes.
F. Improved Pixel-Level Retrieval Uncertainty
Estimates of the pixel-level uncertainty (RMS relative uncertainty normalized to percent) in COT, CER, and WP were added in C5 as first described in [24]. The uncertainty estimates are derived by propagating uncertainties applied to component error sources that are inherent to the retrieval. This is done by calculating partial derivative sensitivities (i.e., Jacobians) – for example, of cloud top reflectance with respect to COT at the two channels used in the retrieval, while holding the other parameters (CER, surface spectral reflectance, etc.) constant – coupled with estimates of cloud top reflectance uncertainties associated with each error source. In this way, each error source uncertainty is mapped into cloud top reflectance uncertainty that is then mapped into retrieval uncertainty. The approach allows partial derivatives to be calculated from the radiative transfer LUTs for computational efficiency. For C6, error sources include (i) instrument calibration, (ii) atmospheric corrections, (iii) surface spectral reflectance, and (iv) other forward model error sources. While not currently part of the reported uncertainty budget, work on flagging, understanding, and perhaps improving 3-D error sources is ongoing.
The mapping of measured and model uncertainty components into retrieval uncertainty is represented by the covariance matrix SRet, such that
| (4) |
where Sy and Sb are the measurement and model covariance matrices, respectively. The partial derivatives in K map cloud top reflectance error into retrieval error (e.g., matrix elements ∂Rλ/∂τ and ∂Rλ/∂re). For the present two-channel retrieval problem the matrices are of size 2 × 2. The elements of Kb contain partial derivatives of reflectance with respect to some channel dependent model parameter (e.g., spectral surface albedo, spectral above-cloud atmospheric transmittance, etc.); the i-index summation is over each independent model error source. The Kb matrices are diagonal with the exception of atmospheric transmittance errors due to water vapor uncertainties that affect each channel in a correlated manner. The matrix formulation of (4) can be derived from standard variance algebra, only keeping first order (linear) terms, and is equivalent to the retrieval error covariance matrix formulation used in optimal estimation retrievals [66] when the a priori information is removed (i.e., given large error covariance values).
C5 processing assumed the instrument radiometric calibration relative uncertainty was fixed at 5% in all VNIR/SWIR spectral channels (this value was also intended to include nominal uncertainty in cloud forward model error sources that are now partially captured in C6, i.e., items (ii) and (iii) below), the relative uncertainty in water vapor (from NCEP GDAS) used in above-cloud atmospheric corrections was 20%, and the spectral surface albedo uncertainty associated with the MOD43B product was 15% in all spectral channels and in all land locations. In C6 processing, error sources are modified/expanded to include: (i) scene-dependent calibration uncertainty that depends on the channel and detector-specific uncertainty index provided in the L1B file, (ii) new model error sources derived from the LUTs that include sensitivities associated with wind direction and speed over the ocean and uncertainties in liquid and ice size distribution effective variance, (iii) thermal emission uncertainties in the 3.7 μm channel associated with cloud and surface temperatures that are needed to extract reflected solar radiation from the total radiance signal, (iv) uncertainty in the solar spectral irradiance at 3.7 μm, and (v) addition of stratospheric ozone uncertainty in the visible (0.66 μm) atmospheric correction. These source uncertainty assignments used in C6 pixel-level retrieval uncertainty calculations are summarized in Table IV; note retrieval uncertainties also depend on the solar and view zenith geometry.
Table IV.
C6 Pixel-level Error Sources and Associated Uncertainty Bounds
| Category | Error Source | Specification |
|---|---|---|
| Ancillary Data (Related to Surface Reflectance) | ||
| Land/Snow | MODIS-derived Asfc(λ) from MCD43B3 | ±15% of Asfc(λ) |
| Ocean/Water | surface wind speed | ±20% surface wind speed |
|
| ||
| Above-Cloud Atmospheric Corrections | ||
| Water Vapor (all channels) | above-cloud ancillary precipi-table water (PW) | ±20% |
| above-cloud atmospheric transmittance LUT | provided in spectral transmittance LUT, derived from profile variances | |
|
|
||
| O3 (0.66 μm channel) | analytic transmittance formula | ±20% |
|
| ||
| Observations | measurement relative error | max. of L1B Uncertainty Index value or 2% (channels 1–4) and 3% (channels 5–7) |
|
| ||
| Model | cloud model error from analytic gamma size distribution effective variance (ve) | standard deviation from ve=0.05 to 0.2 (0.1 nominal) for both liquid and ice LUTs |
|
| ||
| water surface reflectance model error from using Cox-Munk reflectances averaged over wind direction | standard deviation of 4 vector wind directions | |
|
| ||
| 3.7μm Cloud Reflectance and Cloud/Surface Emission | ||
| Cloud Emission (ΔTc) | ΔPc (CO2 slicing retrieval) | ±50mb |
| ΔPW (IR window retrieval) | ±20% | |
|
|
||
| Surface Emission (ΔTsfc) | ΔTsfc (ancillary) | ±1K |
|
|
||
| Solar Spectral Irradiance (ΔF0) | ΔF0/F0 (reflectance calculation) | ~4% (0.42W·m−2·μm−1) |
With respect to scene-dependent calibration uncertainty, in C6 the L1B pixel-level uncertainty index (UI) is now used. The UI is an integer value that ranges from 0–15 as an indication of relative measurement uncertainty, and is defined such that pixel-level relative uncertainty can be calculated for all MODIS channels via
| (5) |
where the values of specified_uncertainty and scale_factor depend on the spectral channel and are provided in the L1B files [41]. With this definition, relative uncertainties range between 1.5% (UI = 0) and 12.8% (UI = 15) for the 0.66 and 0.87 μm channels, between 1.5% and 30% for the 1.24, 1.6, and 2.1 μm channels, and between 0.56% and 24% for the 3.7 μm channel. While useful for capturing scene-dependent calibration sensitivities, a minimum allowable relative radiometric uncertainty of 2% is set for the 0.66 and 0.87 μm channels and 3% for the 1.24, 1.6, 2.1 and 3.7 μm channels.
As was the case in C5, the uncertainty in COT over the ocean is typically smallest when the COT lies between 3 and 20, and increases with optical thickness due to saturation in VNIR reflectance and thereby increased sensitivity to error source uncertainties affecting the knowledge of cloud top reflectance. Uncertainty is also larger for small COT due to uncertainty in surface reflectance and atmospheric corrections. In all cases, the contribution of the radiometric uncertainty component to the overall pixel-level uncertainty is much smaller in C6 than what was assumed (5%) in C5. In contrast, the uncertainty in CER over the ocean is largest for small CER (due to atmospheric correction and calibration uncertainty) and at large CER (due to surface reflectance uncertainty).
Fig. 12 shows C5 and C6 retrievals of (a) COT and (b) 2.1 μm CER for an Aqua MODIS granule over Greenland and nearby ocean where clouds overlie sea ice (1 July 2008, 1400 UTC); the corresponding COT and CER retrieval uncertainties are shown in (c) and (d), respectively. This example highlights the pixel-level uncertainties over land, ocean, and ice surfaces, and for a wide variety of optical properties and phase. Note that the C6 retrieval uncertainties are smaller than those of C5, and in the case of COT are noticeably smaller. While this result may seem counterintuitive given that more error sources are considered in C6, it is explained by the use of significantly smaller radiometric uncertainties compared to C5. Note again that the previous high value of 5% was meant as a pragmatic approach in C5 to account for 3-D radiative transfer uncertainties that could not be expressed explicitly and are still not part of the model error in C6.
Fig. 12.
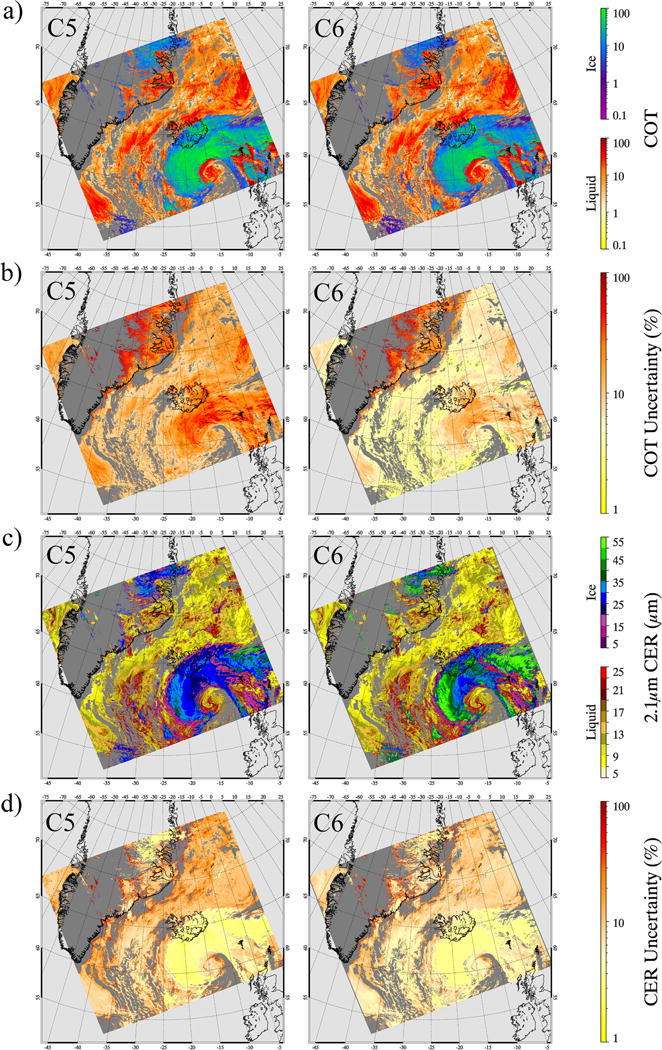
Retrievals of (a) COT and (b) 2.1 μm CER for an Aqua MODIS data granule over Greenland (July 1, 2008, 1400 UTC); the corresponding COT and CER retrieval uncertainties are shown in (c) and (d), respectively. The left and right images in each panel correspond to results from C5 and C6, respectively. For C6, retrieval uncertainties for both COT and 2.1 μm CER decreased compared to C5.
2-D retrieval uncertainty distribution calculations for liquid water and ice pixels are shown in Fig. 13 for (b,e) COT and CER from the (c,f) 2.1 μm and (d,g) 3.7 μm channels for an Aqua MODIS data granule over the central U.S. (8 June 2014, 1940UTC); the true-color RGB image for the granule is shown in (a). All successful retrievals from the “overcast” pixel population (i.e., CSR = 0) are included in the distribution, and therefore a variety of view angles are also included. As expected, based on the shape of the COT and CER solution space (see, e.g., Fig. 11), the largest COT uncertainties occur at small and large COT where the solution space contours are most closely spaced, and with more sensitivity to CER at the smaller sizes. The largest CER uncertainties tend to occur at the smaller COTs before the SWIR/MWIR reflectances asymptote; however, 3.7 μm CER uncertainties also peak at larger CER due to a greater atmospheric correction (transmittance and emission) relative to the correspondingly smaller reflectances. Contours of normalized retrieval counts for the COT and CER pairs are also shown. The location of the retrieval distribution maximum is generally well away from the maximum uncertainty regions. To better appreciate the relative contribution of individual error source components, Fig. 14 shows mean binned liquid water and ice cloud retrieval uncertainties corresponding to the main error sources for (a,d) COT and CER from the (b,e) 2.1 μm and (c,f) 3.7 μm channels as a function of a single parameter (COT or CER). In addition to the total retrieval uncertainty (thick black line), error source components include instrument radiometric uncertainty (dashed blue) plus uncertainty in 3.7μm solar spectral irradiance (dotted blue, for panels c and f only), surface albedo (thin black), above-cloud atmospheric correction including path transmittance and above-cloud precipitable water errors but excluding O3 (dashed red), cloud model effective variance (dashed green), and above-cloud O3 transmittance correction for the 0.66 μm channel (dashed purple). Further details are given in Table IV. Though O3 has no impact on the 2.1 μm channel atmospheric transmittance, the stronger influence of that error source for small 2.1 μm CER uncertainties is because many of the smaller CER retrievals correlate closely with small COT (Fig. 13(c,f)). At the smaller COT, the solution space becomes quite compressed and potentially non-unique for small CER (e.g., Fig. 11). In contrast, for the 3.7 μm uncertainty plots, the solution space is more orthogonal and there is less sensitivity to COT [13]. The retrieval probability distribution (grey line) is shown on the right ordinate of each panel, showing that the COT and CER modes roughly correspond to a minimum in the total uncertainty curve for this example granule.
Fig. 13.
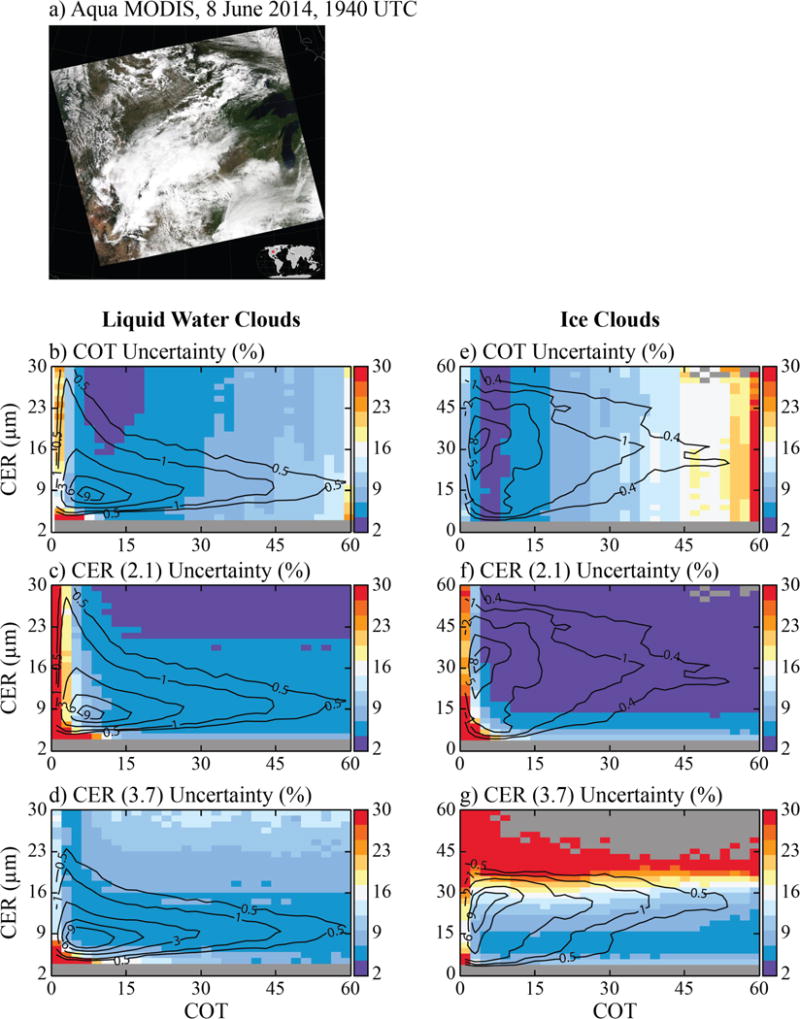
Total calculated mean liquid water and ice cloud retrieval uncertainties binned as a function of COT and CER for all successful retrievals from the central U.S. granule shown in (a). COT uncertainties (b, e) are relatively higher at small and large COT with sensitivity to CER only for the smallest sizes. CER uncertainties (c,d,f,g) are generally higher at small COT and CER. Grey-shaded bins either indicate effective radius values outside the LUT or the absence of pixels in the granule with that COT-CER retrieval pair. Contours of normalized retrieval counts for the COT and CER pairs are also shown.
Fig. 14.
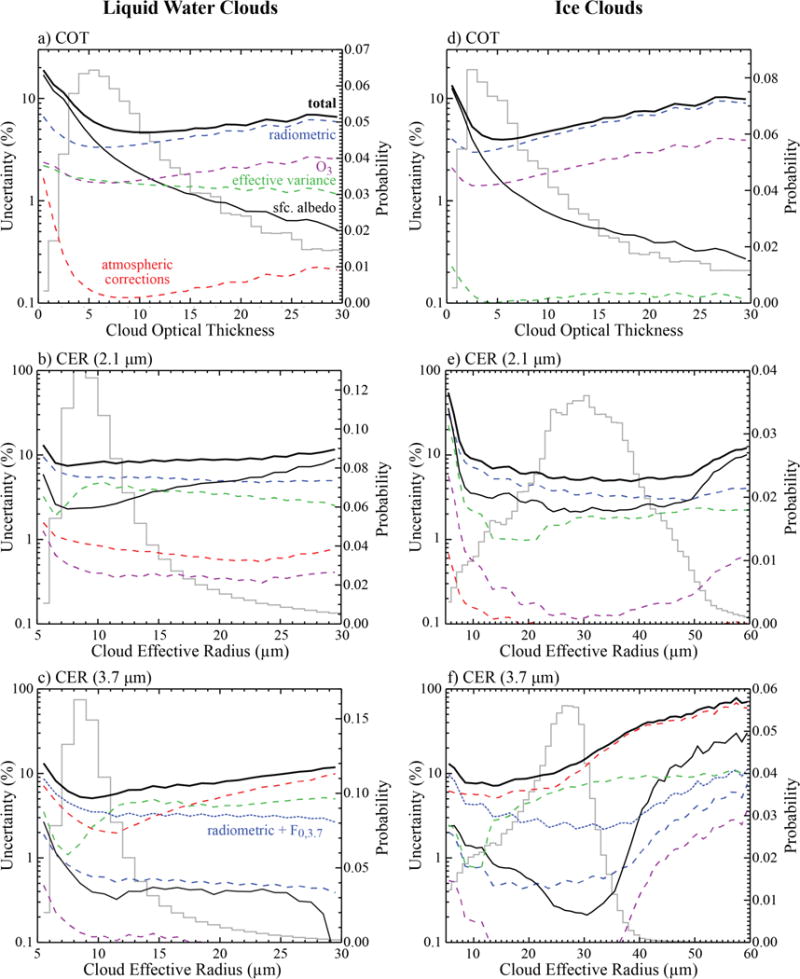
For the granule of Fig. 13, mean liquid water and ice retrieval uncertainties (left ordinate) as a function of COT or CER for the following error source components: total (i.e., all error sources, thick black line), instrument radiometric uncertainty (dashed blue) plus uncertainty in 3.7μm solar spectral irradiance (dotted blue, panels c and f only), surface albedo (thin black), above-cloud atmospheric correction including path transmittance and above-cloud precipitable water errors but excluding O3 (dashed red), cloud effective variance (dashed green), and above-cloud O3 transmittance correction for the 0.66μm channel (dashed purple). See Table IV for details. The retrieval probability distribution (grey line) is shown on the right ordinate of each panel.
The significance of Figs. 11–13 is that asking for a single metric for the optical retrieval uncertainty is an ill-posed question. The answer unequivocally depends on numerous factors such as surface type, solar and viewing geometry, atmospheric state, surface and cloud temperature (3.7 μm), and most importantly the location of the retrieval solution within the COT and CER solution space. Moreover, these uncertainty estimates should be considered a baseline, or minimum, uncertainty to the extent that error sources such as 3D radiative effects are not included in the analysis.
IV. Impacts to Global Statistics
The above C6 updates have had a profound impact on the global cloud optical and microphysical property statistics derived from the MOD06 retrievals. Here, these impacts are discussed via comparisons of the C5 and C6 spatially aggregated global Level-3 product (MOD08) that provides scalar statistics and 1D and 2D histograms on a 1° equal-angle grid for daily (D3), eight-day (E3), and monthly (M3) time periods. The MOD08 product itself has been updated for C6, and now includes statistics for the pixel population identified as partly cloudy (PCL) by the Clear Sky Restoral (CSR) algorithm (i.e., pixels with CSR = 1,3 designations, see Section III D) along with separate aggregations for COT and CER retrievals from channel pairs using the 1.6 μm and 3.7 μm channels (see Section III C). Here, monthly statistics derived from the daily MOD08_D3 and obtained directly from the monthly MOD08_M3 aggregations are shown, namely for Aqua MODIS during November 2012. Note that the present discussion is intended to provide only a general overview of the statistical impacts of the C6 MOD06 updates; a more detailed analysis of C6 Level-3 statistics is left for future efforts.
The November 2012 monthly cloud fraction, derived from pixel-weighted daily MOD08_D3 aggregations of the MOD35 cloud mask, is shown in Fig. 15(a). The fraction of the MOD35 cloudy pixels identified as “not cloudy” by the MOD06 CSR algorithm (i.e., CSR = 2 designation, see Section III D) is shown in (b), and is derived here from MOD08_D3 daily aggregations of the CSR results. Because MOD35 is designed to identify obstructed, i.e., “not clear,” pixels, in some regions the MOD35 cloud fraction may in fact be overestimated as it may incorrectly identify optically thicker aerosols (e.g., dust, smoke) or strong sunglint as clouds. For November 2012, the CSR algorithm identified a large fraction of the MOD35 cloudy pixel population as “not cloudy” over the In-do-Gangetic Plain in northern India, a region known to suffer persistent air pollution [67]–[69] and that for this month was observed by the MOD04 Dark Target aerosol product to have a large monthly mean aerosol optical depth (not shown), as well as over the relatively cloud-free portion of the northern Arabian Sea where sunglint conditions are commonly encountered. A small fraction of the MOD35 cloudy pixels in low cloud fraction regions over the tropical oceans are also identified as “not cloudy” by the CSR algorithm, again likely due to sunglint (potentially in combination with small broken clouds).
Fig. 15.
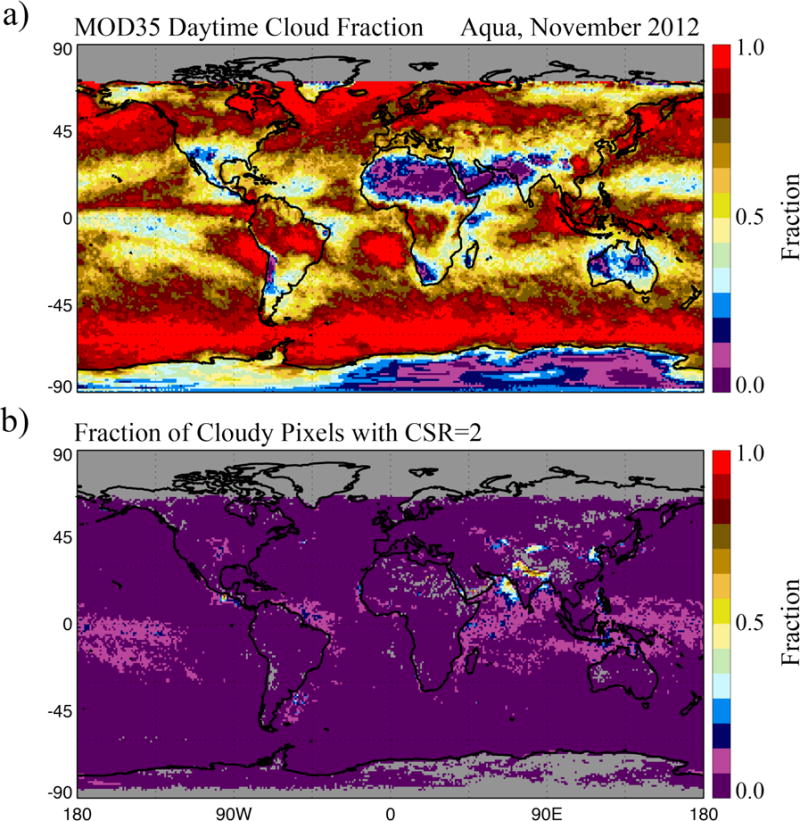
Aqua MODIS monthly (a) cloud fraction from the MOD35 cloud mask and (b) fraction of cloudy pixels that were identified as “not cloudy” by the MOD06 CSR algorithm (i.e., CSR = 2 designation) for November 2012.
For cloud optical and microphysical property retrievals, the MOD08 statistical aggregations are performed separately by cloud thermodynamic phase. Improvements to the COP thermodynamic phase algorithm for C6 have yielded substantial changes to the liquid, ice, and undetermined pixel populations with respect to C5. These changes are readily seen in the November 2012 monthly cloud phase fraction plots shown in Fig. 16. The C5 liquid, ice, and undetermined phase fractions are shown in (a), (b), and (c), respectively; C6 phase fractions are shown in (d), (e), and (f), respectively. Both the C5 and C6 fractions are calculated directly from the pixel-level MOD06 product using a research-level aggregation code. The phase fraction is defined here as the fraction of total (clear plus cloudy) pixels identified as “overcast” cloudy by the CSR algorithm (CSR = 0 designation) and either liquid, ice, or undetermined phase by the COP phase algorithm; note these fractions include cloudy pixels regardless of the success of the cloud optical and microphysical retrievals, and thus are different from the cloud retrieval fractions that are the respective fractions of total pixels having successful liquid, ice, or undetermined retrievals. First, it is evident that the C6 COP phase algorithm identifies a significantly larger fraction of liquid phase clouds than does C5, in particular over the southern oceans, roughly below latitude 45° S. This regional increase in liquid phase fraction for C6 is accompanied by a regional decrease in ice phase fraction. Note also that the C6 undetermined phase fraction has decreased compared to C5; further analysis (not shown here) reveals that most of this decrease is the result of C5 undetermined phase pixels being identified (and validated) as liquid phase in C6 [61].
Fig. 16.
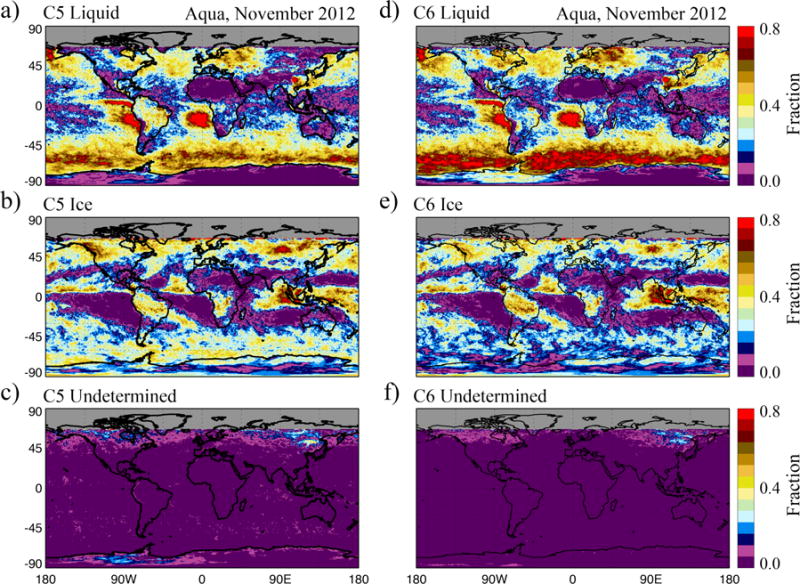
November 2012 Aqua MODIS monthly cloud fraction (CSR = 0), by COP phase algorithm designation, for C5 (a) liquid, (b) ice, and (c) undetermined phase, and C6 (d) liquid, (e) ice, and (f) undetermined phase.
Fig. 17 shows C6 monthly (a) liquid and (b) ice phase fractions for the partly cloudy PCL pixel population (CSR = 1,3 designations). Similar to Fig. 16, these fractions include cloudy pixels regardless of the success of the cloud optical and microphysical retrievals. First note that, for this month, the ice phase PCL pixel population is small, with fractions generally less than a few percent. The liquid phase PCL fraction, on the other hand, is much larger, with values approaching 20% or more. The liquid phase PCL fraction maxima are primarily located in regions where the cloud fraction (Fig. 15) is smaller, i.e., more broken cloud regimes, in particular over the ocean due to the partly cloudy CSR = 3 test; note that this test, which uses the MOD35 250 m sub-pixel cloudiness flags, is only applied over water surfaces.
Fig. 17.
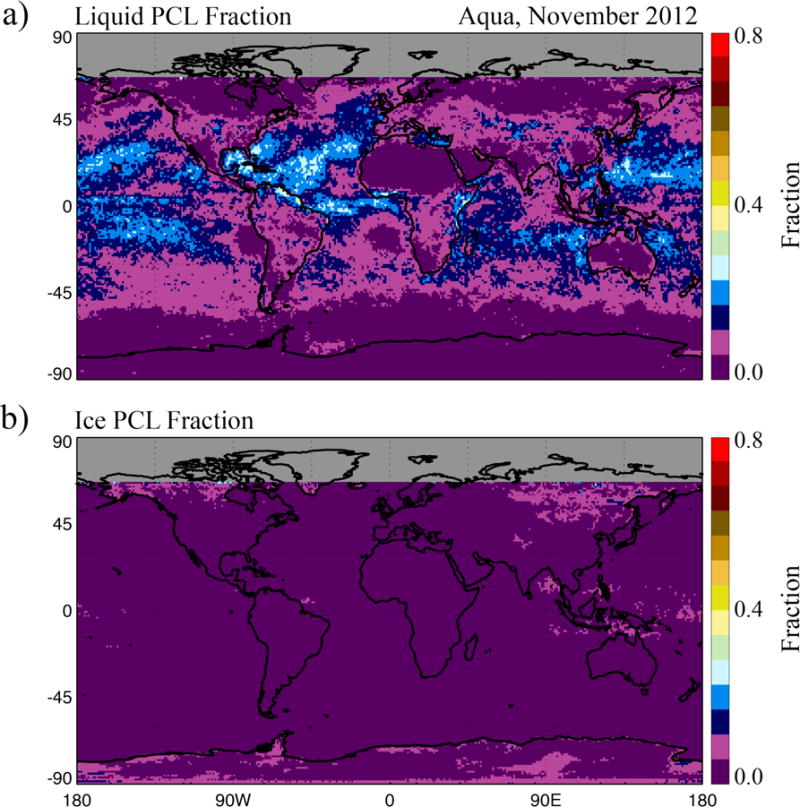
November 2012 Aqua MODIS monthly (a) liquid and (b) ice cloud fraction for the partly cloudy PCL pixel population (CSR = 1,3 designations).
The changes in the liquid and ice phase pixel populations shown in Fig. 16 will in turn impact the monthly cloud optical and microphysical retrieval statistics. Monthly mean liquid phase COT and CER for November 2012, using the channel combination that includes 2.1 μm, are shown in Fig. 18 for C5 ((a) and (b), respectively) and C6 ((c) and (d), respectively). Note that the C6 pixel population is limited here to those pixels identified as “overcast” by the CSR algorithm (CSR = 0 designation) to remain consistent with the C5 MOD06 decision to report retrievals only for those pixels having CSR = 0; these means are obtained directly from the MOD08_M3 monthly product. While the monthly mean liquid phase CER between C5 and C6 appears relatively consistent, the monthly mean liquid phase COT is generally larger in C6 than in C5, in particular over the southern oceans where the largest changes in cloud phase identification occurred (increased C6 liquid phase fraction, see Fig. 16) as well as across the high northern latitudes. Note also that a decrease in monthly mean liquid phase COT for C6 is observed over Antarctica, again possibly due to an increase in liquid phase fraction, though in this region the cloud fractions are generally small.
Fig. 18.
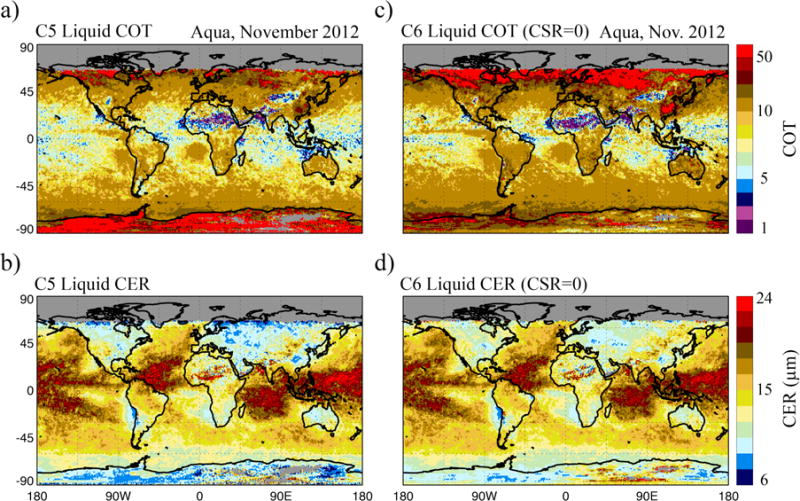
November 2012 Aqua MODIS monthly mean liquid phase COT and CER, using the channel combination that includes 2.1 μm, for C5 ((a) and (b), respectively) and C6 ((c) and (d), respectively). To remain consistent with the C5 MOD06 decision to report only those retrievals identified as “overcast” by the CSR algorithm (CSR = 0 designation), the C6 means shown here are for the CSR = 0 pixel population only.
For ice phase clouds, in addition to the change in pixel population, the new ice crystal radiative model for C6 (i.e., severely roughened aggregated columns) will also impact the monthly retrieval statistics, namely by yielding smaller COT, due to a smaller asymmetry factor for C6, as well as larger CER from the 2.1 μm wavelength channel, due to a smaller co-albedo (see Section III A). Monthly mean ice phase COT and CER for November 2012, using the channel combination that includes 2.1 μm, are shown in Fig. 19 for C5 ((a) and (b), respectively) and C6 ((c) and (d), respectively). The C6 pixel population is again limited to those pixels identified as “overcast” by the CSR algorithm (CSR = 0 designation), and all means are obtained directly from the MOD08_M3 monthly product. Disregarding ice phase pixel population differences, the monthly mean COT for C6 is smaller than for C5, and the monthly mean CER is larger, as expected due to the changes in the assumed ice crystal single scattering properties.
Fig. 19.
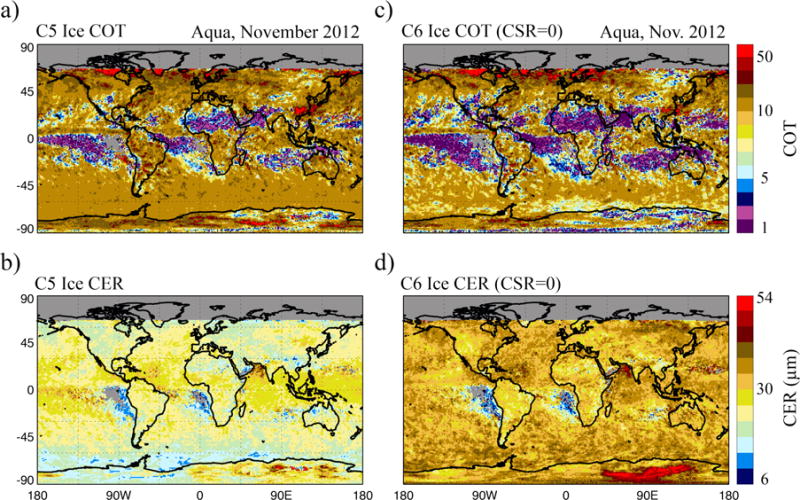
Same as Fig. 18, except for ice phase clouds.
The impact of excluding the partly cloudy PCL pixel population (CSR = 1,3 designations) on monthly liquid phase COT and CER means, as was previously done in C5, is shown in Fig. 20. Here, the monthly mean liquid phase (a) COT and spectral CER from the (b) 1.6, (c) 2.1, and (d) 3.7 μm wavelength channels are shown in the left column for the “overcast” CSR = 0 population. The respective differences between monthly means of the CSR = 0 pixel population and the entire liquid cloud pixel population (CSR = 0,1,3 designations) are shown in the right column; the differences are defined here such that a monthly mean increase (decrease) when excluding PCL pixels is identified by warmer (cooler) colors. With the exception of Antarctica, as well as the stratocumulus regions off the southwest coasts of Africa and South America where the liquid phase PCL fraction is low (see Fig. 17), it is evident here that excluding the PCL pixels in the calculation of monthly mean liquid phase COT yields larger mean COT, with absolute differences in some regions of up to 2 or more. This result for COT is expected, given that the PCL pixel population is presumably composed of heterogeneous broken cloudy or cloud edge pixels. The spectral CER differences, on the other hand, are more mixed with regions of high liquid cloud fraction (see Fig. 16) exhibiting little to no difference in mean CER, and regions with low liquid cloud fraction (i.e., more broken cloud regimes) having either increased or decreased mean CER when excluding the PCL pixels.
Fig. 20.
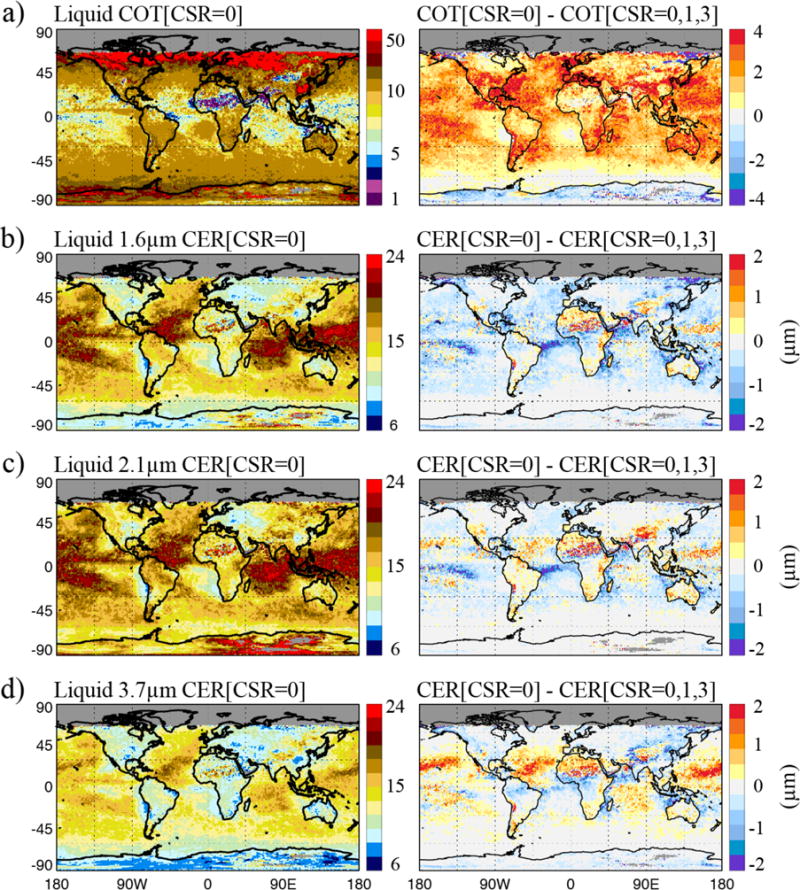
November 2012 Aqua MODIS monthly mean liquid phase (a) COT and CER from the (b) 1.6, (c) 2.1, and (d) 3.7 μm wavelength channels for the “overcast” CSR=0 pixel population. Note that the C5 MOD06 cloud optical and microphysical properties were reported only for this pixel population. The impacts of excluding the partly cloudy PCL pixel population (CSR = 1,3 designations) in calculations of the monthly mean COT and spectral CER retrievals are shown in the right column.
The impact of excluding the partly cloudy PCL pixel population on monthly mean ice phase COT for the three primary spectral CER retrievals is shown in Fig. 21. Similar to Fig. 20, the monthly mean ice phase (a) COT and spectral CER from the (b) 1.6, (c) 2.1, and (d) 3.7 μm wavelength channels are shown in the left column for the “overcast” CSR = 0 population, and the respective differences between monthly means of the CSR = 0 pixel population and the entire ice cloud pixel population (CSR = 0,1,3 designations) are shown in the right column. Unlike the liquid phase mean, monthly mean ice phase COT is generally unchanged, or in some regions is only slightly smaller (absolute differences less than 1), when excluding the PCL pixels. The exception is over Antarctica, where mean COT generally increases when excluding PCL pixels. A more discernable pattern is also exhibited by the ice phase spectral CER monthly means, as regions of higher ice cloud fraction show little to no difference, and regions of lower ice cloud fraction over ocean and land have smaller and larger mean CER, respectively, when excluding the PCL pixels. Again, the exception is over Antarctica, where monthly mean CER from all three spectral channels is generally smaller when excluding the PCL pixels.
Fig. 21.

Same as Fig. 20, except for ice phase clouds.
Finally, as previously mentioned (Section II), a new L1B re-aggregation scheme has been applied to Aqua MODIS Atmosphere Team C6 processing to help ameliorate a known focal plane misalignment between the two 250 m resolution channels (0.66 and 0.87 μm) and the 500 m resolution channels (0.47, 0.55, 1.24, 1.6, and 2.1 μm). This re-aggregation had noticeable effects on COT and CER statistics in broken low cloud regimes (not shown), though the effects are generally much smaller than those of the other C6 algorithm updates discussed in Section III. Liquid water cloud retrieval fractions increase slightly over the ocean, up by as much as 0.02–0.5 in some regions. COT decreased somewhat, by about 2 over many ocean and land regions. CER changes were both positive (e.g., +2 μm in tropical Atlantic and Pacific, and broadly over many land masses) and negative (−1 μm in marine stratocumulus regimes).
V. Summary and Guidance for Users
Many updates to the Collection 6 (C6) MOD06 cloud optical and microphysical property product were introduced to provide additional information previously not available in C5, such as separately reporting cloud effective particle radius (CER) retrievals from three absorbing spectral channels (1.6, 2.1, and 3.7 μm), reporting retrievals for pixels identified as either partly cloudy or at cloud edge by the Clear Sky Restoral (CSR) algorithm, and reporting information to diagnose retrieval failures. However, such additional information may lead to confusion or erroneous conclusions if interpreted improperly. Here, best-practice guidance is provided for appropriate interpretation and usage of several key features of the C6 MOD06 cloud optical and microphysical property product.
A. Retrieval Quality
Previously in C5, the quality of the cloud optical and microphysical retrievals was provided in part by a Confidence QA bit flag (values from 0 for no confidence to 3 for high confidence) within the Quality_Assurance_1km SDS, as well as the pixel-level retrieval uncertainty. In C6, however, the Confidence QA is now set to 3 (i.e., high confidence) for all successful retrievals such that it is no longer useful for quality assessment. Nevertheless, sufficient information is provided in accompanying SDSs for users to infer retrieval quality.
Because large pixel-level retrieval uncertainty implies the reflectance observations lie in a portion of the LUT solution space that is less sensitive to the retrieved quantity, users are advised to determine retrieval quality in part via retrieval uncertainty; note that the maximum reported retrieval uncertainty for all optical and microphysical quantities is 200%. However, uncertainties on the order of 50% might be expected to be of little value for science analysis since the calculations are considered to give a baseline (minimum) uncertainty due to error sources not included and also due to the linear assumption inherent in the calculations (Eq. 4). Users are also encouraged to look at the sub-pixel heterogeneity index [28] reported in the new Cloud_Mask_SPI SDS that provides a measure of scene variability within each 1 km pixel. Large sub-pixel heterogeneity has been shown to be associated with retrieval biases [22], [32] and increased retrieval failure rates [63]. Likewise, users can also query the Cloud_Multi_Layer_Flag SDS in conjunction with the Quality_Assurance_1km SDS, as multi-layer cloud scenes are problematic for retrievals such as MOD06 that assume a single cloud layer and phase. A full description of the individual bit settings in the QA SDS is provided as an SDS attribute in every MOD06 file. Users should check the sixth byte of the QA for the results of the individual multilayer cloud tests, and are currently advised to exclude multilayer pixel detection when only the PH test is triggered due to false positives produced for moderately thick single layer ice clouds (see Section III D).
Finally, in some instances the cloud top retrievals may fail, e.g., due to known saturation issues with the 14 μm CO2-slicing channel. In these cases the MOD06 optical and microphysical retrievals default to the surface temperature and pressure for the cloud top assumption and atmospheric corrections, thus yielding suspect retrievals. Users are advised to discard MOD06 optical and microphysical retrievals that have corresponding 1 km cloud top temperature or pressure retrievals set to fill values.
B. Interpreting the Spectral Microphysical Retrievals
While the three absorbing spectral channels used to retrieve CER have been shown to have different penetration depths within a plane-parallel, vertically inhomogeneous cloud [70], users should nevertheless be cautious drawing conclusions from CER retrieval differences, e.g., inferring vertical cloud droplet size distributions. Horizontal heterogeneity has also been shown to impact spectral CER retrievals differently [32], [22]. Errors in atmospheric corrections, the 3.7 μm emission correction, etc., may yield artifacts in the spectral CER differences. In addition, 1.6 μm CER retrievals from Aqua MODIS require greater scrutiny due to known non-functioning detectors and potential unknown issues with the remaining functional detectors.
C. Using PCL Retrievals
As discussed in Section III D, retrievals of pixels identified as either partly cloudy or at cloud edge are now reported in C6, whereas they were discarded in C5. Caution should nevertheless be exercised when using these PCL retrievals. It has been shown that PCL pixels have the highest rates of cloud optical and microphysical retrieval failure, as roughly 34% of attempted retrievals of global over-ocean liquid phase PCL pixels using the VNSWIR − 2.1 μm channel pair failed, compared to a failure rate of roughly 10% for overcast CSR = 0 pixels [63]. This result implies a likely failure in the homogeneous 1D plane-parallel cloud radiative model, and gives some credence to the C5 approach of discarding all PCL pixels. Furthermore, sub-pixel cloud heterogeneity has also been shown to cause CER retrieval biases, as well as artificial differences in spectral CER retrievals [22], [32].
D. Interpreting the Retrieval Failure Metric
The Retrieval Failure Metric (RFM) represents an attempt to provide additional information about COT and CER retrieval failures, specifically the look-up table (LUT) COT and CER values nearest to the observed reflectances (when applicable) and a Cost Metric that provides a measure of the “degree of failure,” i.e., the relative distance of the observed reflectances from the LUT solution space. The RFM COT, CER, and Cost Metric parameters are assigned values such that the user can ascertain how a given spectral retrieval failed (see Fig. 11 and Table III). While smaller Cost Metric values do indicate the observed reflectances may be close to the LUT solution space, and thus indicate a greater confidence in the RFM COT and CER values, users are nevertheless cautioned against quantitatively using this data, e.g., for process studies, etc.
While this paper is intended as a resource for users of the C6 MODIS cloud optical properties products, as an overview document it necessarily is limited to succinct summaries of major C6 changes and results. Additional details on all aspects of C6 MOD06/MYD06 optical property algorithms, datasets, quality assessment information, format, content, and best practices are available in the online cloud optical property C6 User Guide posted to the MODIS Atmosphere Team web site [71]. The user guide also provides information on associated sampled (MODATML2/MYDATML2) and gridded Level-3 (MOD08/MYD08) datasets. All users are encouraged to consult the guide for further information.
Acknowledgments
We are grateful to Edward Masuoka, MODIS Adaptive Processing System (MODAPS) lead, and his team for enabling extensive product testing during C6 algorithm development, in particular V. Starry Manoharan for MODIS Atmosphere Team quality assessment support. Xiaoxiong (Jack) Xiong and his MODIS Characterization and Support Team (MCST) provided critical support in quantifying MODIS reflectance radiometric uncertainties. We thank S. A. Ackerman, R. Frey, and B. A. Baum for many helpful discussions regarding the C6 cloud masking and cloud top property products, as well as L. Oreopoulos, T. Fauchez, and L. Di Girolamo for helpful feedback. All MODIS data used here are publically available from the NASA Land and Atmospheres Archive and Distribution System (LAADS) at ladsweb.nascom.nasa.gov/data/; DOI information for the C6 cloud product is given in [5].
This work was supported by NASA through the MODIS Science Team and the Radiation Sciences Program. The work of M. D. King was supported by NASA under Grant NNX14AO70G to the University of Colorado. The work of R. E. Holz was supported by NASA under Grant NNX14AO69G to the University of Wisconsin.
Contributor Information
Steven Platnick, Earth Sciences Division, NASA Goddard Space Flight Center, Greenbelt, MD 20771 USA.
Kerry G. Meyer, Goddard Earth Science Technology and Research, Universities Space Research Association, Columbia, MD 21046 USA
Michael D. King, Laboratory for Atmospheric and Space Physics, University of Colorado, Boulder, CO 80303 USA and the Texas A&M University Institute of Advanced Study.
Galina Wind, Science Systems and Applications, Inc., Lanham, MD 20706 USA.
Nandana Amarasinghe, Science Systems and Applications, Inc., Lanham, MD 20706 USA.
Benjamin Marchant, Goddard Earth Science Technology and Research, Universities Space Research Association, Columbia, MD 21046 USA.
G. Thomas Arnold, Science Systems and Applications, Inc., Lanham, MD 20706 USA.
Zhibo Zhang, Department of Physics, University of Maryland – Baltimore County, Baltimore, MD 21250 USA.
Paul A. Hubanks, ADNET Systems, Inc., Bethesda, MD 20817 USA
Robert E. Holz, Space Science and Engineering Center, University of Wisconsin – Madison, Madison, WI 53706 USA
Ping Yang, Department of Atmospheric Sciences, Texas A&M University, College Station, TX 77845 USA.
William L. Ridgway, Science Systems and Applications, Inc., Lanham, MD 20706 USA
Jérôme Riedi, Laboratoire d’Optique Atmosphérique, Université de Lille – Sciences et Technologies, Villeneuve d’Ascq, France.
References
- 1.Salomonson VV, Barnes WL, Maymon PW, Montgomery HE, Ostrow H. MODIS: Advanced facility instrument for studies of the Earth as a system. IEEE Trans Geosci Remote Sens. 1989 Mar;27(2):145–153. [Google Scholar]
- 2.King MD, Kaufman YJ, Menzel WP, Tanré D. Remote sensing of cloud, aerosol and water vapor properties from the Moderate Resolution Imaging Spectrometer (MODIS) IEEE Trans Geosci Remote Sens. 1992 Jan;30(1):2–27. [Google Scholar]
- 3.Justice CO, Townshend JRG, Vermote EF, Masuoka E, Wolf RE, Saleous N, Roy DP, Morisette JT. An overview of MODIS land data processing and product status. Remote Sens Environ. 2002 Nov;83(1-2):3–15. [Google Scholar]
- 4.Esaias WE, Abbott MR, Barton I, Brown OW, Campbell JW, Carder KL, Clark DK, Evans RH, Hoge FE, Gordon HR, Balch WM, Letelier R, Minnett PJ. An overview of MODIS capabilities for ocean science observations. IEEE Trans Geosci Remote Sens. 1998 Jul;36(5):1250–1265. [Google Scholar]
- 5.Platnick S, Ackerman SA, King MD, Meyer K, Menzel WP, Holz RE, Baum BA, Yang P. NASA MODIS Adaptive Processing System. NASA Goddard Space Flight Center; Greenbelt, MD: 2015. MODIS Atmosphere L2 Cloud Product (06_L2) http://dx.doi.org/10.5067/MODIS/MOD06_L2.006. [Google Scholar]
- 6.Platnick S, King MD, Ackerman SA, Menzel WP, Baum BA, Riedi JC, Frey RA. The MODIS cloud products: Algorithms and examples from Terra. IEEE Trans Geosci Remote Sensing. 2003 Feb;41(2):459–473. [Google Scholar]
- 7.Menzel WP, Frey RA, Zhang H, Wylie DP, Moeller CC, Holz RE, Maddux B, Baum BA, Strabala KI, Gumley LE. MODIS global cloud-top pressure and amount estimation: Algorithm description and results. J Appl Meteorol Climatol. 2008 Apr;47(4):1175–1198. [Google Scholar]
- 8.Baum BA, Menzel WP, Frey RA, Tobin DC, Holz RE, Ackerman SA, Heidinger AK, Yang P. MODIS cloud-top property refinements for collection 6. J Appl Meteorol Climatol. 2012 Jun;51(6):1145–1163. [Google Scholar]
- 9.Wylie DP, Menzel WP. Eight years of high cloud statistics using HIRS. J Clim. 1999 Jan;12(1):170–184. [Google Scholar]
- 10.Nakajima T, King MD. Determination of the optical thickness and effective particle radius of clouds from reflected solar radiation measurements, Part I: Theory. J Atmos Sci. 1990 Aug;47(15):1878–1893. [Google Scholar]
- 11.Platnick S, Twomey S. Determining the susceptibility of cloud albedo to changes in droplet concentration with the advanced very high resolution radiometer. J Appl Meteor. 1994 Mar;33(3):334–347. [Google Scholar]
- 12.Platnick S, Valero FPJ. A validation study of a satellite cloud retrieval during ASTEX. J Atmos Sci. 1995 Aug;52(16):2985–3001. [Google Scholar]
- 13.Platnick S, Li JY, King MD, Gerber H, Hobbs PV. A solar reflectance technique for cloud retrievals over snow and ice surfaces. J Geophys Res. 2001 Jul;106(D14):15185–15199. [Google Scholar]
- 14.King MD, Platnick S, Yang P, Arnold GT, Gray MA, Riedi JC, Ackerman SA, Liou KN. Remote sensing of liquid water and ice cloud optical thickness and effective radius in the arctic: Application of airborne multispectral MAS data. J Atmos Oceanic Technol. 2004 Jun;21(6):857–875. [Google Scholar]
- 15.King MD, Platnick S, Hubanks PA, Arnold GT, Moody EG, Wind G, Wind B. Collection 005 Change Summary for the MODIS Cloud Optical Properties (06_OD) Algorithm. NASA Goddard Space Flight Center; Greenbelt, MD: 2008. p. 23. [Online] Available: http://modis-atmos.gsfc.nasa.gov/_docs/C005CloudOpticalPropertiesver3.3.pdf. [Google Scholar]
- 16.King MD, Tsay SC, Platnick SE, Wang M, Liou KN. Cloud Retrieval: Algorithms for MODIS: Optical Thickness, Effective Particle Radius, and Thermodynamic Phase. NASA Goddard Space Flight Center; Greenbelt, MD: 1997. p. 79. [Online] Available: http://modis-atmos.gsfc.nasa.gov/_docs/atbd_mod05.pdf. [Google Scholar]
- 17.King MD, Menzel WP, Kaufman YJ, Tanré D, Gao BC, Platnick S, Ackerman SA, Remer LA, Pincus R, Hubanks PA. Cloud and aerosol properties, precipitable water, and profiles of temperature and water vapor. IEEE Trans Geosci Remote Sens. 2003 Feb;41(2):442–458. [Google Scholar]
- 18.Baum BA, Yang P, Heymsfield AJ, Platnick S, King MD, Hu YX, Bedka ST. Bulk scattering properties for the remote sensing of ice clouds. 2: Narrowband models. J Appl Meteorol. 2005 Dec;44(12):1896–1911. [Google Scholar]
- 19.Yang P, Zhang L, Hong G, Nasiri SL, Baum BA, Huang HL, King MD, Platnick S. Differences between collection 004 and 005 MODIS ice cloud optical/microphysical products and their impact on radiative forcing simulations. IEEE Trans Geosci Remote Sens. 2007 Sep;45(9):2886–2899. [Google Scholar]
- 20.Wind G, Platnick S, King MD, Hubanks PA, Pavolonis MJ, Heidinger AK, Yang P, Baum BA. Multilayer cloud detection with the MODIS near-infrared water vapor absorption band. J Appl Meteorol Climatol. 2010 Nov;49(11):2315–2333. [Google Scholar]
- 21.Joiner JA, Vasilkov P, Bhartia PK, Wind G, Platnick S, Menzel WP. Detection of multi-layer and vertically-extended clouds using A-Train sensors. Atmos Meas Tech. 2010;3:233–247. [Google Scholar]
- 22.Zhang Z, Platnick S. An assessment of differences between cloud effective particle radius for marine water clouds from three MODIS spectral bands. J Geophys Res. 2011;116:D20215. doi: 10.1029/2011JD016216. [DOI] [Google Scholar]
- 23.Pincus R, Platnick S, Ackerman SA, Hemler RS, Hofmann RJP. Reconciling simulated and observed views of clouds: MODIS, ISCCP, and the limits of instrument simulators. J Climate. 2012 Jul;25(13):4699–4720. [Google Scholar]
- 24.Platnick S, Pincus R, Wind B, King MD, Gray M, Hubanks P. An initial analysis of the pixel-level uncertainties in global MODIS cloud optical thickness and effective particle size retrievals. In: Tsay SC, Yokota T, Ahn MH, editors. Passive Optical Remote Sensing of the Atmosphere and Clouds IV. Vol. 5652. 2004. pp. 30–40. Proc of SPIE. [Google Scholar]
- 25.King MD, Platnick S, Menzel WP, Ackerman SA, Hubanks PA. Spatial and temporal distribution of clouds observed by MODIS onboard the Terra and Aqua satellites. IEEE Trans Geosci Remote Sens. 2013 Jul;51(7):3826–3852. [Google Scholar]
- 26.King MD, Platnick S, Wind G, Arnold GT, Dominguez RT. Remote sensing of radiative and microphysical properties of clouds during TC4: Results from MAS, MASTER, MODIS, and MISR. J Geophys Res. 2010 Jul;115:D00J07. doi: 10.1029/2009JD013277. [DOI] [Google Scholar]
- 27.Riedi J, Marchant B, Platnick S, Baum B, Thieuleux F, Oudard C, Parol F, Nicolas JM, Dubuisson P. Cloud thermodynamic phase inferred from merged POLDER and MODIS data. Atmos Chem Phys. 2010;10:11851–11865. [Google Scholar]
- 28.Liang L, Girolamo L Di, Platnick S. View-angle consistency in reflectance, optical depth, and spherical albedo of marine water clouds off the coast of California through MISR-MODIS fusion. Geophys Res Lett. 2009;36:L09811. doi: 10.1029/2008GL037124. [DOI] [Google Scholar]
- 29.Maddux BC, C B, Ackerman SA, Platnick S. Viewing geometry dependencies in MODIS cloud products. J Atmos Oceanic Tech. 2010 Sep;27(9):1519–1528. [Google Scholar]
- 30.Zeng S, Cornet C, Parol F, Riedi J, Thieuleux F. A better understanding of cloud optical thickness derived from the passive sensors MODIS/AQUA and POLDER/PARASOL in the A-Train constellation. Atmos Chem Phys. 2012;12:11245–11259. doi: 10.5194/acp-12-11245-2012. [DOI] [Google Scholar]
- 31.Zhang Z, Platnick S, Yang P, Heidinger A, Comstock JM. Effect of ice particle size vertical inhomogeneity on the passive remote sensing of ice clouds. J Geophys Res. 2010;15:D17203. doi: 10.1029/2010JD013835. [DOI] [Google Scholar]
- 32.Zhang Z, Ackerman AS, Feingold G, Platnick S, Pincus R, Xue H. Effects of cloud horizontal inhomogeneity and drizzle on remote sensing of cloud droplet effective radius: Case studies based on large-eddy simulations. J Geophys Res. 2012;117:D19208. doi: 10.1029/2012JD017655. [DOI] [Google Scholar]
- 33.L’Ecuyer TS, Jiang JH. Touring the atmosphere aboard the A-Train. Phys Today. 2010;63(7) doi: 10.1063/1.3463626. [DOI] [Google Scholar]
- 34.Holz RE, Platnick S, Meyer K, Vaughan M, Wind G, Dutcher S, Ackerman S, Heidinger A, Amarasinghe N, Wang C, Yang P. Resolving cirrus optical depth biases between CALIOP and MODIS using IR retrievals. Atmos Chem Phys Discuss. 2015;15:29455–29495. doi: 10.5194/acpd-15-29455-2015. [DOI] [Google Scholar]
- 35.Stubenrauch CJ, Rossow WB, Kinne S, Ackerman S, Cesana G, Chepfer H, Getzewich B, Di Girolamo L, Guignard A, Heidinger A, Maddux B, Menzel P, Minnis P, Pearl C, Platnick S, Poulsen C, Riedi J, Sun-Mack S, Walther A, Winker D, Zeng S, Zhao G. Assessment of global cloud datasets from satellites: Project and database initiated by the GEWEX Radiation Panel. Bull Am Meteor Soc. 2013 Jul;94(7):1031–1049. [Google Scholar]
- 36.Platnick S, Ackerman SA, Baum BA, Heidinger AK, Holz RE, King MD, Menzel WP, Nasiri S, Weisz E, Yang P. Assessment of IDPS VIIRS Cloud Products and Recommendations for EOS-era Cloud Climate Data Record Continuity. NASA Goddard Space Flight Center; Greenbelt, MD: Mar, 2013. p. 57. [Online] Available: http://npp.gsfc.nasa.gov/DEW_NPP_reports/VIIRS%20Cloud%20Products%20Report%20Mar-19-2013.pdf. [Google Scholar]
- 37.Minnis P, Sun-Mack S, Young DF, Heck PW, Garber DP, Chen Y, Spangenberg DA, Arduini RF, Trepte QZ, Smith WL, Jr, Ayers JK, Gibson SC, Miller WF, Hong G, Chakrapani V, Takano Y, Liou K-N, Xie Y, Yang P. CERES Edition-2 Cloud Property Retrievals Using TRMM VIRS and Terra and Aqua MODIS Data —Part I: Algorithms. IEEE Trans Geosci Rem Sens. 2011;49:1–27. doi: 10.1109/TGRS.2011.2144602. [DOI] [Google Scholar]
- 38.Minnis P, Sun-Mack S, Chen Y, Khaiyer MM, Yi Y, Ayers JK, Brown RR, Dong X, Gibson SC, Heck PW, Lin B, Nordeen ML, Nguyen L, Palikonda R, Smith WL, Jr, Spangenberg DA, Trepte QZ, Xi B. CERES Edition-2 Cloud Property Retrievals Using TRMM VIRS and Terra and Aqua MODIS Data —Part II: Examples of Average Results and Comparisons With Other Data. IEEE Trans Geosci Rem Sens. 2011;49:1–27. doi: 10.1109/TGRS.2011.2144601. [DOI] [Google Scholar]
- 39.Yang P, Bi L, Baum BA, Liou KN, Kattawar GW, Mishchenko MI, Cole B. Spectrally consistent scattering, absorption, and polarization properties of atmospheric ice crystals at wavelengths from 0.2 to 100 μm. J Atmos Sci. 2013 Jan;70(1):330–347. [Google Scholar]
- 40.Pavolonis MJ, Heidinger AK. Daytime cloud overlap detection from AVHRR and VIIRS. J Appl Meteorol. 2004 May;43(5):762–778. [Google Scholar]
- 41.Sun J, Angal A, Xiong X, Chen H, Wu A, Geng X, Choi T, Chu M. MODIS reflective solar bands calibration improvements in collection 6. Proc of SPIE. 2012;8528 doi: 10.1117/12.979733. [DOI] [Google Scholar]
- 42.Schaaf CB, Liu J, Gao F, Strahler AH. Aqua and Terra MODIS albedo and reflectance anisotropy products. In: Justice CO, Abrams MJ, editors. Land Remote Sensing and Global Environmental Change: NASA’s Earth Observing System and the Science of ASTER and MODIS, B Ramachandran. Springer; 2011. pp. 549–561. [Google Scholar]
- 43.Seemann SW, Borbas EE, Knuteson RO, Stephenson GR, Huang HL. Development of a global infrared land surface emissivity database for application to clear sky sounding retrievals from multispectral satellite radiance measurements”. J Appl Meteor Climatol. 2008 Jan;47(1):108–123. [Google Scholar]
- 44.Cox C, Munk W. The measurements of the roughness of the sea surface from photographs of the sun’s glitter. J Opt Soc Amer. 1954 Nov;44(11):838–850. [Google Scholar]
- 45.Levy RC, Mattoo S, Munchak LA, Remer LA, Sayer AM, Patadia F, Hsu NC. The Collection 6 MODIS aerosol products over land and ocean. Atmos Meas Tech. 2013;6:2989–3034. [Google Scholar]
- 46.Hsu NC, Jeong MJ, Bettenhausen C, Sayer AM, Hansell R, Seftor CS, Huang J, Tsay SC. Enhanced Deep Blue aerosol retrieval algorithm: the second generation. J Geophys Res. 2013 Aug;118(16):9296–9315. [Google Scholar]
- 47.Twomey S, Cocks T. Remote sensing of cloud parameters from spectral reflectance in the near-infrared. Beitr Phys Atmos. 1989;62:172–179. [Google Scholar]
- 48.Twomey S, Cocks T. Spectral reflectance of clouds in the near-infrared: Comparison of measurements and calculations. J Meteor Soc Japan. 1982 Jan;60(1):583–592. [Google Scholar]
- 49.Curran RJ, Wu MLC. Skylab near-infrared observations of clouds indicating supercooled liquid water droplets. J Atmos Sci. 1982 Macor;39(3):635–647. [Google Scholar]
- 50.Rawlins F, Foot JS. Remotely sensed measurements of stratocumulus properties during FIRE using the C130 aircraft multichannel radiometer. J Atmos Sci. 1990 Nov;47(21):2488–2503. [Google Scholar]
- 51.Nakajima T, King MD, Spinhirne JD, Radke LF. Determination of the optical thickness and effective particle radius of clouds from reflected solar radiation measurements, Part II: Marine stratocumulus observations. J Atmos Sci. 1991 Mar;47(5):728–750. [Google Scholar]
- 52.Han Q, Rossow WB, Lacis AA. Near-global survey if effective droplet radii in liquid water clouds using ISCCP data. J Clim. 1994 Apr;7(12):465–497. [Google Scholar]
- 53.Minnis P, Heck PW, Mayor S, Young DF. A near-global analysis of cloud microphysical properties. In: Smith WL, Stamnes K, editors. Proc IRS: Current Probl Atmos Radiat. Hampton, VA: Deepak Publ.; 1997. pp. 445–448. [Google Scholar]
- 54.Stamnes K, Tsay SC, Wiscombe W, Jayaweera K. Numerically stable algorithm for discrete-ordinate-method radiative transfer in multiple scattering and emitting layered media. Appl Optics. 1988 Jun;27(12):2502–2509. doi: 10.1364/AO.27.002502. [DOI] [PubMed] [Google Scholar]
- 55.Hale GM, Querry MR. Optical constants of water in the 200-nm to 200-μm wavelength region. Appl Opt. 1973 Mar;12(3):555–563. doi: 10.1364/AO.12.000555. [DOI] [PubMed] [Google Scholar]
- 56.Palmer KF, Williams D. Optical properties of water in the near infrared. J Opt Soc Amer. 1974 Aug;64(8):1107–1110. [Google Scholar]
- 57.Downing HD, Williams D. Optical constants of water in the infrared. J Geophys Res. 1975 Apr;80(12):1656–1661. [Google Scholar]
- 58.Cole BH, Yang P, Baum BA, Riedi J, C-Labonnote L, Thieuleux F, Platnick S. Comparison of PARASOL observations with polarized reflectances simulated using different ice habit mixtures. J Appl Meteorol Climatol. 2013 Jan;52(1):186–196. [Google Scholar]
- 59.van de Hulst HC. The spherical albedo of a planet covered with a homogeneous cloud layer. Astron & Astrophys. 1974;35:209–214. [Google Scholar]
- 60.Kahn B, Schreier M, Yue Q, Fetzer EJ, Irion B, Platnick S, Wang C, Nasiri S, L’Ecuyer T. Pixel-scale assessment and uncertainty analysis of AIRS and MODIS ice cloud optical thickness and effective radius. J Geophys Res. 2015;120:11669–11689. http://dx.doi.org/10.1002/2015JD023950. [Google Scholar]
- 61.Marchant B, Platnick S, Meyer K, Arnold GT, Riedi J. MODIS Collection 6 shortwave-derived cloud phase classification algorithm and comparisons with CALIOP. Atmos Meas Tech Discuss. 2015;8:11893–11924. doi: 10.5194/amt-9-1587-2016. [DOI] [PMC free article] [PubMed] [Google Scholar]
- 62.Gao BC, Goetz AF, Wiscombe WJ. Cirrus cloud detection from airborne imaging spectrometer data using the 1.38 μm water vapor band. Geophys Res Lett. 1993 Feb;20(4):301–304. [Google Scholar]
- 63.Cho HM, Zhang Z, Meyer K, Lebsock M, Platnick S, Ackerman AS, Di Girolamo L, C-Labonnote L, Cornet C, Rier R, Holben BN. Latitudinal variation of aerosol properties from Indo-Gangetic plain to central Himalayan foothills during TIGERZ campaign. J Geophys Res. 2014 Apr;119(8):4750–4769. [Google Scholar]
- 64.Lebsock MD, L’Ecuyer TS, Stephens GL. Detecting the ratio of rain and cloud water in low-latitude shallow marine clouds. J Appl Meteorol Climatol. 2011 Feb;50(2):419–432. [Google Scholar]
- 65.Nakajima TY, Suzuki K, Stephens GL. Droplet growth in warm water clouds observed by the A-train. Part I: A multisensor view. J Atmos Sci. 2010 Jun;67(6):1897–1907. [Google Scholar]
- 66.Rodgers CD. Inverse Methods for Atmospheric Sounding: Theory and Practice. World Scientific Publishing Co., Inc.; Hackensack, NJ, USA: 2000. p. 238. [Google Scholar]
- 67.Ramanathan V, Ramana MV. Persistent, widespread, and strongly absorbing haze over the Himalayan foothills and the Indo-Gangetic plains. Pure Appl Geophys. 2005 Aug;162(8-9):1609–1626. [Google Scholar]
- 68.Gautam R, Hsu NC, Tsay SC, Lau KM, Holben B, Bell S, Smirnov A, Li C, Hansell R, Ji Q, Payra S, Aryal D, Kayastha R, Kim KM. Accumulation of aerosols over the Indo-Gangetic plains and southern slopes of the Himalayas: Distribution, properties and radiative effects during the 2009 pre-monsoon season. Atmos Chem Phys. 2011 Dec;11(24):12841–12863. [Google Scholar]
- 69.Dumka UC, Tripathi SN, Misra A, Giles DM, Eck TF, Sagar R, Holben BN. Latitudinal variation of aerosol properties from Indo-Gangetic plain to central Himalayan foothills during TIGERZ campaign. J Geophys Res. 2014 Apr;119(8):4750–4769. [Google Scholar]
- 70.Platnick S. Vertical photon transport in cloud remote sensing problems. J Geophys Res. 2000 Sep;105(D18):22919–22935. [Google Scholar]
- 71.Platnick S, et al. MODIS Cloud Optical Properties: User Guide for the Collection 6 Level-2 MOD06/MYD06 Product and Associated Level-3 Datasets. 2015 Oct;:141. [Online]. Available: modis-atmos.gsfc.nasa.gov/_docs/C6MOD06OPUserGuide.pdf.


