Population-based cancer registry data in Japan for 2009–2011 revealed predominant cancers to change dramatically from childhood to young adulthood.
Keywords: epidemiological monitoring, neoplasms, pediatrics, population-based cancer registry
Abstract
Little is known about cancer incidence among children and youths in Japan. We aimed to describe cancer incidence in Japan focusing on childhood, adolescence and young adulthood (AYA). Cancer incidence data were obtained from the Monitoring of Cancer Incidence in Japan project. For the 2009–2011 incidence, the data were collected from 40 prefectures, of which data from 27 prefectures meeting quality standards were analyzed (population coverage: 38.6%). Cancers diagnosed in 0–39 years of age were classified according to the International Classification of Childhood Cancer (version 3). Crude incidence rates of cancer (including benign or behavior-unknown brain tumors) were 122.7, 142.2, 310.7, and 910.6 for the 0–14, 15–19, 20–29, and 30–39 age groups, respectively (per million population). Using the sex- and age-specific incidence rates, the national estimates of cancer incidence were 2055 for 0–14 years (1118 males and 937 females), 864 for 15–19 years (450 males and 414 females), 4246 for 20–29 years (1699 males and 2547 females), and 16 295 for 30–39 years of age (5101 males and 11 194 females). The five leading cancers were leukemia, cancer of the central nervous system (CNS), lymphoma, malignant germ cell and other gonadal tumors, and neuroblastoma in childhood cases (0–14 years old); leukemia, malignant germ cell and other gonadal tumors, lymphoma, CNS, and malignant bone tumors in adolescence (15–19 years old). The leading cancer in 20–29 years of age was malignant germ cell other gonadal tumors (mainly testis and ovary), whereas female breast cancer was most frequent in 30–39 years of age. These results provide an overall picture of childhood and AYA cancer in Japan.
Introduction
There is a lack of statistical information on childhood cancer in Japan. This information has not been updated for almost 10 years, with the incidence according to the International Classification of Childhood Cancer (ICCC) having last been reported in 2007 (1). In recent years, adolescent and young adult (AYA) cancer has been receiving increased attention. However, little is known about how cancer incidence patterns shift with age in Japan, since annual reports prepared by the Monitoring of Cancer Incidence in Japan (MCIJ) project deal only with the incidences by anatomical site (2). There has been improvement in the quality of the population-based cancer registry in Japan over the past 10 years (3), and more population-based data have thus become available. The objective of this study was to describe the incidence of childhood and AYA cancer in Japan.
Methods
Cancer incidence data in 2009–2011 were obtained from the MCIJ project 2011 (among the 47 prefectures, the data were collected from 40 prefectures; excluded were Miyagi, Saitama, Tokyo, Shizuoka, Osaka, Fukuoka and Miyazaki; only 2010–2011 data were used for Nagano and Kyoto; only 2011 data were used for Kochi, Saga and Oita). Cases were restricted to children (0–14 years) and AYAs (15–39 years). Age was stratified by 5 years (1 year for embryonal cancers), and categorized into 0–14, 0–19, 15–29 years in accordance with previous studies (4–7). The category of 15–39 years was added to describe the overall transition to cancer in adulthood. We checked the data quality using the inclusion criteria (Group A) in ‘Cancer Incidence in Five Continents Volume IX’ (death certificate only <10%, ill-defined site <10%, morphologically verified cases >80%, and unknown basis of diagnosis <10%) (8). We also confirmed that the data from 33 prefectural cancer registries meeting the above criteria showed reasonable ranges in the indicators specific to childhood cancer (e.g., proportion of cases aged 0 year, age-standardized rate (ASR) of 0–14 years) (4). Additionally, the data from six prefectures (Hokkaido, Chiba, Mie, Hyogo, Yamaguchi and Kagawa) were excluded because reports from major hospitals were lacking. The data from the following 27 prefectures were used for analysis: Aomori, Akita, Yamagata, Fukushima, Ibaraki, Tochigi, Gunma, Niigata, Ishikawa, Fukui, Yamanashi, Nagano, Gifu, Aichi, Shiga, Kyoto, Wakayama, Shimane, Okayama, Hiroshima, Tokushima, Ehime, Kochi, Saga, Nagasaki, Kumamoto and Oita. The population coverage based on the data in 2011 was 38.6% for the group 0–14 years of age and 36.8% for the group 0–39 years of age. The population data by 5-year age group, for each prefecture (by Ministry of Internal Affairs and Communications), were downloaded from the website of the National Cancer Center (9). The population data for children 0–9 years of age by 1-year age group were obtained from the statistical data for the cancer registry prepared by the National Cancer Center (10). Cancers were classified according to the ICCC version 3, listed by the US National Cancer Institute, Surveillance, Epidemiology, and End Results. (2008 updated version) (11). Basically, the cancer incidence was calculated only for malignant tumors (International Classification of Diseases for Oncology (ICD-O) version 3, behavior code = 3), while central nervous system (CNS) tumor incidence was also calculated as the sum of malignant, benign (behavior code = 0), and behavior-unknown (behavior code = 1) brain tumors except for the data from Nagasaki (only malignant tumors were counted). Although Nagasaki prefecture has a very high-quality cancer registry, which has been selected in many international reports such as the International Incidence of Childhood Cancer (IICC) (4), including this prefecture leads to an underestimation of the total rate of malignant and benign/behavior-unknown tumors. The population of Nagasaki accounted for 3% of the total population of our analysis (0–14 years old). If we assume that the ratio between the numbers of malignant and benign/behavior-unknown tumors is equal between Nagasaki and other prefectures, 1% of brain tumors including benign/behavior-unknown cases would be missing. We considered that this underestimation is acceptable. The age range at diagnosis was defined as 0–39 years. As for ‘other malignant epithelial neoplasms’ in the 20 years or older age group (diagnosis group XI), the incidences of thyroid, skin (including malignant melanoma), colon/rectum, lung, breast (female) and cervix uteri cancers were also examined. For germ cell and other gonadal tumors (diagnosis group X), malignant intracranial/intraspinal, ovarian/testicular germ cell tumors and ovarian carcinoma were separately analyzed. The national estimate of incidences of childhood and AYA cancer in Japan were calculated by multiplying the incidence rates observed in the present study by the Japanese population data by sex and 5-year-age group in 2011.
Results
The quality indexes of the data employed in the present study were as follows. For the 0–14 year-old group, the proportions of death certificate only (DCO), death certificate notification (DCN), morphologically verified case (MV), and unknown topology were 2.4%, 4.4%, 89.7% and 1.2%, respectively; for the 0–39 year-old group, the corresponding proportions were 2.0%, 3.5%, 94.1% and 0.9%.
Table 1 shows the incidences of childhood and AYA cancer. The incidence rate (for both sexes, per million population) was 112.8, 124.4, 284.4 and 872.6 for the 0–14, 15–19, 20–29 and 30–39 age groups, respectively (only malignant cases). Using the age-specific incidence obtained in this study, the national incidence of cancer (in 2011) was estimated to be 1891 in the 0–14 year-old group (1032 males and 859 females), 756 in the 15–19 year-old group (407 males and 349 females), 3885 in the 20–29 year-old group (1589 males and 2296 females), and 15 617 in the 30–39 year-old group (4872 males and 10 745 females) (Table 2). When the cases with benign or behavior-unknown brain tumors were included, the incidence rate (for both sexes, per million population) was 122.7, 142.2, 310.7 and 910.6 for the 0–14, 15–19, 20–29 and 30–39 age groups, respectively (Table 1). The national incidence of cancer (including benign and behavior-unknown brain tumors) was estimated to be 2055 in the 0–14 year-old group (1118 males and 937 females), 864 in the 15–19 year-old group (450 males and 414 females), 4246 in the 20–29 year-old group (1699 males and 2547 females) and 16295 in the 30–39 year-old group (5101 males and 11194 females) (Table 2).
Table 1.
Cancer incidence rate of childhood, adolescent, and young adult cancer in Japan (2009–2011)a
| Malignant tumors only | Including benign and behavior-unknown brain tumors | |||||
|---|---|---|---|---|---|---|
| Male | Female | Male and female | Male | Female | Male and female | |
| Number of incidence | ||||||
| 0–14 years | 1118 | 929 | 2047 | 1212 | 1014 | 2226 |
| 15–19 years | 437 | 375 | 812 | 483 | 445 | 928 |
| 20–29 years | 1622 | 2313 | 3935 | 1734 | 2566 | 4300 |
| 30–39 years | 4918 | 10 768 | 15 686 | 5149 | 11 219 | 16 368 |
| Crude rate | ||||||
| 0–14 years | 120.2 | 105.1 | 112.8 | 130.3 | 114.7 | 122.7 |
| 15–19 years | 130.5 | 118.1 | 124.4 | 144.2 | 140.1 | 142.2 |
| 20–29 years | 229.0 | 342.4 | 284.4 | 244.8 | 379.9 | 310.7 |
| 30–39 years | 537.3 | 1220.4 | 872.6 | 562.6 | 1271.5 | 910.6 |
| Age-standardize rate (Japanese) | ||||||
| 0–14 years | 121.1 | 106.0 | 113.7 | 131.2 | 115.5 | 123.5 |
| 0–19 years | 123.5 | 109.1 | 116.5 | 134.5 | 121.8 | 128.3 |
| 15–29 years | 196.0 | 266.1 | 230.2 | 211.0 | 298.5 | 253.7 |
| 15–39 years | 333.0 | 649.5 | 488.3 | 352.2 | 689.4 | 517.7 |
| Age-standardize rate (World; Segi) | ||||||
| 0–14 years | 124.7 | 109.4 | 117.2 | 134.6 | 118.6 | 126.8 |
| 0–19 years | 126.0 | 111.3 | 118.9 | 136.8 | 123.4 | 130.3 |
| 15–29 years | 192.6 | 258.2 | 224.6 | 207.6 | 290.1 | 247.9 |
| 15–39 years | 301.6 | 562.8 | 429.7 | 319.9 | 600.8 | 457.7 |
| Age-standardize rate (World; WHO) | ||||||
| 0–14 years | 121.8 | 106.7 | 114.4 | 131.8 | 116.1 | 124.2 |
| 0–19 years | 123.9 | 109.4 | 116.9 | 134.9 | 122.0 | 128.6 |
| 15–29 years | 193.8 | 260.4 | 226.3 | 208.8 | 292.4 | 249.6 |
| 15–39 years | 317.9 | 608.0 | 460.3 | 336.7 | 647.0 | 488.9 |
| Age-standardize rate (US 2000)b | ||||||
| 0–14 years | 120.8 | 105.7 | 113.4 | 130.8 | 115.3 | 123.3 |
| 0–19 years | 123.2 | 108.8 | 116.2 | 134.2 | 121.5 | 128.0 |
| 15–29 years | 192.8 | 258.2 | 224.7 | 207.8 | 290.1 | 247.9 |
| 15–39 years | 339.7 | 668.0 | 500.8 | 359.0 | 708.1 | 530.3 |
| Population | ||||||
| 0–14 years | 9 302 377 | 8 841 196 | 18 143 573 | |||
| 15–19 years | 3 349 104 | 3 176 558 | 6 525 662 | |||
| 20–29 years | 7 083 592 | 6 754509 | 13 838 101 | |||
| 30–39 years | 9 152 384 | 8 823 471 | 17 975 855 | |||
aData from 27 prefectures: Aomori, Akita, Yamagata, Fukushima, Ibaraki, Tochigi, Gunma, Niigata, Ishikawa, Fukui, Yamanashi, Nagano, Gifu, Aichi, Shiga, Kyoto, Wakayama, Shimane, Okayama, Hiroshima, Tokushima, Ehime, Kochi, Saga, Nagasaki (malignant tumors only), Kumamoto, Oita.
bAge groups of 0 year old and 1–4 years old were summed.
Table 2.
National estimates of number of cancer incidence among childhood, adolescent, and young adult cancer in Japan (2009–2011)a
| Malignant tumor only | Including benign and borderline brain tumors | |||||
|---|---|---|---|---|---|---|
| Male | Female | Male and female | Male | Female | Male and female | |
| 0–14 years | 1032 | 859 | 1891 | 1118 | 937 | 2055 |
| 15–19 years | 407 | 349 | 756 | 450 | 414 | 864 |
| 20–29 years | 1589 | 2296 | 3885 | 1699 | 2547 | 4246 |
| 30–39 years | 4872 | 10 745 | 15 617 | 5101 | 11 194 | 16 295 |
| 0–4 years | 445 | 370 | 815 | 469 | 385 | 854 |
| 5–9 years | 268 | 240 | 508 | 294 | 272 | 566 |
| 10–14 years | 319 | 249 | 568 | 355 | 280 | 635 |
| 15–19 years | 407 | 349 | 756 | 450 | 414 | 864 |
| 20–24 years | 637 | 684 | 1321 | 682 | 795 | 1477 |
| 25–29 years | 952 | 1612 | 2564 | 1017 | 1752 | 2769 |
| 30–34 years | 1685 | 3573 | 5258 | 1782 | 3755 | 5537 |
| 35–39 years | 3187 | 7172 | 10 359 | 3319 | 7439 | 10 758 |
| Total | 7900 | 14 249 | 22 149 | 8368 | 15 092 | 23 460 |
aData from 27 prefectures: Aomori, Akita, Yamagata, Fukushima, Ibaraki, Tochigi, Gunma, Niigata, Ishikawa, Fukui, Yamanashi, Nagano, Gifu, Aichi, Shiga, Kyoto, Wakayama, Shimane, Okayama, Hiroshima, Tokushima, Ehime, Kochi, Saga, Nagasaki (malignant tumors only), Kumamoto, Oita.
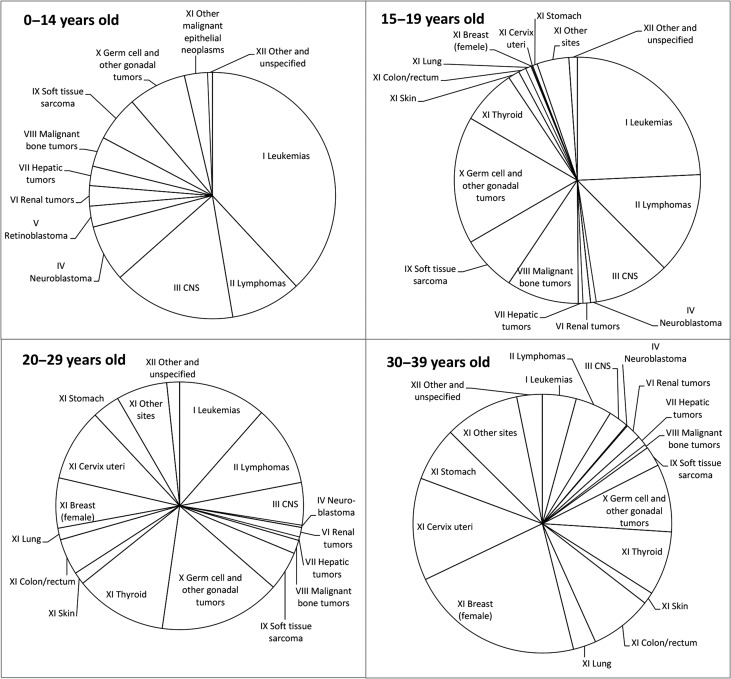
Figure 1 shows the distribution of cancer (only malignant cases) by age group. For the 0–14 year-old group, the most frequent cancer was leukemia (38.1%), followed by cancer of the CNS (16.1%), lymphoma (9.2%), malignant germ cell and other gonadal tumors (7.6%) and neuroblastoma (7.4%). For the 15–19 year-old group, the most frequent cancer was leukemia (24.3%), followed by malignant germ cell and other gonadal tumors (16.7%), lymphoma (13.3%), cancer of the CNS (10.0%) and malignant bone tumors (9.5%); among the other malignant epithelial tumors, thyroid cancer was most frequent (7.3%). For the 20–29 year-old group, the most frequent cancer was germ cell and other gonadal tumors (15.9%), followed by thyroid cancer (12.0%), leukemia (11.5%), lymphoma (10.5%) and cervix uteri cancer (9.4%). For the 30–39 year-old group, the most frequent cancer was female breast cancer (21.8%), followed by cervix uteri cancer (12.8%), malignant germ cell and other gonadal tumors (8.5%), thyroid cancer (8.0%), and colorectal cancer (7.8%). The data according to sex are shown in the Supplementary Figure. There were no major sex differences up to the age of 19. The proportion of malignant epithelial tumors including breast, thyroid and cervix uteri cancers increased substantially in females after the age of 20.
Figure 1.
Distribution of cancer incidence among childhood, adolescent and young adult cancer in Japan (2009–2011). Data from 27 prefectures (Aomori, Akita, Yamagata, Fukushima, Ibaraki, Tochigi, Gunma, Niigata, Ishikawa, Fukui, Yamanashi, Nagano, Gifu, Aichi, Shiga, Kyoto, Wakayama, Shimane, Okayama, Hiroshima, Tokushima, Ehime, Kochi, Saga, Nagasaki, Kumamoto, Oita); malignant tumors only.
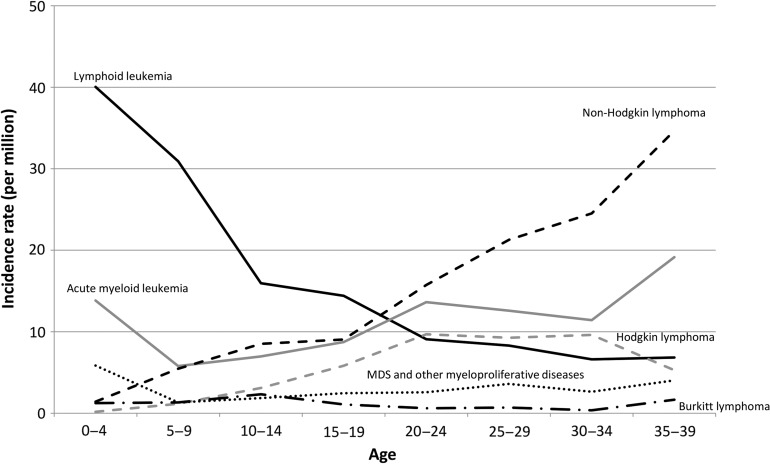
Figure 2 shows the incidence rates of hematological cancer by age group. The incidence rate of lymphoid leukemia was highest among childhood hematological cancers, and decreased with age. The incidence rate of acute myeloid leukemia was high in the 0–4 year-old group, decreased slightly in the group 5–9 years of age, and then increased with age thereafter. The incidence rate of Hodgkin lymphoma was high in the 20s and early 30s. The incidence rate of non-Hodgkin lymphoma (NHL) increased with age, and was highest among hematological cancers in the 30s. The incidence rates of Burkitt lymphoma and myelodysplastic syndrome were relatively low and did not vary with age.
Figure 2.
Age-specific incidence rates of malignant leukemia and lymphoma. MDS, myelodysplastic syndrome.
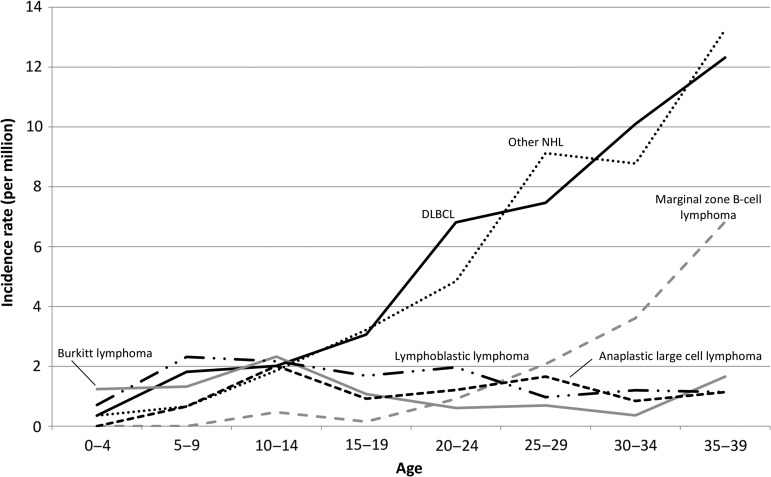
Figure 3 shows the incidence rates of NHL by histological type. The incidence rate of diffuse large-B-cell lymphoma increased with age, and was highest among NHL in the 20s and 30s. The incidence rate of marginal zone B-cell lymphoma also increased with age. Lymphoblastic lymphoma occurred frequently in the 10s, at an incidence rate similar to that of anaplastic large cell lymphoma. Lymphomas, in particular Burkitt lymphoma, were more common in males than in females (Supplementary Table 1).
Figure 3.
Age-specific incidence rates of malignant non-Hodgkin lymphoma. DLBCL, diffuse large B-cell lymphoma; NHL, non-Hodgkin lymphoma. Other NHL includes ‘malignant non-Hodgkin lymphoma, Not Otherwise Specified’ (ICD-O-3 morphological code: 9591).
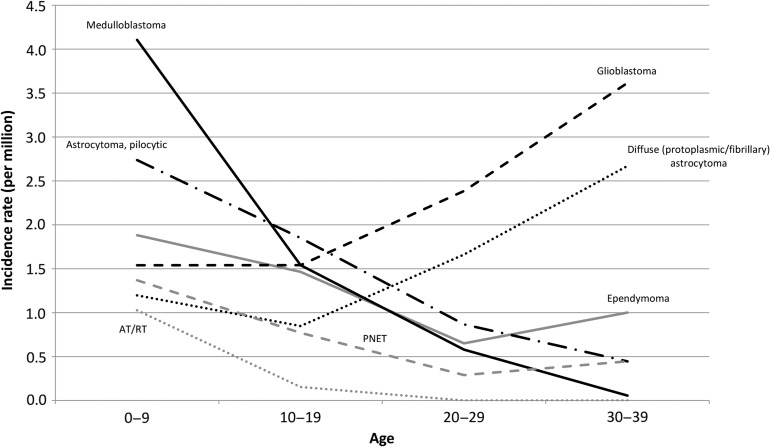
Figure 4 shows the CNS tumor incidence rates by histological type (including benign and behavior-unknown tumors). The incidence rates of medulloblastoma, pilocytic astrocytoma, ependymoma, atypical teratoid/rhabdoid tumor (AT/RT) and primitive neuroectodermal tumor (PNET) were high in children and decreased with age, while those of glioblastoma and diffuse (protoplasmic or fibrillary) astrocytoma increased with age and were major types of brain tumors in the 20s and 30s.
Figure 4.
Age-specific incidence rates of tumors of the central nervous system (including malignant and benign/behavior-unknown cases).
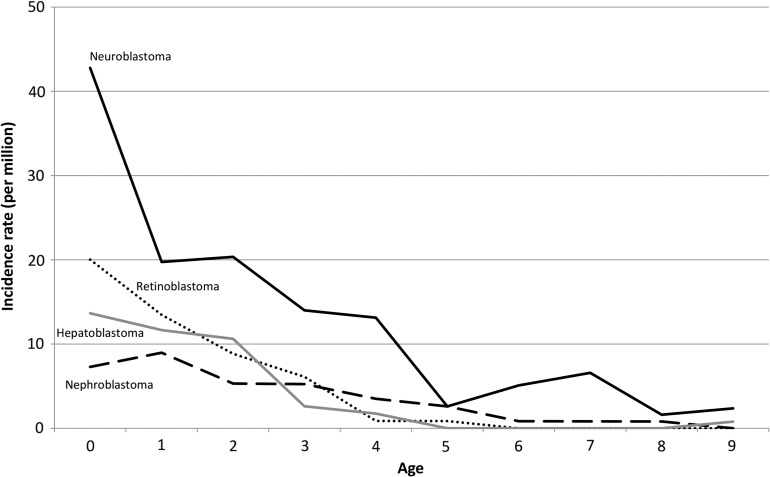
Figure 5 shows the malignant embryonal tumors (blastomas) incidence rates by age. Blastomas were typically diagnosed in the neonatal period. For infants less than 1 year of age, the most frequent type was neuroblastoma, followed by retinoblastoma, hepatoblastoma and nephroblastoma (Wilms tumor), and the incidence rates of these malignancies decreased substantially with age. Neuroblastoma, retinoblastoma and nephroblastoma were slightly more common in males than in females (Supplementary Table 2).
Figure 5.
Age-specific incidence rates of malignant embryonal tumors (blastoma). AT/RT, atypical teratoid/rhabdoid tumor; PNET, primitive neuroectodermal tumor.
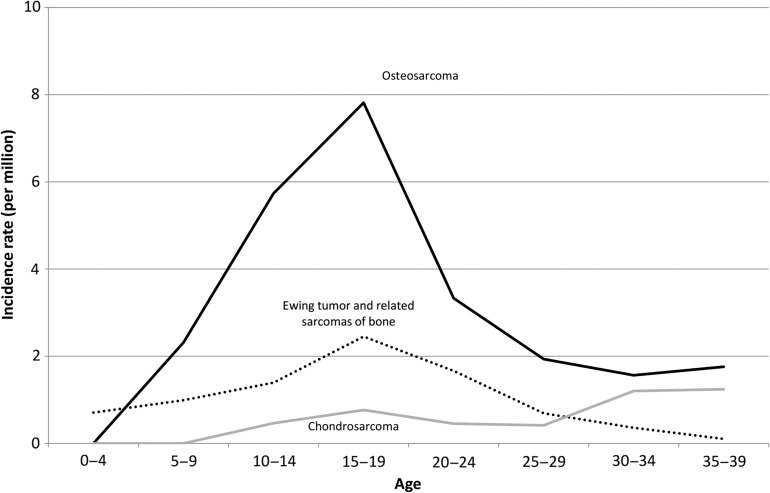
Figure 6 shows the malignant bone tumor incidence rates by age group. The osteosarcoma incidence peaked in the late 10s and decreased thereafter. The Ewing sarcoma incidence rate was not as high as that of osteosarcoma, and also peaked in the late 10s. The chondrosarcoma incidence rate increased with age, and was higher than that of Ewing sarcoma in the 30s.
Figure 6.
Age-specific incidence rates of malignant bone tumors.
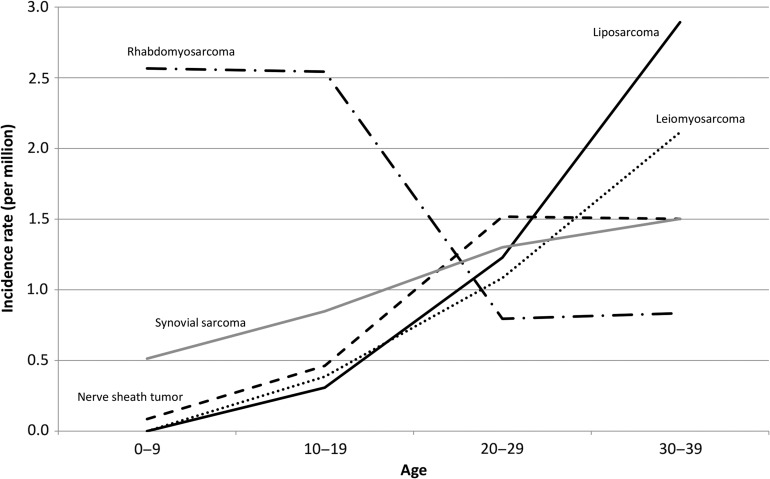
Figure 7 shows the soft tissue sarcoma incidence rates by age group. The rhabdomyosarcoma incidence rate was highest in the group less than 20 years of age, and decreased substantially thereafter. The leiomyosarcoma and liposarcoma incidence rates increased with age, and these types of cancer were major soft tissue sarcoma types in the 30s. The synovial sarcoma and malignant nerve sheath tumor incidence rates also increased with age, both being major soft tissue sarcomas in the 30s following leiomyosarcoma and liposarcoma.
Figure 7.
Age-specific incidence rates of sarcomas.
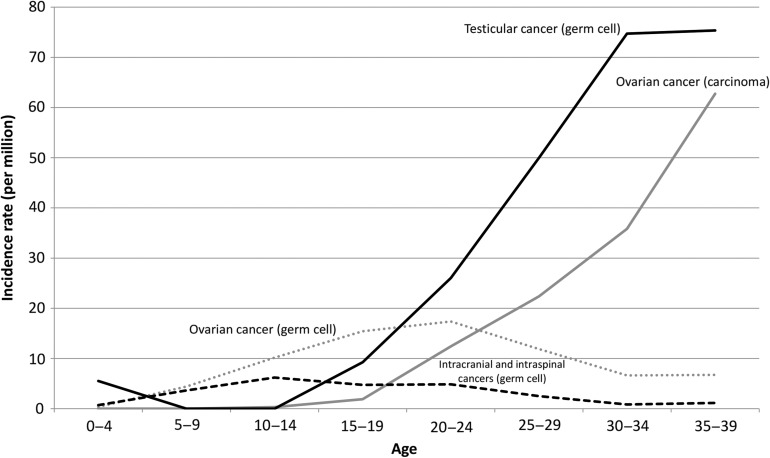
Figure 8 shows the malignant germ cell and other gonadal tumor incidence rates by age group. The incidence rate of malignant ovarian germ cell tumor rose gradually with age until 20–24 years and declined thereafter. By contrast, the incidence rate of ovarian carcinoma started to increase in 20s and continued to rise with age. The incidence rate of testicular germ cell tumor started to increase in the late 10s (later than ovarian germ cell tumor), exceeded that of ovarian germ cell tumor in the 20s and 30s. The incidence rate of malignant intracranial and intraspinal germ cell tumors was high in the 10s and early 20s.
Figure 8.
Age-specific incidence rates of malignant germ cell and other gonadal tumors.
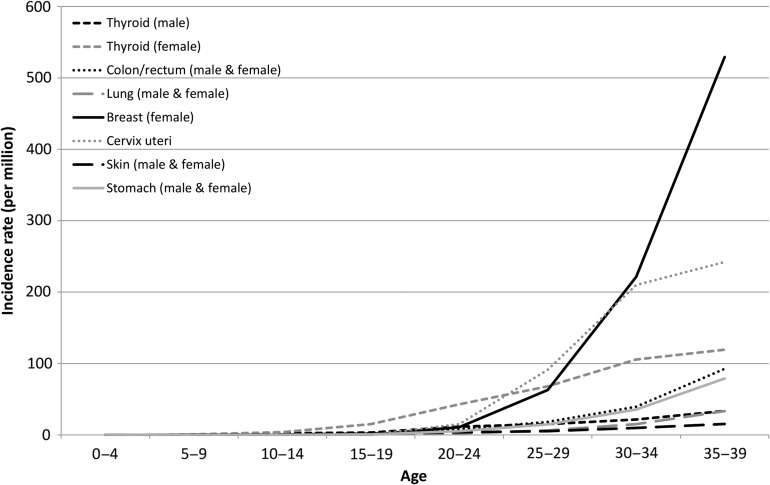
Figure 9 shows the incidence rates of malignant epithelial tumors by site and age group. The incidence rate of female thyroid cancer started to increase in the late 10s, those of female breast cancer and cervix uteri cancer began to rise from the late 20s, and that of female breast cancer became predominant in the late 30s. The stomach cancer and colorectal cancer incidence rates started to increase from the late 30s, but remained lower than those of female breast cancer, thyroid cancer and cervix uteri cancer. Thyroid cancer was less common in males than in females, and the male thyroid cancer incidence rate was similar to that of lung cancer (for both sexes).
Figure 9.
Age-specific incidence rates of other malignant epithelial tumors.
Discussion
This study revealed that ~1900 children are newly diagnosed with cancer annually in Japan (the number is almost 2000 when cases with benign and behavior-unknown brain tumors are included). In Japan, childhood cancer incidences have been reported by the Disease Registry Committee of the Japanese Society of Pediatric Hematology/Oncology (a non-population-based study of childhood cancer diagnosed in 2009–2011) (12). According to their report, the annual number of registered patients was 2065 (in 2010) (the sum of malignant hematological and solid tumors), a figure consistent with that obtained in the present investigation. The annual number of incidence of childhood cancer in Japan has been known to be 2000–2500 (13). The present study showed the annual incidence of childhood cancer to be ~‘2000’ around the year 2010. This result was consistent with the previously known figure, considering that the childhood population has been decreasing by ~1% per year since the late 1970s (the childhood population decreased from 18.472 million [in 2000] to 16.233 million [in 2014]). Assuming that the incidence rate remains the same, the number of annual incidence would be expected to decrease by ~1% per year after 2010.
The childhood and AYA cancer incidence rates in the present study were lower than those in the United States (130.8 vs. 178.0 in males and 115.3 vs. 160.1 in females in the 0–14 year-old group; 134.2 vs. 196.7 in males and 121.5 vs. 182.3 in females in the 0–19 year-old group) (benign and behavior-unknown brain tumors were included; ASR, standardized to US 2000 population) (7). The lymphoma (particularly Hodgkin lymphoma), astrocytoma, malignant renal tumor, thyroid cancer and melanoma incidence rates in the United States were more than double those in Japan. On the other hand, the incidence rate of malignant ovarian germ cell tumor was almost two times higher in Japan than in the United States. When compared with the data for Asian/Pacific islanders in the United States, the overall incidence rate of childhood and AYA cancer was slightly lower in Japanese than in Asian/Pacific islanders in the United States (123.3 vs. 131.9 for both sexes in the 0–14 year-old group [standardized to US 2000 population] and 128.0 vs. 140.8 in both sexes in the 0–19 year-old group). In particular, the incidence rates of Hodgkin lymphoma and thyroid cancer in Japanese were approximately half of those in Asian/Pacific islanders in the United States. The incidence rates of childhood cancer observed in the present study were similar to those reported in Britain (14), Germany (15) and Republic of Korea (16) (126.8 vs. 142, 138.5 and 134.9, respectively, for both sexes in the 0–14 year-old group) and slightly higher than those reported in Shanghai (134.6 vs. 105.1 in males and 118.6 vs. 115.1 in females) (including benign and behavior-unknown brain tumors, ASR standardized to Segi’s world population). Compared with Korean data on AYA cancer, the incidence rates of cancer were slightly higher in Japan than in Korea when excluding those of thyroid cancer (222.9 vs. 192.2 for both sexes in the 15–29 year-old group) (including benign and behavior-unknown brain tumors, ASR standardized to Segi’s world population). Looking at the figures by diagnosis category, the leukemia (particularly lymphoid leukemia) and CNS tumor incidence rates were two or three times higher in Japan than in Korea. On the other hand, the thyroid cancer incidence rate was three or four times higher in Korea than in Japan.
The quality of the population-based cancer registry used in the present study was high and fulfilled the international standards. One limitation of this study is that the population coverage rate was only ~40% and did not include Tokyo and neighboring prefectures (Chiba, Saitama and Kanagawa), Osaka and Fukuoka, where several large pediatric hospitals are located. There is a possibility that the true incidence rate may be higher than the figures obtained in the present study.
When the distribution of diagnostic categories in this study was compared with that reported by the Disease Registry Committee of the Japanese Society of Pediatric Hematology/Oncology (data from patients diagnosed in 2009–2011), there were no major differences in hematological malignancies (54% vs. 55% for acute lymphocytic leukemia; 17% vs. 20% for acute myeloid leukemia, 13% vs. 13% for NHL; in the 0–14 year-old group). For solid tumors, the CNS tumor incidence rate was slightly higher in the present study than those reported by the Disease Registry Committee (41% vs. 30% for CNS tumor; 12% vs. 16% for neuroblastoma; 13% vs. 14% for germ cell tumor; 10% vs. 10% for soft tissue sarcoma; in the 0–14 year-old group, including benign and behavior-unknown brain tumors for the present study). Statistical reports of childhood cancer based on the hospital-based cancer registry at the Designated Cancer Care Hospitals are available (17). The distribution of diagnostic categories in the present study were similar to those derived from their report in 2011 (35% vs. 31% for leukemia; 8% vs. 7% for lymphoma; 23% vs. 24% for CNS tumor; 7% vs. 7% for neuroblastoma; 4% vs. 5% for bone tumor; 5% vs. 6% for soft tissue sarcoma; 7% vs. 7% for germ cell tumor in the 0–14 year-old group; CNS tumors included benign and behavior-unknown brain tumors).
Ten-year survival rates for childhood and AYA cancer using population-based cancer registry data have been reported by another study group (18). According to their report, the 10-year survival rate with all cancers in the 0–14 year-old group was over 70%, but that with malignant CNS tumors was slightly lower (76.5% for leukemia, 78.6% for acute lymphocytic leukemia, 88.6% for malignant lymphoma, and 58.0% for malignant CNS tumor). In the 15–29 year-old group, the 10-year survival rate for all cancers was around 70%, while those for leukemia (particularly acute lymphocytic leukemia) were low (52.5% for leukemia, 36.9% for acute lymphocytic leukemia, 73.4% for malignant lymphoma and 58.9% for CNS tumor). The data are available on the website of the Center for Cancer Control and Information Services of the National Cancer Center (9).
The mortality rates for childhood and AYA cancer were calculated based on vital statistics using ICD-10 code the causes of death. For the 0–14 year-old group, the mortality rates for malignant CNS tumor and leukemia were relatively high (the crude mortality rates per million in 2014 were 5.5 for malignant CNS tumor and 6.0 for leukemia). In the 15–29 year-old group, the most frequent cause of cancer death was malignant CNS tumor, followed by stomach cancer, cervix uteri cancer, and colorectal cancer (the crude mortality rates per million in 2014 were 5.5 for CNS tumor, 6.0 for leukemia, 2.9 for stomach cancer, 2.6 for cervix uteri cancer and 2.0 for colorectal cancer). In the 30s, the most frequent cause of cancer death was female breast cancer, followed by cervix uteri cancer, stomach cancer and colorectal cancer (the crude mortality rates per million in 2014 were 38.4 for female breast cancer, 21.5 for cervix uteri cancer, 17.6 for stomach cancer and 15.7 for colorectal cancer) (9). No data are available regarding the mortality rates associated with each ICCC diagnosis category in childhood and AYA cancer.
In conclusion, this study provides an overall picture of childhood and AYA cancer in Japan. This type of study should be updated periodically for evaluating the trends in childhood and AYA cancer. Further studies and surveillance are needed to provide comprehensive statistics of childhood and AYA cancer including mortality survival, and genetic backgrounds.
Supplementary Material
Supplementary data
Supplementary data are available at Japanese Journal of Clinical Oncology online.
Funding
This work was supported by a Grant-in-aid for the Cancer Control Policy from the Ministry of Health, Labour and Welfare, Japan (H26-Ganseisaku-Ippan-013), and a Grant-in-aid for the Practical Research for Innovative Cancer Control from the Japan Agency for Medical Research and Development (15ck0106168h0001). The funders had no role in the design and conduct of the study; collection, management, analysis and interpretation of the data; and preparation, review or approval of the manuscript.
Conflict of interest statement
The authors have no conflict of interests to declare.
References
- 1. Marugame T, Katanoda K, Matsuda T, et al. . The Japan cancer surveillance report: incidence of childhood, bone, penis and testis cancers. Jpn J Clin Oncol 2007;37:319–23. [DOI] [PubMed] [Google Scholar]
- 2. Hori M, Matsuda T, Shibata A, et al. . Cancer incidence and incidence rates in Japan in 2009: a study of 32 population-based cancer registries for the Monitoring of Cancer Incidence in Japan (MCIJ) project. Jpn J Clin Oncol 2015;45:884–91. [DOI] [PubMed] [Google Scholar]
- 3.Sobue T. Report of the 10-year followup survey on the standardization and quality improvement of population-based cancre registry. Grants-in-aid for the Third-Term Comprehensive Ten-Year Strategy for Cancer Control from the Ministry of Health, Labour, and Welfare, Japan, 2014. (in Japanese).
- 4.International Incidence of Childhood Cancer, Volume III (electric version): International Agency for Research on Cancer. http://iicc.iarc.fr/index.php (30 March 2017, date last accessed).
- 5. Moon EK, Park HJ, Oh CM, et al. . Cancer incidence and survival among adolescents and young adults in Korea. PLoS One 2014;9:e96088. [DOI] [PMC free article] [PubMed] [Google Scholar]
- 6. Siegel DA, King J, Tai E, Buchanan N, Ajani UA, Li J. Cancer incidence rates and trends among children and adolescents in the United States, 2001–2009. Pediatrics 2014;134:e945–55. [DOI] [PMC free article] [PubMed] [Google Scholar]
- 7. Ward E, DeSantis C, Robbins A, Kohler B, Jemal A. Childhood and adolescent cancer statistics, 2014. CA Cancer J Clin 2014;64:83–103. [DOI] [PubMed] [Google Scholar]
- 8.Curado MP, Edwards B, Shin HR, et al. editors. Cancer Incidence in Five Continents Volume IX. Lyon, France: International Agency for Research on Cancer (WHO), 2008. [Google Scholar]
- 9.Table Download: Center for Cancer Registries, Center for Cancer Control and Information Services, National Cancer Center, Japan. http://ganjoho.jp/reg_stat/statistics/dl/index.html (7 November 2016, date last accessed). (in Japanese).
- 10.Population data for the cancer registry. http://ganjoho.jp/reg_stat/statistics/dl/statistics_p05.html (7 November 2016, date last accessed). (in Japanese).
- 11.ICCC Recode ICD-O-3/WHO 2008: National Cancer Institute Surveillance, Epidemiology, and End Results Program. https://seer.cancer.gov/iccc/iccc-who2008.html (13 March 2017, date last accessed).
- 12. Resutls of the Monitoring Survey by The Japanese Society of Pediatric Hematology/Oncology in 2012 (cases diagnosed in 2009–2011). Jpn J Pediatr Hematol Oncol 2013;50:462–78. (in Japanese). [Google Scholar]
- 13.Knowing about childhood cancer: Childhood Cancer Information Service, National Cancer Center, Japan. http://ganjoho.jp/child/dia_tre/about_childhood/about_childhood.html (29 August 2016, date last accessed). (in Japanese).
- 14. Stiller C, editor. Childhood Cancer in Britain: Incidence, Survival, Mortality. New York, USA: Oxford University Press, 2007. [Google Scholar]
- 15. Kaatsch P. Epidemiology of childhood cancer. Cancer Treat Rev 2010;36:277–85. [DOI] [PubMed] [Google Scholar]
- 16. Park HJ, Moon EK, Yoon JY, et al. . Incidence and survival of childhood cancer in Korea. Cancer Res Treat 2016;48:869–82. [DOI] [PMC free article] [PubMed] [Google Scholar]
- 17.Natinal report of the hospital-based cancer registry at the Designated Cancer Care Hospitals: Cancer Information Service, National Cancer Center. http://ganjoho.jp/reg_stat/statistics/brochure/hosp_c_registry.html (5 October 2016, date last accessed). (in Japanese).
- 18. Ito Y, Miyashiro I, Ito H, et al. . Long-term survival and conditional survival of cancer patients in Japan using population-based cancer registry data. Cancer Sci 2014;105:1480–6. [DOI] [PMC free article] [PubMed] [Google Scholar]
Associated Data
This section collects any data citations, data availability statements, or supplementary materials included in this article.


