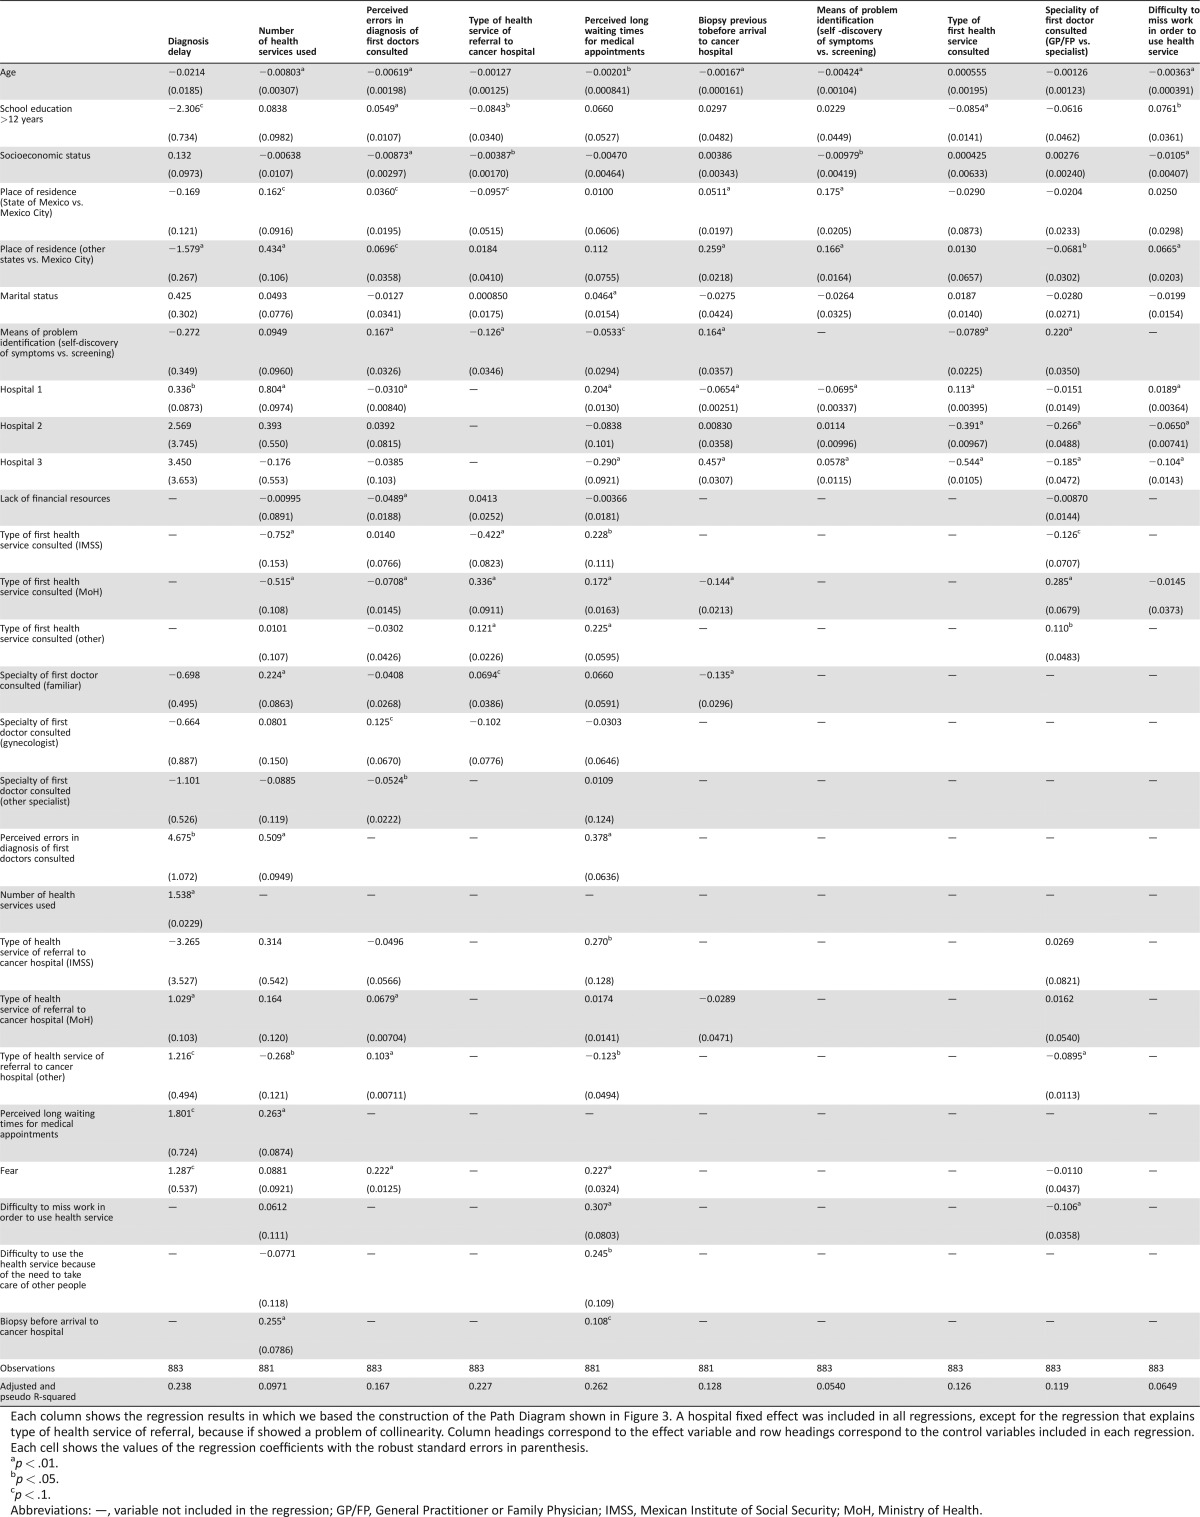
Table 3. Selected regressions for the path analysis of diagnosis delay.
Each column shows the regression results in which we based the construction of the Path Diagram shown in Figure 3. A hospital fixed effect was included in all regressions, except for the regression that explains type of health service of referral, because if showed a problem of collinearity. Column headings correspond to the effect variable and row headings correspond to the control variables included in each regression. Each cell shows the values of the regression coefficients with the robust standard errors in parenthesis.
p < .01.
p < .05.
p < .1.
Abbreviations: —, variable not included in the regression; GP/FP, General Practitioner or Family Physician; IMSS, Mexican Institute of Social Security; MoH, Ministry of Health.

