This article evaluates the prognostic impact of histological differentiation within the WHO 2010 grading classifications and explores additional Ki‐67 cut‐off values for gastroenteropancreatic neuroendocrine neoplasms.
Keywords: Gastroenteropancreatic, Neuroendocrine neoplasms, World Health Organization 2010, Ki‐67, Tumor differentiation, Registry, Prognosis, Heterogeneity
Abstract
Background.
Gastroenteropancreatic neuroendocrine neoplasms (GEP‐NENs) are a complex family of tumors of widely variable clinical behavior. The World Health Organization (WHO) 2010 classification provided a valuable tool to stratify neuroendocrine neoplasms (NENs) in three prognostic subgroups based on the proliferation index. However, substantial heterogeneity remains within these subgroups, and simplicity sometimes entails an ambiguous and imprecise prognostic stratification. The purpose of our study was to evaluate the prognostic impact of histological differentiation within the WHO 2010 grade (G) 1/G2/G3 categories, and explore additional Ki‐67 cutoff values in GEP‐NENs.
Subjects, Materials, and Methods.
A total of 2,813 patients from the Spanish National Tumor Registry (RGETNE) were analyzed. Cases were classified by histological differentiation as NETs (neuroendocrine tumors [well differentiated]) or NECs (neuroendocrine carcinomas [poorly differentiated]), and by Ki‐67 index as G1 (Ki‐67 <2%), G2 (Ki‐67 3%–20%), or G3 (Ki‐67 >20%). Patients were stratified into five cohorts: NET‐G1, NET‐G2, NET‐G3, NEC‐G2, and NEC‐G3.
Results.
Five‐year survival was 72%. Age, gender, tumor site, grade, differentiation, and stage were all independent prognostic factors for survival. Further subdivision of the WHO 2010 grading improved prognostic stratification, both within G2 (5‐year survival: 81% [Ki‐67 3%–5%], 72% [Ki‐67 6%–10%], 52% [Ki‐67 11%–20%]) and G3 NENs (5‐year survival: 35% [Ki‐67 21%–50%], 22% [Ki‐67 51%–100%]). Five‐year survival was significantly greater for NET‐G2 versus NEC‐G2 (75.5% vs. 58.2%) and NET‐G3 versus NEC‐G3 (43.7% vs. 25.4%).
Conclusion.
Substantial clinical heterogeneity is observed within G2 and G3 GEP‐NENs. The WHO 2010 classification can be improved by including the additive effect of histological differentiation and the proliferation index.
Implications for Practice.
Gastroenteropancreatic neuroendocrine neoplasms are tumors of widely variable clinical behavior, roughly stratified by the World Health Organization (WHO) 2010 classification into three subgroups based on proliferation index. Real‐world data from 2,813 patients of the Spanish Registry RGETNE demonstrated substantial clinical heterogeneity within grade (G) 2 and G3 neuroendocrine neoplasms. Tumor morphology and further subdivision of grading substantially improves prognostic stratification of these patients and may help individualize therapy. This combined, additive effect shall be considered in future classifications of neuroendocrine tumors and incorporated for stratification purposes in clinical trials.
Introduction
Gastroenteropancreatic neuroendocrine neoplasms (GEP‐NENs) are a heterogeneous family of tumors of increasing incidence [1]. The wide array of proposed classifications for these tumors over the last decades illustrates their complex biological nature [2], [3], [4]. The World Health Organization (WHO) 2000/2004 classification incorporated a number of major predictors of patient outcome, including tumor differentiation and size, lymphovascular invasion, proliferation index, functionality, and extent of distant spread [4]. It also acknowledged the relevance of tumor anatomical location. This classification was an important step forward in the field as it was the first to stratify patients according to prognosis. Some major drawbacks, however, included the confusing mixture of pathological and clinical features (i.e., functionality, staging), as well as the introduction of an ambiguous category of “uncertain behavior.”
To overcome some of these caveats, the WHO classification was updated in 2010 [4]. Several changes were introduced in this new classification, such as the terms “neuroendocrine,” to reflect some unique features of these tumors (i.e., the expression of neural antigens), and “neoplasm,” to encompass the whole family of neuroendocrine cancer. Neuroendocrine neoplasms (NENs) include both the previously designated “carcinoids/well‐differentiated endocrine tumors/well‐differentiated carcinomas,” now termed as neuroendocrine tumors (NETs), and the previously designated “poorly differentiated carcinomas,” now termed as neuroendocrine carcinomas (NECs). All NENs are considered potentially malignant, although the prognosis significantly varies among subgroups. Importantly, the classification of NENs as NETs or NECs was established by a proliferation‐based grading system that, according to specific Ki‐67 index and mitotic count cutoff values, subdivided NETs as grade (G) 1 (Ki‐67 index <2% and mitotic count <2/10 high‐power fields [HPF]) or G2 (Ki‐67 index 3%–20% and/or mitotic count 2–20/10 HPF), and considered all G3 (Ki‐67 index >20% and/or mitotic count >20/10 HPF) as NECs, regardless of tumor differentiation.
The WHO 2010 classification has proven to be simple, objective, and reproducible, and has definitively established the proliferation rate as a solid prognostic factor in GEP‐NENs [5], [6], [7]. However, the cutoff values employed in this classification are somewhat arbitrary, and it is operatively disconnected from important aspects of tumor morphology. Indeed, a number of reports have questioned these cutoff values [8], [9], [10] and have also suggested G3 NECs are more heterogeneous than expected [11], [12], [13], [14], [15].
In this context, the aim of our study was to evaluate the prognostic impact of histological differentiation within the WHO 2010 G1/G2/G3 categories and explore additional Ki‐67 cutoff values in GEP‐NENs. For this purpose, real‐world data from 2,813 patients registered in the Spanish National Neuroendocrine Tumor Registry (RGETNE) were analyzed. As new classifications are generally gradually implemented in standard practice, whereas old ones take some time to be dismissed, 1,535 registered patients had been classified by both WHO 2000/2004 and WHO 2010 classifications; therefore, information regarding both grade, based on the proliferative index (Ki‐67 <3%, 3%–20%, >20%), and histological differentiation (well‐differentiated tumors—NETs—or poorly differentiated carcinomas—NECs) was available for these patients.
Subjects, Materials, and Methods
Study Population and Design
The study population was obtained from the Spanish National Cancer Registry for GEP‐NENs, RGETNE (data cutoff date for analyses: April 2016), a hospital‐based tumor registry coordinated by GETNE (Grupo Español de Tumores Neuroendocrinos [its Spanish acronym]), an NEN multidisciplinary scientific society. Data are provided online through a centralized web platform (https://www.e-crd.net/rgetne/) by investigators from 58 academic and community sites representing all regions of Spain (supplemental online Appendix 1). Comprehensive information regarding patient and tumor characteristics, diagnostic and therapeutic interventions, and clinical outcomes are registered from each patient as previously described [9], [16]. To ensure homogeneity in data registration between different notifiers, a technical manual is available online that includes instructions for use and procedures, glossaries with precise definitions of relevant terms and variables, and main tumor classifications. Quality checks are automatically implemented through different software filters, and data are also systematically assessed for internal consistency by external independent reviewers (P.J‐F, A.C‐B, A.C‐P, and R.G‐C). In addition, on‐site data monitoring/audit has been performed for 51% of registered patients by a medical oncologist with particular expertise in NENs during 2015–2016 (B.N‐V). The registry protocol and informed consent (supplemental online Appendices 2, 3) have been approved by a National Scientific and Ethical Committee (translation to English of the registry protocol is provided in supplemental online Appendix 4).
The overall study population included 2,813 patients registered from 2000 through 2016. Of these, 1,535 had been classified both by the WHO 2000/2004 and WHO 2010 classifications; therefore, information regarding both grade, based on the proliferative index (Ki‐67 <3%, 3%–20%, >20%), and histological differentiation (well‐differentiated tumors—NETs—or poorly differentiated carcinomas—NECs) was available for these patients (supplemental online Figs. 1, 2). According to both parameters, patients were stratified into five cohorts: NET‐G1 (n = 609), NET‐G2 (n = 558), NET‐G3 (n = 25), NEC‐G2 (n = 18), and NEC‐G3 (n = 245).
Study Aims
The main objective was to assess the prognosis of patients with GEP‐NENs according to histological differentiation and proliferative index, and to evaluate, with real‐world data, the interaction between the WHO 2000 and 2010 classifications to explore the potential independent prognostic value of tumor differentiation within the WHO 2010 G2/G3 categories. The primary endpoint was the 5‐year survival rate. Secondary objectives were (a) to explore the effect of additional Ki‐67 cutoff values in the prognosis stratification of GEP‐NENs patients and (b) to assess other prognostic factors for survival.
Statistical Analysis
Descriptive statistics were used to characterize clinical and pathological parameters. The association of categorical variables was assessed by Pearson chi‐square tests. The Kruskal‐Wallis test was used for continuous variables. Survival was estimated by the Kaplan‐Meier product limit method, and differences observed among subgroups were assessed with the Generalized Wilcoxon test. Variables predictive of survival (p < .1) in univariable analyses were entered into the Cox proportional hazards (PH) regression model. Additional variables such as octreotide scan, mitotic count, and chromogranin, 5‐hydroxyindolacetic acid, insulin, and serotonin levels were also included in the multiple imputation model. The PH assumption was determined using Schoenfeld residuals. Multiple imputation using fully conditional specification was used in multivariate analysis to deal with missing values [17], as it can provide valid inferences assuming that missing is approximately at random. Our imputation model focused on Ki‐67 percentage and histological grade and stage and took into account multiple variables associated with the imputed data as previously mentioned. The process is iterated 10 times, resulting in 10 imputed datasets that provided the pooled estimates in the Cox PH regression. Complete case analysis was applied to analyze secondary outcomes. Harrell's bias‐corrected c‐index was used to evaluate discrimination. All statistical assessments were two‐sided and p values < .05 were deemed statistically significant. Statistical analyses were performed using IBM SPSS version 22.0 (IBM, Armonk, NY) and R software, version 3.3.1 (http://www.r-project.org).
Results
Patient Population
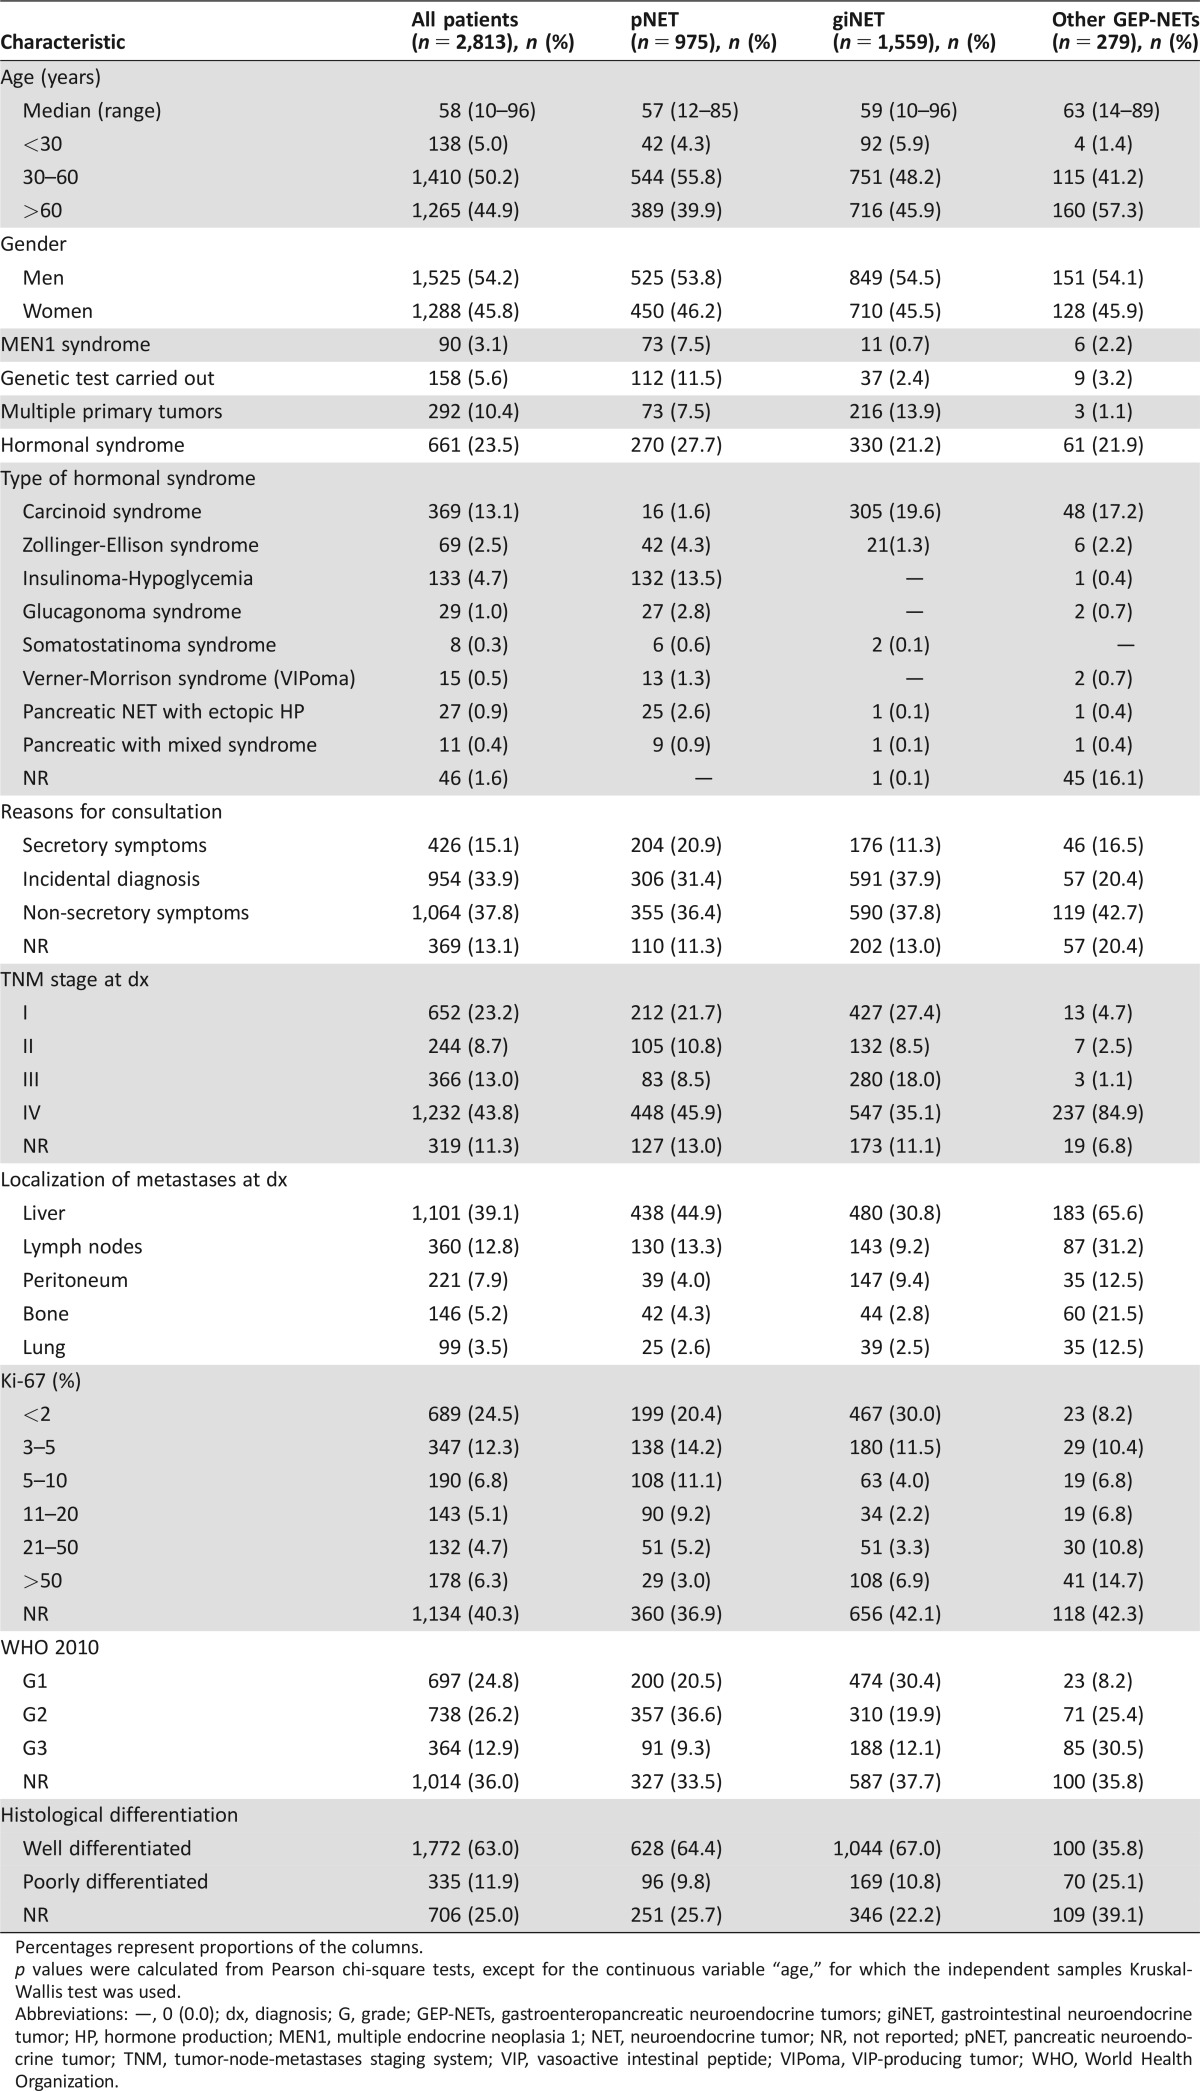
Clinical and pathologic characteristics of the study population (n = 2,813 patients) are summarized in Table 1. The most common primary tumor sites included 975 pancreas (34.6%), 518 jejunum‐ileum (18.4%), 298 stomach (10.5%), 277 appendix (9.8%), 169 rectum (6.0%), 153 colon (5.4%), and 104 duodenum (3.6%).
Table 1. Characteristics of study population.
Percentages represent proportions of the columns.
p values were calculated from Pearson chi‐square tests, except for the continuous variable “age,” for which the independent samples Kruskal‐Wallis test was used.
Abbreviations: —, 0 (0.0); dx, diagnosis; G, grade; GEP‐NETs, gastroenteropancreatic neuroendocrine tumors; giNET, gastrointestinal neuroendocrine tumor; HP, hormone production; MEN1, multiple endocrine neoplasia 1; NET, neuroendocrine tumor; NR, not reported; pNET, pancreatic neuroendocrine tumor; TNM, tumor‐node‐metastases staging system; VIP, vasoactive intestinal peptide; VIPoma, VIP‐producing tumor; WHO, World Health Organization.
Given its gradual introduction into clinical practice, the WHO 2010 classification was registered in 1,799 patients (63% of the overall population), including 697 G1 (39% of classified patients), 738 G2 (41%), and 364 G3 cases (20%). Histological differentiation as per the WHO 2000/2004 classification was documented in 2,107 patients (74% of the overall population), including 1,772 well‐differentiated tumors (84% of characterized tumors) and 335 poorly differentiated carcinomas (16%).
A significant proportion of patients had stage IV disease at diagnosis (n = 1,232, 43%), although this proportion significantly varied depending on grade and primary tumor site. Stage IV disease was documented at diagnosis in 29%, 53%, and 68% of G1, G2, and G3 NENs, respectively. The primary tumor sites that most frequently presented with stage IV disease were jejunum‐ileum (59%), esophagus (50%), colon (49%), and pancreas (46%), whereas it was exceptional in appendix primaries (3%).
Overall Survival and Prognostic Factors
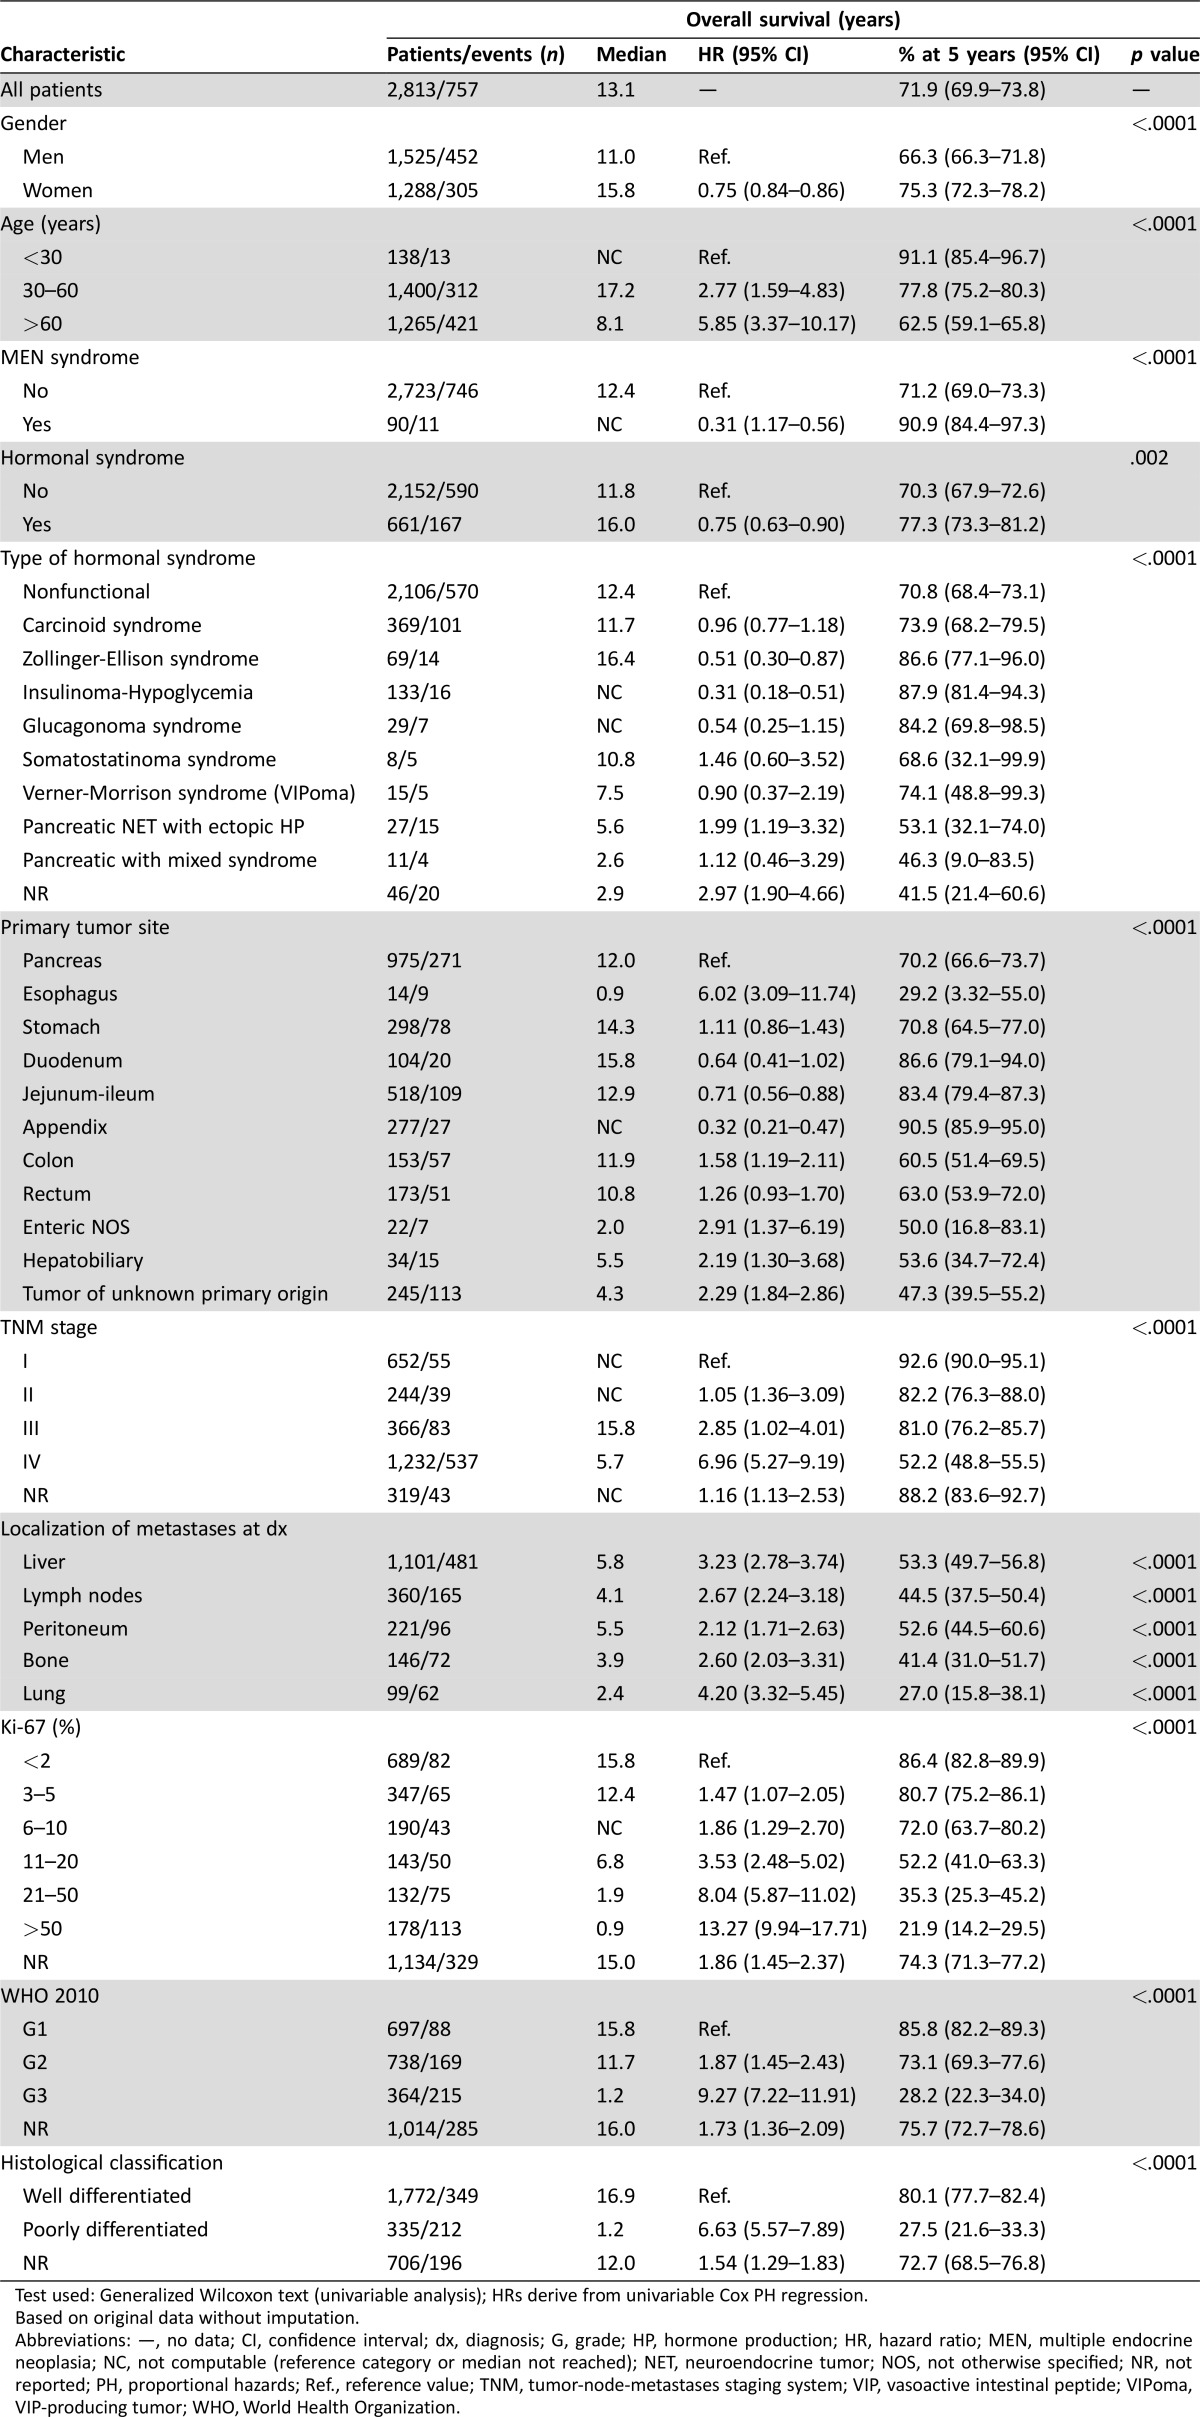
At last follow‐up, 757 patients (27%) had died. With a mean follow‐up of 4.5 years (range: 0–29), the 5‐year overall survival (OS) rate for the whole study population was 72% (95% confidence interval [CI]: 69.9–73.8). Survival was significantly greater in women, young people, multiple endocrine neoplasia (MEN) syndrome, and functional tumors (Table 2). Survival rates also significantly differed by tumor grade, histological differentiation, and TNM stage. Of note, prognosis was influenced to a greater extent by tumor grade (5‐year OS rates for G1, G2, and G3: 86%, 73%, and 28%, respectively) or tumor differentiation (5‐year OS rates for well‐ vs. poorly differentiated neoplasms: 80% vs. 28%) than by tumor stage (5‐year OS rates for stage I, II, III and IV: 93%, 82%, 81%, and 52%; Table 2). All these results were based on original data without imputation.
Table 2. Prognostic factors for overall survival (univariable analysis).
Test used: Generalized Wilcoxon text (univariable analysis); HRs derive from univariable Cox PH regression.
Based on original data without imputation.
Abbreviations: —, no data; CI, confidence interval; dx, diagnosis; G, grade; HP, hormone production; HR, hazard ratio; MEN, multiple endocrine neoplasia; NC, not computable (reference category or median not reached); NET, neuroendocrine tumor; NOS, not otherwise specified; NR, not reported; PH, proportional hazards; Ref., reference value; TNM, tumor‐node‐metastases staging system; VIP, vasoactive intestinal peptide; VIPoma, VIP‐producing tumor; WHO, World Health Organization.
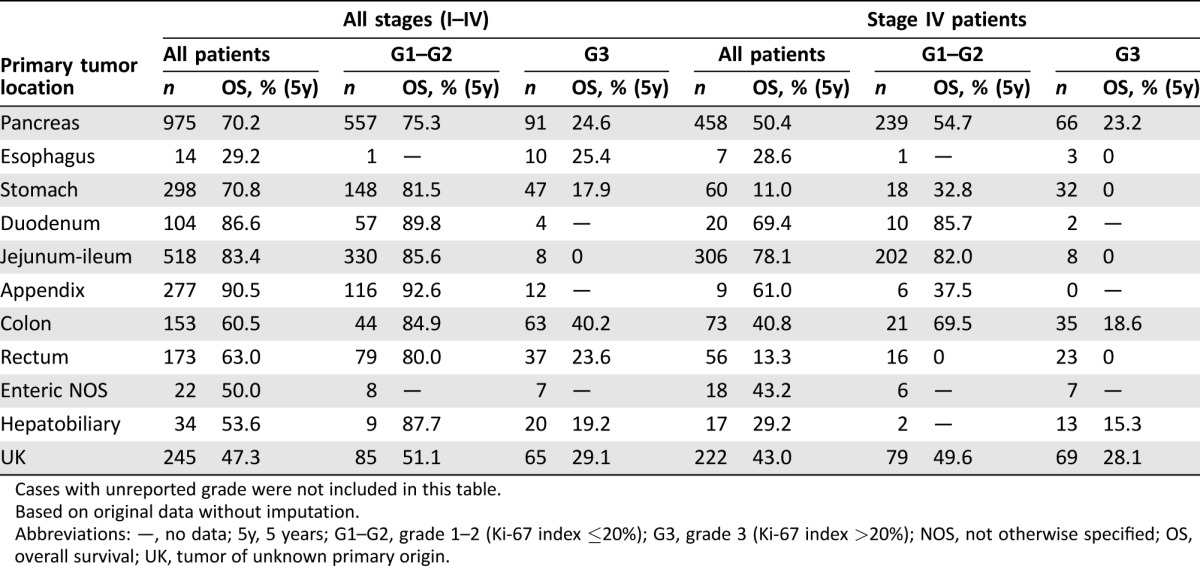
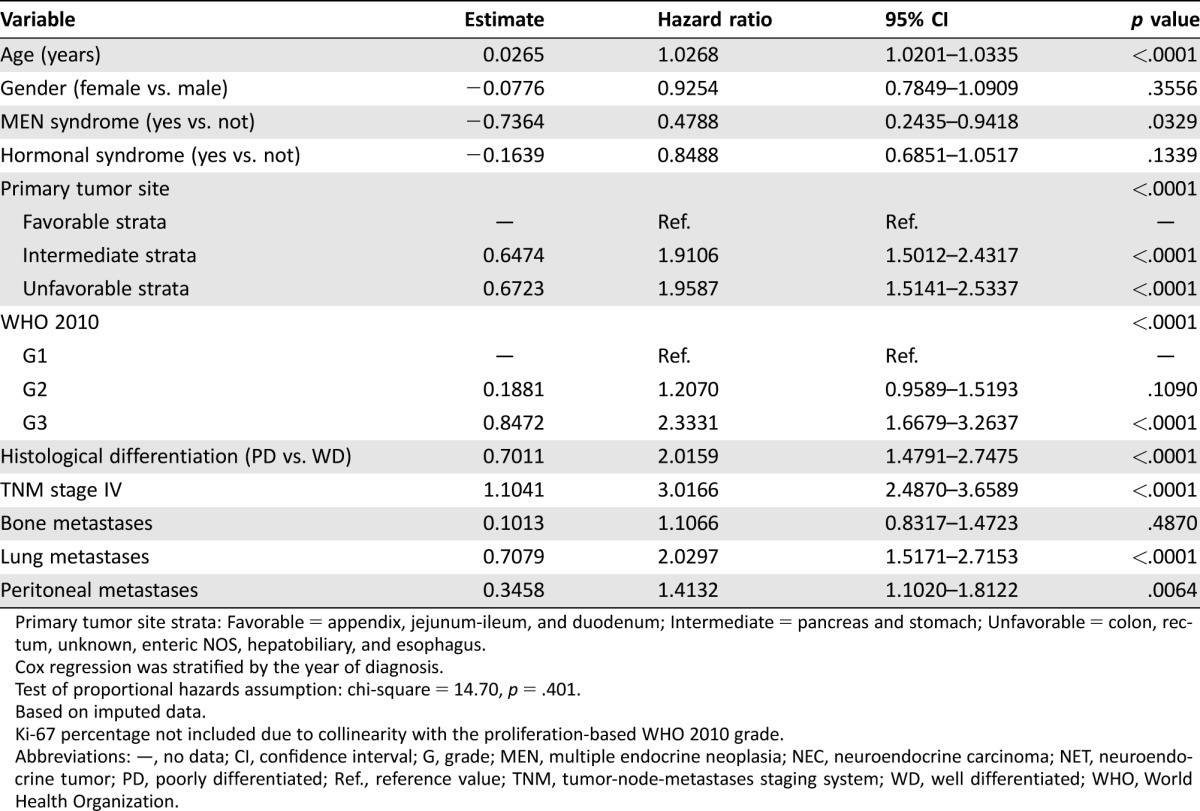
Primary tumor site was another major determinant of patient outcome. Prognosis was good for NENs of the appendix, jejunum‐ileum, or duodenum (5‐year OS: 83%–91%), intermediate for gastric or pancreatic NENs (5‐year OS: 70%–71%), and poor for colon, rectum, hepatobiliary, or esophageal NENs and for those of unknown primary (5‐year OS: 29%–63%). However, these figures are substantially influenced by grade and stage, which are not evenly distributed among different primary tumor sites (Table 3). Based on 10 imputed datasets, the Cox PH regression confirmed age, gender, MEN syndrome, primary tumor site, proliferation‐based grade (WHO 2010), tumor differentiation, TNM stage, and lung metastases as independent prognostic factors for survival (Table 4). The prediction for 5‐year OS is well calibrated (Groennesby‐Borgan score test: chi‐square = 5.924, p = .7475), and a bias‐corrected Harrell's c‐index of 0.803 (95% CI: 0.782–0.818) was observed.
Table 3. Overall survival of patients with neuroendocrine neoplasms by primary tumor site, stage, and grade.
Cases with unreported grade were not included in this table.
Based on original data without imputation.
Abbreviations: —, no data; 5y, 5 years; G1–G2, grade 1–2 (Ki‐67 index ≤20%); G3, grade 3 (Ki‐67 index >20%); NOS, not otherwise specified; OS, overall survival; UK, tumor of unknown primary origin.
Table 4. Cox proportional hazards regression model for overall survival.
Primary tumor site strata: Favorable = appendix, jejunum‐ileum, and duodenum; Intermediate = pancreas and stomach; Unfavorable = colon, rectum, unknown, enteric NOS, hepatobiliary, and esophagus.
Cox regression was stratified by the year of diagnosis.
Test of proportional hazards assumption: chi‐square = 14.70, p = .401.
Based on imputed data.
Ki‐67 percentage not included due to collinearity with the proliferation‐based WHO 2010 grade.
Abbreviations: —, no data; CI, confidence interval; G, grade; MEN, multiple endocrine neoplasia; NEC, neuroendocrine carcinoma; NET, neuroendocrine tumor; PD, poorly differentiated; Ref., reference value; TNM, tumor‐node‐metastases staging system; WD, well differentiated; WHO, World Health Organization.
Relevance of Histological Differentiation and Proliferative Index Subgrading in Prognosis Stratification
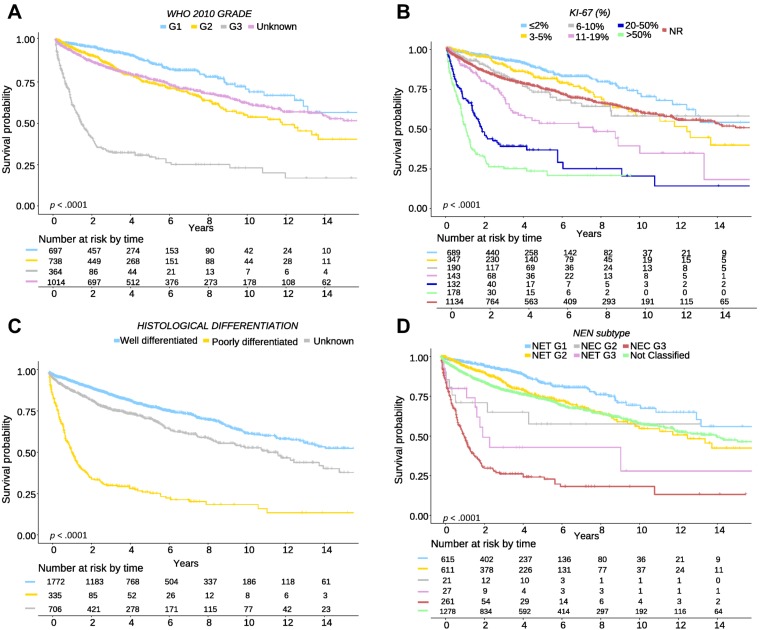
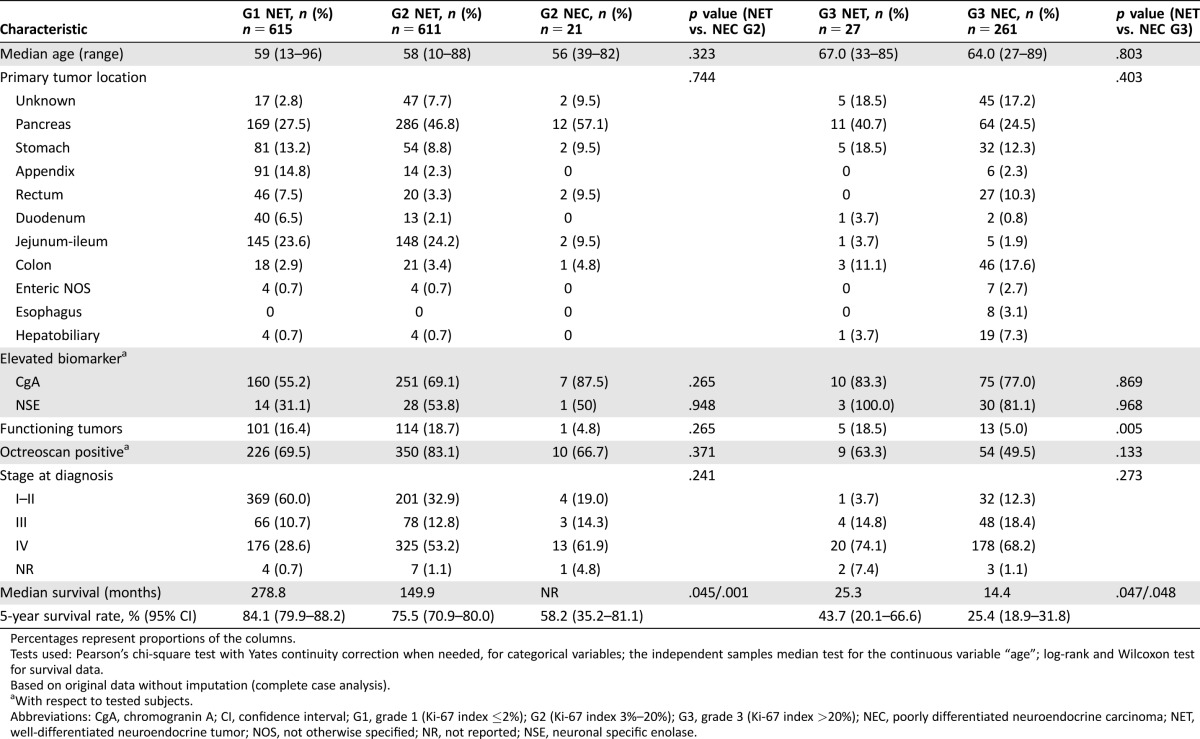
To analyze heterogeneity of G2 and G3 NENs according to WHO 2010 classification, we explored further subdivisions of these categories by Ki‐67 index (Table 1). This analysis showed a wide spectrum of clinical behavior both for G2 (5‐year OS: 81% [Ki‐67 3%–5%], 72% [Ki‐67 6%–10%], 52% [Ki‐67 11%–20%]) and G3 NENs (5‐year OS: 35% [Ki‐67 21%–50%], 22% [Ki‐67 51%–100%]; Fig. 1). To confirm the results of the Cox multivariate analysis and to assess the influence on survival of histological differentiation within the proliferation‐based grading system, we performed a sensitivity analysis only with complete cases (patients classified simultaneously with the WHO classification 2000/2004 and 2010; Table 5; Fig. 1). Of 632 G2 NENs with information on tumor differentiation, we identified 611 (96%) well‐differentiated tumors (here termed as G2 NET) and 21 (4%) poorly differentiated carcinomas (here termed as G2 NEC) that had significantly different prognosis (OS percentage at 5 years for G2 NET vs. G2 NEC: 75% vs. 58%, p = .001). Similarly, of 288 G3 NENs with information on tumor differentiation, those with well‐differentiated tumors or G3 NETs (n = 27, 9%) had a significantly better prognosis than those with poorly differentiated carcinomas or G3 NECs (n = 261, 91%; 5‐year OS: 43% vs. 25%, respectively, p = .048). In addition, a sensitivity analysis showed that the effect of histologic differentiation is consistent for both pancreatic and nonpancreatic tumors (data not shown). Main clinical and pathological characteristics of G2 NET/NEC and G3 NET/NEC patients are summarized in Table 5.
Figure 1.
Overall survival of patients with gastroenteropancreatic neuroendocrine neoplasms by tumor differentiation and proliferation rate. (A): Survival of patients by tumor grade: grade 1 (G1) or Ki‐67 ≤2%, grade 2 (G2) or Ki‐67 3%–20%, grade 3 (G3) or Ki‐67 >20%, unknown (UK) grade or Ki‐67 not done or not reported. (B): Survival of patients by Ki‐67 proliferation rate: 0%–2%, 3%–5%, 6%–10% 11%–20%, 21%–50%, >50%. (C): Survival of patients by tumor differentiation: well differentiated (NET), poorly differentiated (NEC), unknown tumor differentiation. (D): Survival of patients by tumor grade and differentiation: G1 NET, G2 NET, G2 NEC, G3 NET, G3 NEC. Abbreviations: G, grade; NEC, neuroendocrine carcinoma; NEN, neuroendocrine neoplasm; NET, neuroendocrine tumor; NR, not reported; WHO, World Health Organization.
Table 5. Characteristics of patients with G2 and G3 neuroendocrine neoplasms according to tumor differentiation (NET vs. NEC; all stages).
Percentages represent proportions of the columns.
Tests used: Pearson's chi‐square test with Yates continuity correction when needed, for categorical variables; the independent samples median test for the continuous variable “age”; log‐rank and Wilcoxon test for survival data.
Based on original data without imputation (complete case analysis).
With respect to tested subjects.
Abbreviations: CgA, chromogranin A; CI, confidence interval; G1, grade 1 (Ki‐67 index ≤2%); G2 (Ki‐67 index 3%–20%); G3, grade 3 (Ki‐67 index >20%); NEC, poorly differentiated neuroendocrine carcinoma; NET, well‐differentiated neuroendocrine tumor; NOS, not otherwise specified; NR, not reported; NSE, neuronal specific enolase.
Discussion
GEP‐NENs are a complex family of neoplasms of widely variable biological behavior [18]. Multiple factors influence outcome, many of which (e.g., proliferation rate, histological differentiation, or tumor site) are more determinant of patient survival than tumor stage [8], [9], [19]. The WHO 2000/2004 classification incorporated to a certain extent all these items. However, the high degree of ambiguity inherent to some of the proposed categories and the somewhat confusing combination of clinical and pathological features limited its widespread use. In this context, the WHO 2010 classification provided a valuable tool to stratify NEN prognosis based on an objective measure, the proliferation index, and has proven to be simple to use and reproducible. Of note, in this classification, quantitative variables (Ki‐67 index) have somewhat overridden some important classical histological features. In addition, although tumor categories are easily discernable, emerging data suggest substantial heterogeneity within categories that deserve to be further addressed.
With this purpose, in the present study, we evaluated the prognostic impact of histological differentiation within the WHO 2010 G1/G2/G3 categories, and of additional Ki‐67 cutoff values in 2,813 patients with GEP‐NENs registered in RGETNE. In our experience, further subdivision of grading improves prognostic stratification of patients, both within G2 (OS percentage at 5 years: 81% [Ki‐67 3%–5%], 72% [Ki‐67 6%–10%], 52% [Ki‐67 11%–20%]) and G3 NENs (OS percentage at 5 years: 35% [Ki‐67 21%–50%], 22% [Ki‐67 51%–100%]). Particularly remarkable is the impact in prognosis of a Ki‐67 cutoff value of 10% for G2 NENs, which identifies a subgroup with significantly worse prognosis within this category (52% 5‐year OS for patients with Ki‐67 index above this value), although these figures indicate proliferation rate likely behaves as a continuous variable. It should also be highlighted that prognosis of patients with G1 NETs was very similar to the subgroup of G2 NET patients with Ki‐67 <5%. Our data also suggest histological differentiation provides useful, additive, and independent prognostic information beyond the proliferation index in patients with GEP‐NENs. Indeed, the subgroup of patients with well‐differentiated G3 NENs (9% of all G3), the so‐called G3 NETs, had a significantly better prognosis than patients with poorly differentiated G3 NENs (G3 NECs; 5‐year OS: 42% vs. 24%, respectively, p = .025). This effect was consistent for both pancreatic and nonpancreatic tumors. Therefore, our findings are in agreement with the new WHO 2017 classification for endocrine tumors, which was published during the review of this article and includes pancreatic (but not gastrointestinal [GI]) NENs and incorporates for the first time a discrimination of G3 NET from G3 NEC [20]. Our data also suggest that this discrimination may also need to be considered for nonpancreatic NENs. Finally, we also identified a small subgroup of G2 NEN with poorly differentiated histology (3% of all G2, here termed as G2 NEC) that had a significantly worse prognosis than well‐differentiated G2 NETs (5‐year OS: 57% vs. 75%, respectively, p = .001). This is to our knowledge the largest experience reported to date analyzing the interaction of proliferation rate and tumor differentiation and the first one to report on tumor heterogeneity within the G2 NEN category.
Overall prognosis was favorable, with a 5‐year OS rate of 72%. Of note, outcome was influenced to a greater extent by tumor grade (5‐year OS rates for G1, G2, and G3: 86%, 73%, and 28%, respectively) or tumor differentiation (5‐year OS rates for well‐ vs. poorly differentiated neoplasms: 80% vs. 28%) than by tumor stage (5‐year OS rates for stage I, II, III, and IV: 93%, 82%, 81%, and 52%). Primary tumor site was another major independent determinant of patient prognosis, although survival by anatomical localization of the primary tumor observed in our series significantly differed from that reported in the Surveillance, Epidemiology, and End Results (SEER) tumor registry for the U.S. population [1], [21]. Results from RGETNE identified the appendix, jejunum‐ileum, or duodenum as the sites with the best prognosis, whereas colon, rectum, hepatobiliary, or esophageal NENs were associated with the poorest prognosis. On the contrary, rectal primaries had an excellent prognosis in the SEER registry, whereas the worst survival figures were reported for pancreatic primaries. It is remarkable that prognosis of patients with pancreatic NENs was substantially better for patients registered in RGETNE than for those of the SEER registry (5‐year OS rates of 70% vs. 30%, respectively). A number of potential factors may account for the observed differences, including confounding variables such as grade or stage (the SEER registry does not include “benign” pancreatic NETs), registration biases inherent to hospital‐based versus population registries (early‐stage gastric or rectal primaries likely underrepresented in RGETNE due to the low participation of gastroenterologists), geographic disparities in terms of racial composition (population in Spain being dominantly white), and other genetic and environmental factors, as well as health care standards and availability (access to care is universally guaranteed in the Spanish Public Health Care System).
These data, however, should be interpreted with caution, as the proportion of patients with poorly differentiated G2 NEN or well‐differentiated G3 NEN is low, the follow‐up of our series (4.5 years) was somewhat limited for the more indolent subgroups, and information of tumor differentiation and proliferation rate was only available for 55% (n = 1,535) of registered patients (grade and histological differentiation were not reported for 37% and 26% of patients, respectively). Nevertheless, results of our study are relevant, as they point out the fact that in current standard practice there are a proportion of patients whose prognostic classification is ambiguous or imprecise and illustrate with real‐world data that the prognostic stratification ability of the current WHO 2010 classification may be improved by incorporating histological differentiation and further subdivision of grading.
Other potential limitations of our study include heterogeneity of standards of care and data quality among different institutions, which is a recurring problem in many cancer registries, and the lack of centralized pathological review of critical variables such as tumor differentiation or proliferation rate. In particular, readers should be aware that morphological diagnosis of high‐grade NENs may be quite challenging even for experienced pathologists due to the lack of precisely defined criteria, particularly with limited or suboptimal samples [22]. Nevertheless, it was not the aim of this study to test currently available classifications in ideal conditions (i.e., tumors assessed in a uniform way by expert NEN pathologists), but rather to analyze how they perform in the real world. In addition, the availability of a technical manual to ensure homogeneity in data registration between different notifiers, the implementation of automatic and external quality checks, the on‐site data monitoring of about half the registered patients by a medical oncologist with particular expertise in NENs, and the rigorous statistical analysis performed have tried to minimize some of these caveats. Another relevant consideration is that our analysis does not differentiate between small‐ and large‐cell variants. This would be an interesting issue to explore, as the large‐cell subtype seems to have somewhat better prognosis than small‐cell NECs, particularly in the GI tract [23], and it is unclear whether it could also influence response to therapy. However, molecular profiling suggests both subtypes harbor common genetic alterations that differ from those encountered in well‐differentiated NETs [24], and current guidelines indicate similar clinical management for both subtypes of NECs.
Conclusion
Substantial clinical heterogeneity is observed for both G2 and G3 NENs. Analysis of this large national database (RGETNE) suggests that tumor morphology is a relevant aid to further stratify prognosis of patients with GEP‐NENs, beyond the proliferation index. In addition, the proliferation rate behaves as a continuous variable illustrating a biological continuum, and further subdivision of grading may also help to more accurately predict patient outcome. Nevertheless, as data are still limited, it is advisable that pathologists continue to report the precise mitotic count or Ki‐67 index together with grade, as well as classical histological features including cell size (large vs. small cell) and tumor differentiation. Collaborative efforts, such as the European Neuroendocrine Tumor Society Tumor Registry initiative, are also greatly encouraged in this regard in order to generate more solid evidence to definitively address these issues.
See http://www.TheOncologist.com for supplemental material available online.
Supplementary Material
Acknowledgments
We thank all participating physicians and other notifiers who generously contributed with their patients to this registry (supplemental online Appendix 1). The conduct of the study followed all required ethical and legal national and international requirements for observational clinical studies in human subjects. The registry protocol and informed consent have been approved by a national scientific and ethical committee for human research. GETNE and RGETNE are funded by Novartis Oncology (Spain), Ipsen Pharma (Spain), and Pfizer (Spain). Ipsen provided an unrestricted grant to support the onsite registry audit by B.N‐V. B.N‐V was funded by the BBVA Foundation and Carolina Foundation.
Contributed equally
Author Contributions
Conception/design: Alberto Carmona‐Bayonas, Rocio Garcia‐Carbonero
Collection and/or assembly of data: Barbara Nuñez‐Valdovinos, Alberto Carmona‐Bayonas, Paula Jimenez‐Fonseca, Jaume Capdevila, Angel Castaño‐Pascual, Marta Benavent, Jose Javier Pi Barrio, Alex Teule, Vicente Alonso, Ana Custodio, Monica Marazuela, Angel Segura, Adolfo Beguiristain, Marta Llanos, Maria Purificacion Martinez del Prado, Jose Angel Diaz‐Perez, Daniel Castellano, Isabel Sevilla, Carlos Lopez, Teresa Alonso, Rocio Garcia‐Carbonero
Data analysis and interpretation: Barbara Nuñez‐Valdovinos, Alberto Carmona‐Bayonas, Paula Jimenez‐Fonseca, Jaume Capdevila, Angel Castaño‐Pascual, Marta Benavent, Jose Javier Pi Barrio, Alex Teule, Vicente Alonso, Ana Custodio, Monica Marazuela, Angel Segura, Adolfo Beguiristain, Marta Llanos, Maria Purificacion Martinez del Prado, Jose Angel Diaz‐Perez, Daniel Castellano, Isabel Sevilla, Carlos Lopez, Teresa Alonso, Rocio Garcia‐Carbonero
Manuscript writing: Barbara Nuñez‐Valdovinos, Alberto Carmona‐Bayonas, Paula Jimenez‐Fonseca, Rocio Garcia‐Carbonero
Final approval of manuscript: Barbara Nuñez‐Valdovinos, Alberto Carmona‐Bayonas, Paula Jimenez‐Fonseca, Jaume Capdevila, Angel Castaño‐Pascual, Marta Benavent, Jose Javier Pi Barrio, Alex Teule, Vicente Alonso, Ana Custodio, Monica Marazuela, Angel Segura, Adolfo Beguiristain, Marta Llanos, Maria Purificacion Martinez del Prado, Jose Angel Diaz‐Perez, Daniel Castellano, Isabel Sevilla, Carlos Lopez, Teresa Alonso, Rocio Garcia‐Carbonero
Disclosures
The authors indicated no financial relationships.
References
- 1. Dasari A, Shen C, Halperin D et al. Trends in the incidence, prevalence, and survival outcomes in patients with neuroendocrine tumors in the United States. JAMA Oncol 2017;3:1335–1342. [DOI] [PMC free article] [PubMed] [Google Scholar]
- 2. Williams ED, Sandler M. The classification of carcinoid tumours. Lancet 1963;1:238–239. [DOI] [PubMed] [Google Scholar]
- 3. Klöppel G, Perren A, Heitz PU. The gastroenteropancreatic neuroendocrine cell system and its tumors: The WHO classification. Ann N Y Acad Sci 2004;1014:13–27. [DOI] [PubMed] [Google Scholar]
- 4. Rindi G, Arnold R, Bosman F et al. Nomenclature and classification of digestive neuroendocrine tumours In: Bosman FT, Carneiro F, Hruban R. et al., eds. WHO Classification of Tumours, Pathology and Genetics of Tumours of the Digestive System. 4th ed Lyon, France: International Agency for Research on Cancer (IARC) Press, 2010:10–12. [Google Scholar]
- 5. Takahari D, Boku N, Mizusawa J et al. Determination of prognostic factors in Japanese patients with advanced gastric cancer using the data from a randomized controlled trial, Japan clinical oncology group 9912. The Oncologist 2014;19:358–366. [DOI] [PMC free article] [PubMed] [Google Scholar]
- 6. Ricci C, Casadei R, Taffurelli G et al. Validation of the 2010 WHO classification and a new prognostic proposal: A single centre retrospective study of well‐differentiated pancreatic neuroendocrine tumours. Pancreatology 2016;16:403–410. [DOI] [PubMed] [Google Scholar]
- 7. Shen C, Yin Y, Chen H et al. Neuroendocrine tumors of colon and rectum: Validation of clinical and prognostic values of the World Health Organization 2010 grading classifications and European Neuroendocrine Tumor Society staging systems. Oncotarget 2017;8:22123–22134. [DOI] [PMC free article] [PubMed] [Google Scholar]
- 8. Panzuto F, Boninsegna L, Fazio N et al. Metastatic and locally advanced pancreatic endocrine carcinomas: Analysis of factors associated with disease progression. J Clin Oncol 2011;29:2372–2377. [DOI] [PubMed] [Google Scholar]
- 9. Garcia‐Carbonero R, Capdevila J, Crespo‐Herrero G et al. Incidence, patterns of care and prognostic factors for outcome of gastroenteropancreatic neuroendocrine tumors (GEP‐NETs): Results from the National Cancer Registry of Spain (RGETNE). Ann Oncol 2010;21:1794–1803. [DOI] [PubMed] [Google Scholar]
- 10. Sorbye H, Welin S, Langer SW et al. Predictive and prognostic factors for treatment and survival in 305 patients with advanced gastrointestinal neuroendocrine carcinoma (WHO G3): The NORDIC NEC study. Ann Oncol 2013;24:152–160. [DOI] [PubMed] [Google Scholar]
- 11. Coriat R, Walter T, Terris B et al. Gastroenteropancreatic well‐differentiated grade 3 neuroendocrine tumors: Review and position statement. The Oncologist 2016;21:1191–1199. [DOI] [PMC free article] [PubMed] [Google Scholar]
- 12. Heetfeld M, Chougnet CN, Olsen IH et al. Characteristics and treatment of patients with G3 gastroenteropancreatic neuroendocrine neoplasms. Endocr Relat Cancer 2015;22:657–664. [DOI] [PubMed] [Google Scholar]
- 13. Basturk O, Yang Z, Tang LH et al. The high‐grade (WHO G3) pancreatic neuroendocrine tumor category is morphologically and biologically heterogenous and includes both well differentiated and poorly differentiated neoplasms. Am J Surg Pathol 2015;39:683–690. [DOI] [PMC free article] [PubMed] [Google Scholar]
- 14. Vélayoudom‐Céphise FL, Duvillard P, Foucan L et al. Are G3 ENETS neuroendocrine neoplasms heterogeneous? Endocr Relat Cancer 2013;20:649–657. [DOI] [PubMed] [Google Scholar]
- 15. Milione M, Maisonneuve P, Spada F et al. The clinicopathologic heterogeneity of grade 3 gastroenteropancreatic neuroendocrine neoplasms: Morphological differentiation and proliferation identify different prognostic categories. Neuroendocrinology 2017;104:85–93. [DOI] [PubMed] [Google Scholar]
- 16. Martin‐Perez E, Capdevila J, Castellano D et al. Prognostic factors and long‐term outcome of pancreatic neuroendocrine neoplasms: Ki‐67 index shows a greater impact on survival than disease stage. The large experience of the Spanish National Tumor Registry (RGETNE). Neuroendocrinology 2013;98:156–168. [DOI] [PubMed] [Google Scholar]
- 17. Liu Y, De A. Multiple imputation by fully conditional specification for dealing with missing data in a large epidemiologic study. Int J Stat Med Res 2015;4:287–295. [DOI] [PMC free article] [PubMed] [Google Scholar]
- 18. Rindi G, Petrone G, Inzani F. The 2010 WHO classification of digestive neuroendocrine neoplasms: A critical appraisal four years after its introduction. Endocr Pathol 2014;25:186–192. [DOI] [PubMed] [Google Scholar]
- 19. Rindi G, Falconi M, Klersy C et al. TNM staging of neoplasms of the endocrine pancreas: Results from a large international cohort study. J Natl Cancer Inst 2012;104:764–77. [DOI] [PubMed] [Google Scholar]
- 20. Klöppel G, Klimstra DS, Hruban RH et al. Pancreatic neuroendocrine tumors: Update on the new World Health Organization classification. AJSP Rev Reports 2017;22:233–239. [Google Scholar]
- 21. Lawrence B, Gustafsson BI, Chan A et al. The epidemiology of gastroenteropancreatic neuroendocrine tumors. Endocrinol Metab Clin North Am 2011;40:1–18, vii. [DOI] [PubMed] [Google Scholar]
- 22. Tang LH, Basturk O, Sue JJ et al. A practical approach to the classification of WHO grade 3 (G3) well‐differentiated neuroendocrine tumor (WD‐NET) and poorly differentiated neuroendocrine carcinoma (PD‐NEC) of the pancreas. Am J Surg Pathol 2016;40:1192–1202. [DOI] [PMC free article] [PubMed] [Google Scholar]
- 23. Korse CM, Taal BG, van Velthuysen ML et al. Incidence and survival of neuroendocrine tumours in the Netherlands according to histological grade: Experience of two decades of cancer registry. Eur J Cancer 2013;49:1975–1983. [DOI] [PubMed] [Google Scholar]
- 24. Miyoshi T, Umemura S, Matsumura Y et al. Genomic profiling of large‐cell neuroendocrine carcinoma of the lung. Clin Cancer Res 2016;23:757–765. [DOI] [PubMed] [Google Scholar]
Associated Data
This section collects any data citations, data availability statements, or supplementary materials included in this article.


