Abstract
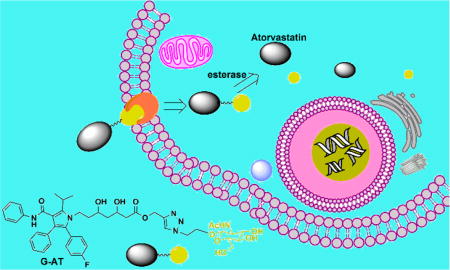
Targeting ligands facilitate cell specific drug delivery and improve pharmaceutical properties. Herein, we designed two ligand drug conjugates by conjugating GlcNAc (N-acetylglucosamine) with atorvastatin. These two conjugates, termed G-AT and G-K-AT, exhibited enhanced water solubility and cellular uptake. Moreover, both G-AT and G-K-AT were able to release atorvastatin and consequently achieve significant inhibition against 3-hydroxy-3-methyl-glutaryl-coenzyme A (HMG-CoA) reductase.
Graphical abstract
INTRODUCTION
Atorvastatin, with the trade name Lipitor, is one of the most prescribed drugs in the statin family for the treatment of dyslipidemia and the prevention of cardiovascular diseases.1–3 Atorvastatin functions in hepatocytes in the liver as a lipid-lowering agent by inhibiting 3-hydroxy-3-methyl-glutarylcoenzyme A (HMG-CoA) reductase, a crucial enzyme in the early stage of biosynthesis of cholesterol.1–3 However, the bioavailability of atorvastatin is relatively low (approximate 12% with a 40 mg oral administration),4 due to its low water solubility, dissolution rate, and membrane permeability.5,6 Extensive efforts have been made to enhance its dissolution rate by incorporating a calcium salt or additional ingredients in its pharmaceutical formulation (tablets, capsules, or powders).7,8 In order to further improve pharmaceutical profiles of atorvastatin, a new strategy is needed such as incorporation of targeting ligands.
Small molecule ligands have been widely investigated for the delivery of drugs to targeted cells, which improve drug properties such as chemical stability, pharmacokinetics, and cellular uptake.9–18 A number of ligands including folate acid,13 glucosamine,12 biotin,14 and pamidronate11,15 were widely used to target specific cell populations, which showed potential for therapeutic applications. N-acetylglucosamine (GlcNAc), a glucose derivative, was reported as a high affinity ligand for hepatic receptors.19 GlcNAc modified polyacrylamide gels showed strong adhesion to chicken hepatocytes.20 Thus, GlcNAc may be a promising ligand for delivery of atorvastatin.
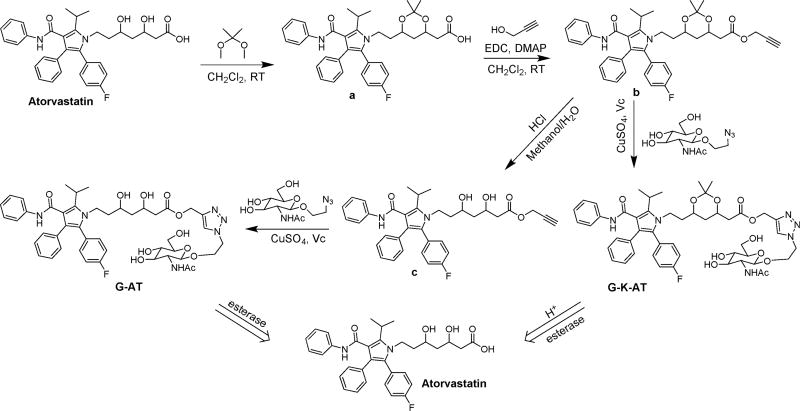
Hence, we designed two atorvastatin derivatives, G-AT and G-K-AT (Scheme 1), by conjugating atorvastatin and GlcNAc through a “click reaction”.21 Both conjugates showed increased water solubility and cell permeability. The conjugates themselves showed no inhibiting activity on HMG-CoA, while restoring the activity after releasing atorvastatin. G-AT can be hydrolyzed by esterase in biological pH (pH ~ 7.40) and G-K-AT can be hydrolyzed in a more acidic environment (pH ~ 4.5, lysosomal pH value22). Importantly, cellular uptake of G-AT and G-K-AT was dramatically increased compared to atorvastatin.
Scheme 1.
Synthetic Routes of G-AT and G-K-AT
Design and Synthesis
First, we synthesized G-AT and G-K-AT following the synthetic routes as shown in Scheme 1. Two hydroxyl groups were protected with a ketal to provide compound a. Then, a propargyl group was installed onto compound a and yielded compound b. After deprotection of compound b in diluted hydrochloric acid, intermediate c was obtained. GlcNAc group was then introduced through a “click reaction” to afford G-AT. A similar “click reaction” between compound b and GlcNAc was performed to produce G-K-AT. In order to visualize the cellular uptake of GlcNAc, Cy7, a near-infrared fluorophore, was conjugated to GlcNAc using the same synthetic method, providing G-Cy7 (Supporting Information, Scheme S1). Structures of these conjugates were confirmed by 1H NMR and mass spectrometry (Supporting Information).
Then, we measured the solubility of atorvastatin, G-AT and G-K-AT in water through a UV-spectra assay. Their solubility was calculated using a standard curve: 0.18 ± 0.0025 mmol/L, 0.78 ± 0 mmol/L, and 1.58 ± 0.0028 mmol/L for atorvastatin (in a calcium salt form), G-AT, and G-K-AT, respectively (Table 1 and Supporting Information, Table S1). Water solubility of G-AT and G-K-AT was approximately 4- and 9-fold higher than that of atorvastatin, respectively. In addition, atorvastatin showed enhanced water solubility at a lower pH environment, while G-AT and G-K-AT displayed higher water solubility at pH 7.4 in comparison with pH 4.5 (Table S1). To investigate whether G-AT and G-K-AT formed micelles, we conducted dynamic light scattering (DLS) studies using a NanoZS Zetasizer. As shown in Table S2, both G-AT and G-K-AT produced relatively homogeneous micelles. Particle size was 144 ± 4.5 nm and 95.8 ± 1.1 nm, respectively. Regarding atorvastatin, no detectable particles were observed. The formation of micelles may lead to enhanced water solubility of G-AT and G-K-AT.
Table 1.
Water Solubility of Atorvastatin, G-AT, and G-K-AT
| water solubility (mmol/L) | |
|---|---|
| Atorvastatin | 0.18 ± 0.0025 |
| G-AT | 0.78 ± 0 |
| G-K-AT | 1.58 ± 0.0029 |
We next studied hydrolysis of G-AT and G-K-AT to release atorvastatin. When incubated with esterase in PBS (pH 7.40) at 37 °C, G-AT was quickly transformed into atorvastatin through a two-step process (Scheme S2). According to the mass spectra analysis, GlcNAc was first cleaved. The remaining moiety formed an intermolecular ester, and then released atorvastatin (Figure S1). On the other hand, G-K-AT first underwent an incubation in an acidic PBS (pH 4.5) to eliminate the ketal group; and then was hydrolyzed with esterase to afford atorvastatin (Figure S3). No hydrolysis products of G-K-AT were detected through mass spectra analysis after incubated in PBS (pH 7.40, Figure S2). These results suggest that G-K-AT is more stable than G-AT.
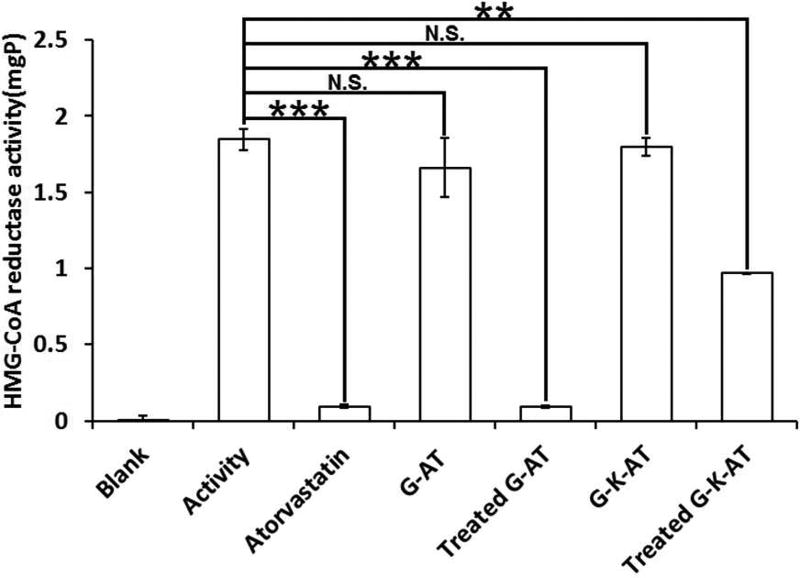
In order to test whether atorvastatin released from G-AT and G-K-AT is functional, we measured their activity using a HMG-CoA Reductase Assay Kit. Neither G-AT nor G-K-AT showed any inhibiting activity, while their hydrolysis products showed significant inhibition of HMG-CoA reductase (Figure 1). After hydrolysis by esterase, G-AT showed comparable activity to atorvastatin. Since G-K-AT possesses an additional ketal protection, it underwent a two-step hydrolysis after deprotecting the ketal group in an acidic environment. G-K-AT displayed less activity than atorvastatin due to a slower release of atorvastatin.
Figure 1.
Inhibition of HMG-CoA reductase activity by atorvastatin, G-AT, G-K-AT, and their hydrolysis products. (Triplicate; **, P < 0.01; ***, P < 0.001; N.S., P > 0.05; t test, double-tailed.)
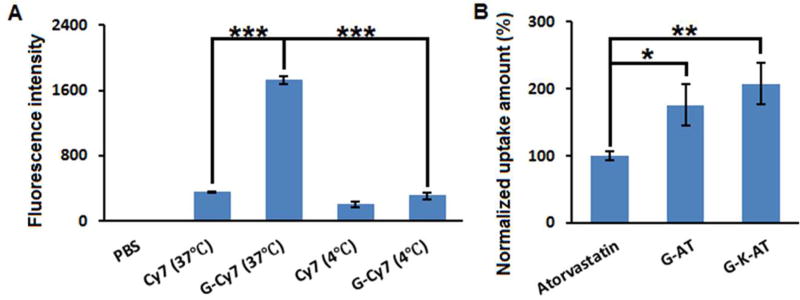
To further study cellular uptake of GlcNAc derivatives, G-Cy7 was synthesized as mentioned above. After incubation of Hep3B cells (a human hepatoma cell line) with G-Cy7, fluorescence intensity was quantified through fluorescence-activated cell sorting (FACS) analysis. As shown in Figure 2A, the G-Cy7 group (intensity = 1727) showed much higher fluorescence intensity than free Cy7 group (intensity = 349). When endocytosis was inhibited by decreasing the incubation temperature to 4 °C,23 G-Cy7 treated cells displayed a significant lower fluorescence intensity (intensity = 310; p < 0.001). These results indicate that endocytosis is the main pathway for cellular uptake of G-Cy7.
Figure 2.
(A) Fluorescence intensity of Hep3B cell treated with Cy7 or G-Cy7. (B) Cellular uptake of atorvastatin, G-AT, or G-K-AT. The data were normalized to the amount of atorvastatin. (Triplicate; *, P < 0.05; **, P < 0.01; ***, P < 0.001; t test, double-tailed).
We then examined cellular uptake of G-AT and G-K-AT. Equal amounts of atorvastatin, G-AT and G-K-AT were used to treat Hep3B cells, respectively. After incubation, culture medium was removed and the amount of drugs in cells was quantified using the same UV-spectra analysis as mentioned above. The total amount of G-AT and G-K-AT were calculated to be 176% and 207% of atorvastatin group, respectively, significantly higher than atorvastatin (Figure 2B and Supporting Information, Table S3). In addition, both G-AT and G-K-AT showed release of free atorvastatin in cells using mass spectra analysis (Supporting Information, Figure S4 and Figure S5).
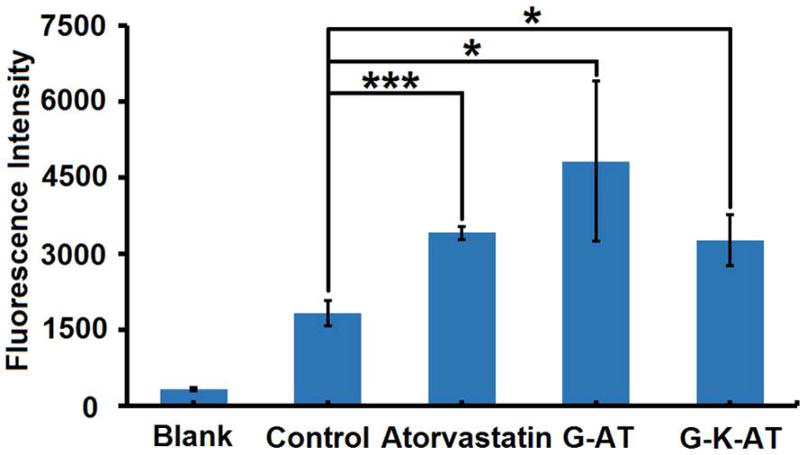
Finally, we examined the biological function of G-AT and G-K-AT in cells using a method reported previously.25 According to its mechanism of action, after internalization by hepatocytes, atorvastatin inhibits HMG-CoA, and consequently induces increased expression of low-density lipoprotein (LDL) receptors.25 In the study, we measured the amount of LDL receptors on Hep3B cells treated with atorvastatin, G-AT, and G-K-AT using a flow cytometer. As shown in Figure 3, LDL receptors were significantly increased in the groups of atorvastatin, G-AT, and G-K-AT compared to the untreated group. These results indicate G-AT and G-K-AT are able to release atorvastatin and then increase LDL receptors accordingly.
Figure 3.
Effects of atorvastatin, G-AT, and G-K-AT on LDL receptors expression in Hep3B cell line. The amount of LDL receptors were quantified by an immunofluorescence assay. (Triplicate; *, P < 0.05; ***, P < 0.001; t test, double-tailed).
CONCLUSION
In conclusion, we designed and synthesized two GlcNAc-conjugated atorvastatin, G-AT and G-K-AT. Both G-AT and G-K-AT demonstrated enhanced water solubility and cellular uptake than free atorvastatin. G-AT and G-K-AT were able to be hydrolyzed at different conditions due to different chemical stability, which enables us to tune its pharmaceutical profiles in future applications. The hydrolysis products of G-AT and G-K-AT dramatically inhibited the activity of HMG-CoA reductase. Moreover, both G-AT and G-K-AT increased LDL receptors in Hep3B cells. Reflecting the data above, these results prove the concept of our design and merit further development of cell specific delivery of atorvastatin for therapeutic applications.
EXPERIMENTAL SECTION
Materials
Esterase from porcine liver, HMG-CoA Reductase Assay Kit and other chemicals were purchased from Sigma-Aldrich or Alfa-Aesar. Eagle’s Minimum Essential Medium (EMEM) was purchased from Corning Incorporated (NY, USA). All chemicals were used without further purification. Compounds a, b, and c were synthesized according to the methods reported previously.24
Synthesis of G-AT
Compound c (20 mg, 0.034 mmol) and 2-azidoethyl 2-acetamido-2-deoxy-β-d-glucopyranoside (20 mg, 0.069 mmol) were dissolved in 4 mL ethanol and stirred at RT under Ar. CuSO4 (10 mg, 0.063 mmol) in 0.5 mL water and sodium ascorbate (20 mg, 0.10 mmol) in 0.5 mL water were added to the reacting mixture. The resulting mixture was stirred for another 12 h. After washing with water and CH2Cl2, the organic phase was collected and evaporated. The crude product was purified by column chromatography using a Combiflash Rf system with CH2Cl2/MeOH (85/15 by volume) to give the product in a white solid (18 mg, yield 59.8%). 1H NMR (400 MHz, CD3OD) δ = 8.01 (1H, s), 7.32−7.24 (6H, m), 7.15−7.05 (7H, m), 5.28−5.20 (2H, m), 4.60−4.58 (2H, d, J = 8), 4.42−4.40 (1H, m), 4.26−4.24 (1H, m), 4.06−4.05 (2H, m), 3.93−3.85 (3H, m), 3.72−3.66 (3H, m), 3.47−3.45 (2H, m), 3.37 (7H, s), 3.33 (4H, s), 2.54−2.41 (2H, m), 1.94 (3H, s), 1.70 (2H, s), 1.51−1.49 (6H, d, J = 4). MS (m/z): [M + H]+ calcd. for C46H56FN6O11, 886.3991; found, 887.3953.
Synthesis of G-K-AT
Compound b (20 mg, 0.031 mmol) and 2-azidoethyl 2-acetamido-2-deoxy-β-d-glucopyranoside (20 mg, 0.069 mmol) were dissolved in 4 mL ethanol and stirred at RT under Ar. CuSO4 (10 mg, 0.063 mmol) in 0.5 mL water and sodium ascorbate (20 mg, 0.10 mmol) in 0.5 mL water were added to the reacting mixture. The resulting mixture was stirred for another 12 h. After washing with water and CH2Cl2, the organic phase was collected and evaporated. The crude product was purified by column chromatography using a Combiflash Rf system with CH2Cl2/MeOH (90/10 by volume) to give the product in a white solid (19 mg, yield 65.0%). 1H NMR (400 MHz, CD3Cl) δ = 7.78 (1H, s), 7.20−7.17 (8H, m), 7.09−7.07 (2H, d, J = 8), 7.02−6.98 (3H, t, J = 8), 6.91 (1H, s), 5.20 (2H, m), 4.53−4.44 (6H, m), 4.22−4.20 (2H, m), 4.10−4.05 (1H, m), 3.95 (1H, s), 3.84−3.82 (3H, m), 3.68 (2H, s), 3.59−3.56 (2H, m), 3.32 (1H, s), 2.52−2.46 (1H, m), 2.38−2.28 (1H, m), 2.07 (3H, s), 1.96 (3H, s), 1.67−1.64 (2H, m), 1.54−1.53 (6H, d, J = 4), 1.34 (6H, s). MS (m/z): [M + H]+ calcd. for C49H60FN6O11, 927.4304; found, 927.4240.
Synthesis of G-Cy7
Propargyl-Cy7 (20 mg, 0.027 mmol) and 2-azidoethyl 2-acetamido-2-deoxy-β-d-glucopyranoside (15 mg, 0.052 mmol) were dissolved in 3 mL ethanol and stirred at RT under Ar. CuSO4 (5 mg, 0.032 mmol) in 0.3 mL water and sodium ascorbate (10 mg, 0.05 mmol) in 0.3 mL water were added to the reacting mixture. The resulting mixture was stirred for another 12 h. After washing with water and CH2Cl2, the organic phase was collected and evaporated. The crude product was purified by column chromatography using a Combiflash Rf system with CH2Cl2/MeOH, (85/15 by volume) to give the product in a blue solid (14 mg, yield 49.0%). 1H NMR (400 MHz, CD3OD) δ = 8.01 (1H, s), 7.80 (2H, s), 7.39−7.37 (2H, d, J = 8), 7.33−7.31 (2H, m), 7.09 (3H, s), 5.81 (1H, s), 5.20 (2H, s), 4.58−4.55 (2H, m), 4.42−4.39 (1H, m), 4.25−4.20 (1H, m), 3.92−3.88 (2H, m), 3.80−3.76 (2H, t, J = 8), 3.70−3.66 (2H, m), 3.46−3.41 (5H, m), 3.34−3.33 (5H, m), 3.32 (2H, m), 2.57 (3H, s), 2.43−2.39 (2H, t, J = 8), 1.93 (3H, s), 1.88−1.81 (4H, m), 1.74−1.72 (1H, m), 1.51−1.43 (3H, m), 1.31 (2H, s), 0.94−0.87 (1H, m). MS (m/z): M+ calcd. for C51H68N7O8, 906.5124; found, 906.5132.
Quantification of Water Solubility
Standard curves of absorption intensity at 290 nm against concentration for atorvastatin and two conjugates were plotted (Supporting Information, Table S1). By measuring the absorption intensity at 290 nm of saturated solution of three compounds in water (diluted with methanol before spectra test), water solubility of each conjugate was determined.
Hydrolysis Assay
G-AT was dissolved in DMSO to obtain a 3.5 mmol/L stock solution. 15 µL of stock solution was then added into 485 µL of PBS (pH 7.40) with esterase (0.5 mg/mL) in a 1.5 mL sealed tube and shaken at 37 °C for fixed time as 0, 3, and 24 h. The hydrolysis reaction was terminated by adding 0.5 mL of dichloromethane and shaken strongly. The organic phase was used for mass spectrometry analysis. G-K-AT was dissolved in DMSO to obtain a 3.5 mmol/L stock solution. 15 µL of stock solution was then added into 235 µL of PBS (pH 4.50) and incubated at 37 °C for 24 h. pH of the solution was adjusted to 7.40 by adding 1 mmol/L NaOH aqueous. Then, 250 µL PBS (pH 7.40) with esterase (1.0 mg/mL) was added. The mixture was shaken at 37 °C for 24 h. The hydrolysis was terminated by adding 0.5 mL of dichloromethane and shaken strongly. The organic phase was used for mass spectrometry analysis.
Quantification of HMG-CoA Reductase activity
Activity of HMG-CoA Reductase was measured through a HMG-CoA Reductase Assay Kit following the standard procedure. After adding the regents in requested order, the absorption at 340 nm was immediately collected every 20 s for up to 10 min. The activity of HMG-CoA Reductase was calculated according to the following equation:
where 12.44 = εmM – the extinction coefficient for NADPH at 340 nm is 6.22 mM−1 cm−1. 12.44 represents the 2 NADPH consumed in the reaction. TV = Total volume of the reaction in ml (0.2 mL is used in this assay). V = Volume of enzyme used in the assay (12 × 10−3 mL). 0.6 = Enzyme concentration in mg-protein (mgP)/mL. LP = Light path in cm (0.55 cm is used for this assay).
Cell Uptake of Cy7 and G-Cy7
Human hepatocellular carcinoma Hep3B cell line (ATCC) was maintained in Eagle’s Minimum Essential Medium (EMEM) supplemented with 10% heat inactivated FBS at 37 °C with an air atmosphere of 5% CO2. Hep3B cells were seeded in 6-well clear bottom plates (15 × 104 cells/mL, 2 mL/well). After 24 h incubation, 200 µL stock solution of Cy7 and G-Cy7 (5 mM in DMSO) was added with DMSO as a control group, which make the final concentration of each dye to be 5 µM. 2 h after treatment at 4 or 37 °C, cells were collected and the fluorescence signal from Cy7 or G-Cy7 was quantified with BD LSR II flow cytometry analyzer (BD Biosciences, San Jose, CA).
Cellular Uptake of Atorvastatin, G-AT, and G-K-AT
Hep3B cells were seeded in 6-well clear bottom plates (2 × 10⁴ cells/500 µL). After 24 h incubation, 10 µL stock solutions of atorvastatin, G-AT, and G-K-AT (21 mM in DMSO) were added with DMSO as a control group. 2 h after treatment, cells were collected and extracted using a mixture of 0.5 mL CH2Cl2 and 0.5 mL methanol. After filtration, the solution was used for mass spectra and UV-spectra analysis. The amount of drugs were determined through standard curves (Supporting Information, Table S3).
Immunofluorescent Staining Analysis of LDL Receptors
Hep3B cells were seeded in 6-well clear bottom plates (1 × 10⁵ cells/mL, 2 mL/well). After 24 h incubation, 1 µL stock solutions of atorvastatin, G-AT, and G-K-AT (10 mM in DMSO) were added (final concentration is 5 µM). After 48 h incubation, cells were collected and washed with PBS twice. Cells were resuspended to approximately 1 × 10⁶ cells/mL in ice cold PBS, 1% sodium azide in 1.5 mL tube. Cells of three test groups and one control group were incubated with anti-LDL receptor antibody (primary monoclonal antibody, clone 2H7.1, EMD Millipore Corporation) for 30 min at room temperature. Cells were washed twice with cold PBS and resuspended in 1 mL ice cold PBS, 1% sodium azide. They were incubated with Alexa 647-labeled secondary antibody (Goat Anti-Mouse IgG H&L) for 25 min at room temperature in the dark. Cells were washed twice with cold PBS, and then resuspended in 0.3 mL cold PBS; fluorescence was quantified immediately with BD LSR II flow cytometry analyzer (BD Biosciences, San Jose, CA).
Supplementary Material
Acknowledgments
Y.D. accknowledges the support from the Maximizing Investigators’ Research Award 1R35GM119679 from the National Institute of General Medical Sciences as well as the start-up fund from the College of Pharmacy at The Ohio State University.
ABBREVIATIONS
- DLS
Dynamic light scattering
- GlcNAc
N-acetylglucosamine
Footnotes
ASSOCIATED CONTENT
- Synthesis, mass spectra, and 1H NMR spectra of the compounds (PDF)
The authors declare no competing financial interest.
NOTE ADDED AFTER ASAP PUBLICATION
This paper was published to the Web on August 7, 2017, with several errors. GalNAc has been changed to GlcNAc throughout the paper, and references 18−20 have been replaced in the version published to the Web on August 19, 2017.
References
- 1.Buhaescu I, Izzedine H. Mevalonate pathway: A review of clinical and therapeutical implications. Clin. Biochem. 2007;40:575–584. doi: 10.1016/j.clinbiochem.2007.03.016. [DOI] [PubMed] [Google Scholar]
- 2.Endo A. The discovery and development of HMG-CoA reductase inhibitors. J. Lipid Res. 1992;33:1569–1582. [PubMed] [Google Scholar]
- 3.Istvan ES. Structural mechanism for statin inhibition of 3-hydroxy-3-methylglutaryl coenzyme A reductase. Am. Heart J. 2002;144:S27–S32. doi: 10.1067/mhj.2002.130300. [DOI] [PubMed] [Google Scholar]
- 4.Lennernäs H, Fager G. Pharmacodynamics and Pharmacokinetics of the HMG-CoA Reductase Inhibitors. Clin. Pharmacokinet. 1997;32:403–425. doi: 10.2165/00003088-199732050-00005. [DOI] [PubMed] [Google Scholar]
- 5.Pekkanen J, Linn S, Heiss G, Suchindran CM, Leon A, Rifkind BM, Tyroler HA. Ten-year mortality from cardiovascular disease in relation to cholesterol level among men with and without preexisting cardiovascular disease. N. Engl. J. Med. 1990;322:1700–1707. doi: 10.1056/NEJM199006143222403. [DOI] [PubMed] [Google Scholar]
- 6.Yu RZ, Gunawan R, Post N, Zanardi T, Hall S, Burkey J, Kim T-W, Graham MJ, Prakash TP, Seth PP, et al. Disposition and Pharmacokinetics of a GalNAc3-Conjugated Antisense Oligonucleotide Targeting Human Lipoprotein (a) in Monkeys. Nucleic Acid Ther. 2016;26:372. doi: 10.1089/nat.2016.0623. [DOI] [PubMed] [Google Scholar]
- 7.Shangraw RF. Compressed Tablets by Direct Compression. In: Lieberman HA, Lachman L, Schwartz JB, editors. Pharmaceutical Dosage Forms: Tablets. 2. Vol. 1. Marcel Dekker; New York: 1989. p. 195. [Google Scholar]
- 8.Panghal D, Nagpal M, Thakur GS, Arora S. Dissolution Improvement of Atorvastatin Calcium using Modified Locust Bean Gum by the Solid Dispersion Technique. Sci. Pharm. 2014;82:177–191. doi: 10.3797/scipharm.1301-23. [DOI] [PMC free article] [PubMed] [Google Scholar]
- 9.Fan W, Wu Y, Li X-K, Yao N, Li X, Yu Y-G, Hai L. Design, synthesis and biological evaluation of brain-specific glucosyl thiamine disulfide prodrugs of naproxen. Eur. J. Med. Chem. 2011;46:3651–3661. doi: 10.1016/j.ejmech.2011.05.029. [DOI] [PubMed] [Google Scholar]
- 10.Grubmüller H, Heymann B, Tavan P. Ligand Binding: Molecular Mechanics Calculation of the Streptavidin-Biotin Rupture Force. Science. 1996;271:997–999. doi: 10.1126/science.271.5251.997. [DOI] [PubMed] [Google Scholar]
- 11.Bhushan KR, Tanaka E, Frangioni JV. Synthesis of Conjugatable Bisphosphonates for Molecular Imaging of Large Animals. Angew. Chem., Int. Ed. 2007;46:7969–7971. doi: 10.1002/anie.200701216. [DOI] [PMC free article] [PubMed] [Google Scholar]
- 12.Chen X, Bi Y, Wang T, Li P, Yan X, Hou S, Bammert CE, Ju J, Gibson KM, Pavan WJ, Bi L. Lysosomal Targeting with Stable and Sensitive Fluorescent Probes (Superior LysoProbes): Applications for Lysosome Labeling and Tracking during Apoptosis. Sci. Rep. 2015;5:9004. doi: 10.1038/srep09004. [DOI] [PMC free article] [PubMed] [Google Scholar]
- 13.Low PS, Henne WA, Doorneweerd DD. Discovery and Development of Folic-Acid-Based Receptor Targeting for Imaging and Therapy of Cancer and Inflammatory Diseases. Acc. Chem. Res. 2008;41:120–129. doi: 10.1021/ar7000815. [DOI] [PubMed] [Google Scholar]
- 14.Weber PC, Ohlendorf DH, Wendoloski JJ, Salemme FR. Structural Origins of High-Affinity Biotin Binding to Streptavidin. Science. 1989;243:85–88. doi: 10.1126/science.2911722. [DOI] [PubMed] [Google Scholar]
- 15.Yin Q, Tang L, Cai K, Tong R, Sternberg R, Yang X, Dobrucki LW, Borst LB, Kamstock D, Song Z, et al. Pamidronate functionalized nanoconjugates for targeted therapy of focal skeletal malignant osteolysis. Proc. Natl. Acad. Sci. U. S. A. 2016;113:E4601–E4609. doi: 10.1073/pnas.1603316113. [DOI] [PMC free article] [PubMed] [Google Scholar]
- 16.Srinivasarao M, Galliford CV, Low PS. Principles in the design of ligand-targeted cancer therapeutics and imaging agents. Nat. Rev. Drug Discovery. 2015;14:203–219. doi: 10.1038/nrd4519. [DOI] [PubMed] [Google Scholar]
- 17.Akinc A, Querbes W, De S, Qin J, Frank-Kamenetsky M, Jayaprakash KN, Jayaraman M, Rajeev KG, Cantley WL, Dorkin JR, et al. Targeted delivery of RNAi therapeutics with endogenous and exogenous ligand-based mechanisms. Mol. Ther. 2010;18:1357–1364. doi: 10.1038/mt.2010.85. [DOI] [PMC free article] [PubMed] [Google Scholar]
- 18.Sanhueza CA, Baksh MM, Thuma B, Roy MD, Dutta S, Préville C, Chrunyk BA, Beaumont K, Dullea R, Ammirati M, et al. Efficient Liver Targeting by Polyvalent Display of a Compact Ligand for the Asialoglycoprotein Receptor. J. Am. Chem. Soc. 2017;139:3528–3536. doi: 10.1021/jacs.6b12964. [DOI] [PMC free article] [PubMed] [Google Scholar]
- 19.Ashwell G, Harford J. Carbohydrate-specific receptors of the liver. Annu. Rev. Biochem. 1982;51:531–554. doi: 10.1146/annurev.bi.51.070182.002531. [DOI] [PubMed] [Google Scholar]
- 20.Schnaar RL, Weigel PH, Kuhlenschmidt MS, Lee YC, Roseman S. Adhesion of chicken hepatocytes to polyacrylamide gels derivatized with N-acetylglucosamine. J. Biol. Chem. 1978;253:7940–7951. [PubMed] [Google Scholar]
- 21.Kolb HC, Finn MG, Sharpless KB. Click Chemistry: Diverse Chemical Function from a Few Good Reactions. Angew. Chem., Int. Ed. 2001;40:2004–2021. doi: 10.1002/1521-3773(20010601)40:11<2004::AID-ANIE2004>3.0.CO;2-5. [DOI] [PubMed] [Google Scholar]
- 22.Mindell JA. Lysosomal Acidification Mechanisms. Annu. Rev. Physiol. 2012;74:69–86. doi: 10.1146/annurev-physiol-012110-142317. [DOI] [PubMed] [Google Scholar]
- 23.Zhang X, Wang C, Jin L, Han Z, Xiao Y. Photostable Bipolar Fluorescent Probe for Video Tracking Plasma Membranes Related Cellular Processes. ACS Appl. Mater. Interfaces. 2014;6:12372–12379. doi: 10.1021/am503849c. [DOI] [PubMed] [Google Scholar]
- 24.Mizoi K, Takahashi M, Haba M, Hosokawa M. Synthesis and evaluation of atorvastatin esters as prodrugs metabolically activated by human carboxylesterases. Bioorg. Med. Chem. Lett. 2016;26:921–923. doi: 10.1016/j.bmcl.2015.12.069. [DOI] [PubMed] [Google Scholar]
- 25.Moon JH, Kang SB, Park JS, Lee BW, Kang ES, Ahn CW, Lee HC, Cha BS. Up-regulation of hepatic low-density lipoprotein receptor-related protein 1: a possible novel mechanism of antiatherogenic activity of hydroxymethylglutaryl-coenzyme A reductase inhibitor Atorvastatin and hepatic LRP1. Metab., Clin. Exp. 2011;60:930–940. doi: 10.1016/j.metabol.2010.08.013. [DOI] [PubMed] [Google Scholar]
Associated Data
This section collects any data citations, data availability statements, or supplementary materials included in this article.


