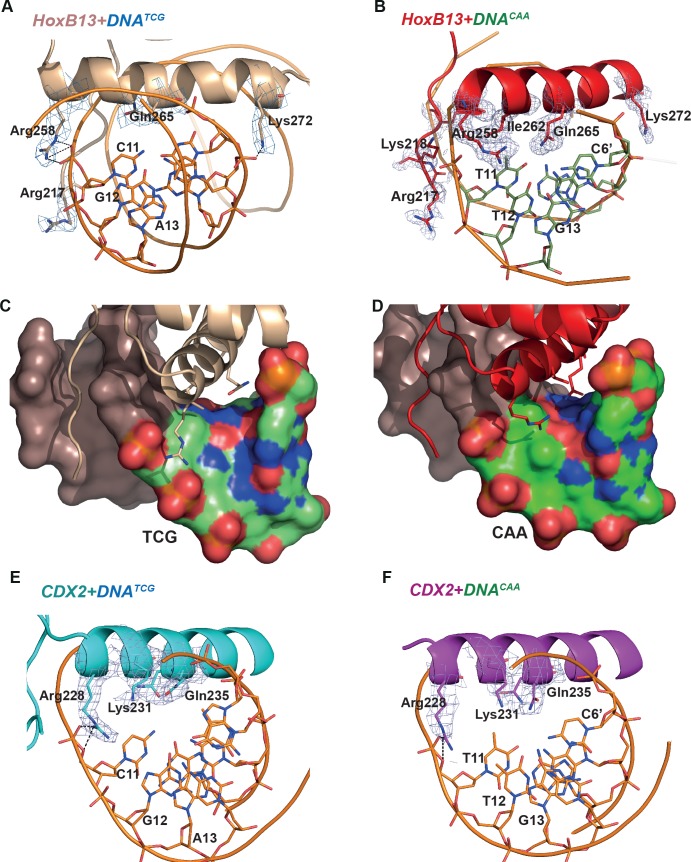
Figure 3. Close view of the protein-DNA interactions.
(A) HOXB13-DNATCG and (B) HOXB13-DNACAA complexes. The 2mFo-Fc maps contoured with 1.5σ are shown around the key residues. The residues and base pairs involved in protein to DNA contacts are also labeled. (C, D) Surface representation of the major groove in HOXB13-DNATCG and HOXB13-DNACAA complexes, respectively. The divergent bases are colored to indicate electrostatic charges of the atoms: neutral carbon atoms are green, oxygen atoms (negative) are red and nitrogen atoms (positive) are blue. Note the larger solvent-accessible space between amino-acids and bases in the TCG structure (C) and the difference in distribution of the positively and negatively charged spots on the surface that can contribute to differences in distribution of water molecules on the surface. (E) CDX2-DNATCG and (F) CDX2-DNACAA complexes. The 2mFo-Fc maps contoured with 1.5σ are shown around the key residues. The residues and base pairs involved in protein to DNA contacts are also labeled.

