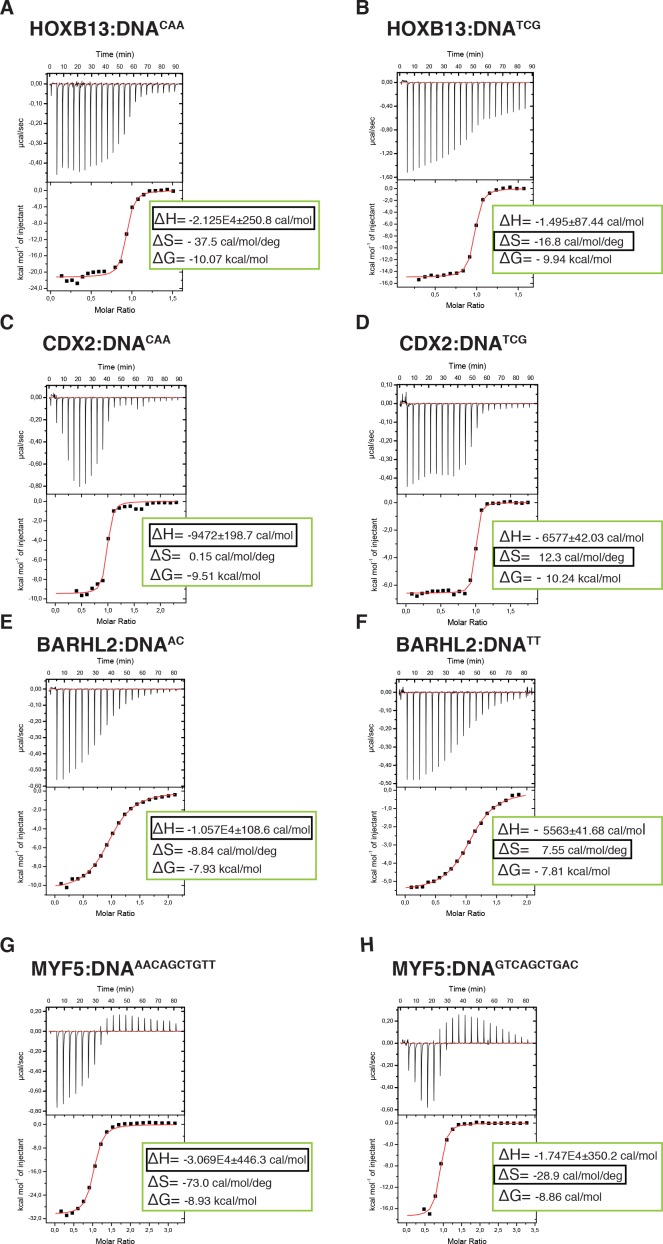
Figure 5. Calorimetric titration data reveals that two optimal DNA sequences recognized by HOXB13 (A, B), CDX2 (C, D), BARHL2 (E, F) and MYF5 (G, H) represent enthalpy and entropy optima.
The optimal sequences with higher enthalpic contribution to binding are presented on the left side (A, C, E, G) and the reactions with higher entropic contribution are presented on the right side (B, D, F, H). Note that for each protein both DNAs are bound with similar ΔG. The top panels of the ITC figures represent raw data; the bottom panels show the integrated heat of the binding reaction. The red line represents the best fit to the data, according to the model that assumes a single set of identical sites. The determined changes of enthalpy and calculated losses of entropy are shown on the bottom panel. The changes of Gibbs free energy, ∆G=∆H-T∆S, are also calculated and presented on the bottom panel of each isotherm.


