Figure 1. State 3 corresponds to the gp120 conformation of the three-CD4-bound HIV-1 Env trimer.
(A) Representative smFRET trace for unliganded HIV-1NL4-3 Env. (Top) The donor fluorophore (green) was attached to the V1 loop and the acceptor fluorophore (red) was attached to the V4 loop. (Bottom) Corresponding FRET trajectory (blue) with overlaid idealization generated by Hidden Markov Modeling (HMM) (red). (B) (Left) Probability distribution of FRET values compiled from all the individual HIV-1NL4-3 Env molecules (N = number of FRET traces analyzed). The histogram was fitted to a sum of three Gaussian distributions, with means of 0.13, 0.3 and 0.63, which are corresponding to States 1, 3 and 2, as indicated. The percentage indicates the occupancy of each FRET state. Error bars represent standard errors calculated from histograms from three independent sets of FRET traces. (Right) Transition Density Plot (TDP) of all the observed transitions in unliganded HIV-1NL4-3 Env. Color bar shows the scale used to indicate the frequency of each transition. (C, D) sCD4 (0.1 mg/ml) (C) or sCD4D1D2-Igαtp (0.1 mg/ml) (D) was incubated with the virus for 30 min prior to imaging. FRET histogram and TDP are as in (B). (E–G) Probability distributions (left) and TDPs (right) for HIV-1JR-FL Env for the unliganded (E) (Note: FRET histogram and TDP were from previous data set for direct comparison [Herschhorn et al., 2016]), sCD4-bound (0.1 mg/ml) (F) and sCD4D1D2-Igαtp-bound (0.1 mg/ml) (G). (H–J) Probability distributions (left) and TDPs (right) for HIV-1BG505 Env for the unliganded (H), sCD4-bound (0.1 mg/ml) (I) and sCD4D1D2-Igαtp-bound (0.1 mg/ml) (J) viruses are displayed as in HIV-1NL4-3. (K) Schematic illustration of the closed and open conformations of the Env trimer. The unliganded conformation is in blue and CD4-bound conformation is in pink. Green and red starts represent donor and acceptor fluorophores, respectively. Sizes of the stars represent relative change of fluorescence between donor and acceptor dyes and dotted line indicated changes of inter-dye distances.
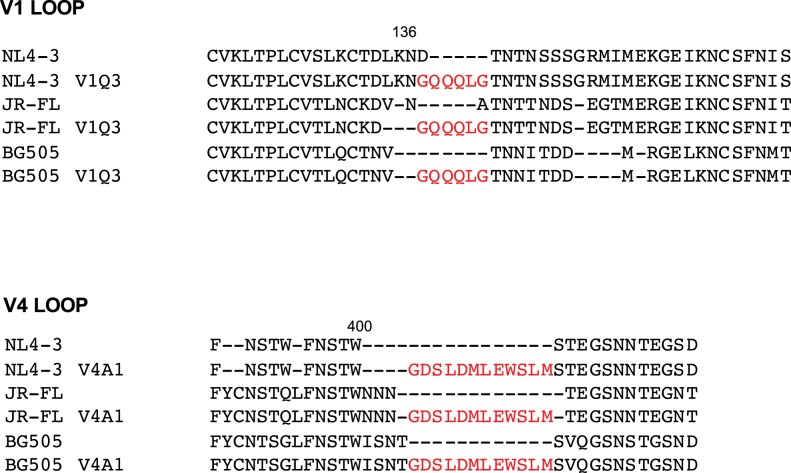
Figure 1—figure supplement 1. Peptide insertion sites into the V1 and V4 loops of gp120 of three HIV-1 isolates.
Figure 1—figure supplement 2. Infectivity and Env incorporation of single or dually tagged HIV-1BG505 viruses.
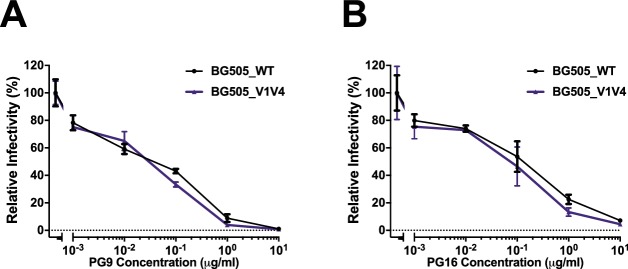
Figure 1—figure supplement 3. Dually tagged HIV-1BG505 antibodies are neutralized by trimer specific antibodies.
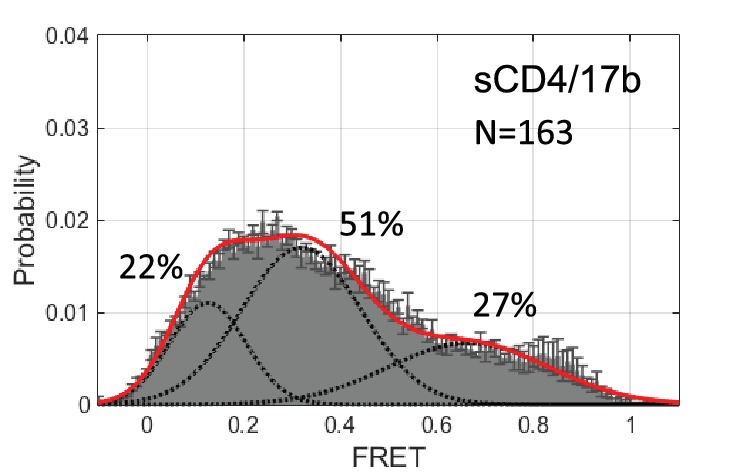
Figure 1—figure supplement 4. smFRET histogram for HIV-1BG505 Env bound to sCD4 and 17b.


