Abstract
Notch signalling maintains stem cell regeneration at the mouse intestinal crypt base and balances the absorptive and secretory lineages in the upper crypt and villus. Here we report the role of Fringe family of glycosyltransferases in modulating Notch activity in the two compartments. At the crypt base, RFNG is enriched in the Paneth cells and increases cell surface expression of DLL1 and DLL4. This promotes Notch activity in the neighbouring Lgr5+ stem cells assisting their self-renewal. Expressed by various secretory cells in the upper crypt and villus, LFNG promotes DLL surface expression and suppresses the secretory lineage . Hence, in the intestinal epithelium, Fringes are present in the ligand-presenting ‘sender’ secretory cells and promote Notch activity in the neighbouring ‘receiver’ cells. Fringes thereby provide for targeted modulation of Notch activity and thus the cell fate in the stem cell zone, or the upper crypt and villus.
Research organism: Mouse
Introduction
Lgr5+ Crypt Base Columnar cells (CBCs) located at the bottom of the crypts constantly self-renew to maintain the small intestinal epithelium, which is one of the fastest regenerative tissues in the body (Barker et al., 2007; van der Flier et al., 2009). CBCs divide and move up the crypt into the progenitor or transit-amplifying zone where the cells rapidly proliferate and terminally differentiate into two major types: absorptive (enterocytes) and secretory (mainly Paneth and goblet cells). Enterocytes and goblet cells populate the villi while the Paneth cells move to the bottom of the crypt and provide a niche for the CBCs (van der Flier et al., 2009).
Notch signalling pathway primarily consists of Notch receptors (NOTCH1-4) and ligands (DLL1-4 and JAG1-2) (Bray, 2006). Upon activation of a Notch receptor by a ligand, it undergoes successive cleavages by ADAM/TACE and γ-secretase (Bray, 2006). The cleaved intracellular domain (NICD) translocates to the nucleus leading to the transcription of multiple genes such as Hes and Hey families (Kopan, 2002; Iso et al., 2003). The extracellular domain of the Notch receptor and ligands contain EGF-like repeats, some of which serve as substrates for O-fucosylation by POFUT1 (Rampal et al., 2007; Wang et al., 2001). The fucosylated product may be further modified within the Golgi network by Fringe proteins: Lunatic (LFNG), Manic (MFNG) and Radical Fringe (RFNG) (Moloney et al., 2000; Haines and Irvine, 2003). Fringe proteins are typically expressed in receptor-expressing ‘receiver’ cells (Haines and Irvine, 2003). Glycosylation of NOTCH1 by LFNG and MFNG increases its activation by DLL1 but decreases its activation by JAG1 (Haines and Irvine, 2003; Hicks et al., 2000; Panin et al., 1997). In contrast, glycosylation by RFNG increases the activation of NOTCH1 by both DLL1 and JAG1 (LeBon et al., 2014).
Notch pathway provides for spatial and context specific decision making in the intestinal epithelium. At the bottom of the crypt, Notch signalling is important for the maintenance of CBCs (Pellegrinet et al., 2011). In the upper crypt however, Notch activity, mainly through Hes1, is essential for the enterocyte differentiation (van der Flier et al., 2009; Fre et al., 2005). Inhibition of Notch signalling results in the loss of proliferative CBCs and progenitor cells and leads to their differentiation into goblet cells in the upper crypt and villus, indicating the importance of the pathway in maintaining the tissue (Pellegrinet et al., 2011; VanDussen et al., 2012; Riccio et al., 2008; Wu et al., 2010). Notch1, 2 and Dll1, 4 are known to be the necessary receptors and ligands in the intestine (Pellegrinet et al., 2011; Riccio et al., 2008; Schröder and Gossler, 2002). Although, the fringe proteins are known to be expressed in the intestine, their function has not been studied (Schröder and Gossler, 2002).
Here we show that Rfng and Lfng are expressed by the ligand-presenting secretory lineages, but at different locations. At the crypt base, Rfng expressed in Paneth cells modulates DLL1 and DLL4, which enhances Notch signalling and self-renewal of neighbouring CBCs. In the upper crypt and villus, Lfng is expressed by secretory cells including enteroendocrine, Tuft and goblet cells. LFNG promotes Notch signalling in the transit amplifying cells and impedes their differentiation into secretory cells. MFNG does not play any noticeable role in intestinal epithelial homeostasis.
Results
Rfng supports Lgr5+ stem cell self-renewal
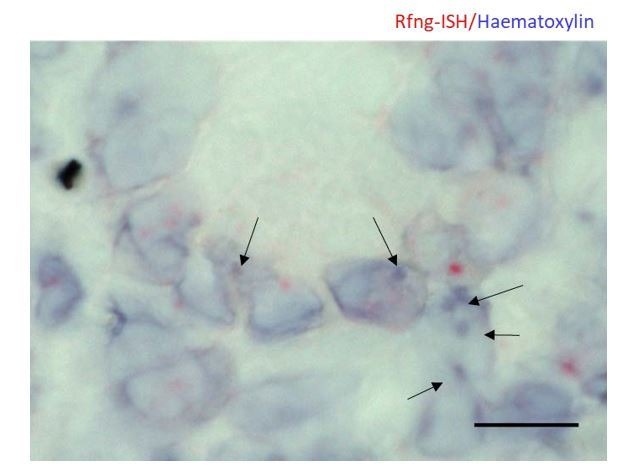
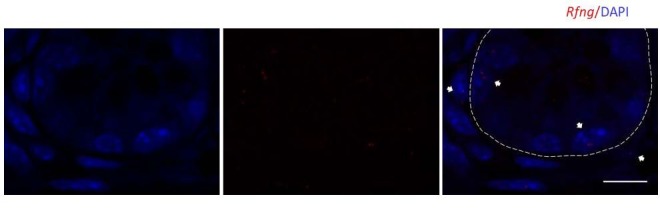
Rfng transcripts have been detected in the crypt by in situ hybridisation (Schröder and Gossler, 2002). We analysed previously published microarray data on Lgr5+ CBCs and Paneth cells (Sato et al., 2011) and found that Rfng is significantly upregulated in Paneth cells (Figure 1—figure supplement 1A). We isolated CBCs and Paneth cells (CD24high/SSChigh) from Lgr5-GFP mice by FACS using an established protocol (Sato et al., 2011; Sato et al., 2009) and found that the Paneth cells are enriched for Rfng (Figure 1A). We validated that the isolated cells are indeed Paneth cells and CBCs by confirming their Lysozyme and GFP expression respectively (Figure 1—figure supplement 1B,C). We also confirmed that Rfng is enriched in the Paneth cells by RNA in situ hybridisation (ISH) (Figure 1B). We validated the specificity of ISH probes using Rfng null mouse intestinal sections (Figure 1—figure supplement 1D,E).
Figure 1. Rfng supports Lgr5+ stem cell self-renewal.
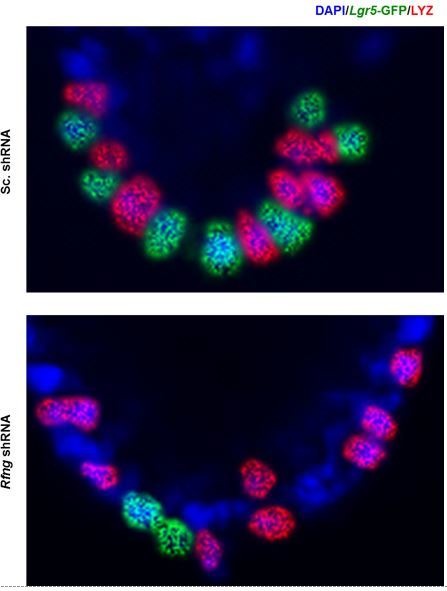
(A) RT-qPCR quantification of Rfng in Lgr5+ CBC and Paneth cells isolated from Lgr5-GFP mouse intestines. The experiment was performed in triplicate and presented as mean ± s.d. (standard deviation) (B) Representative image showing Rfng transcripts (red) and Lysozyme protein (green) expression at the bottom of the crypt of Lgr5-GFP mouse intestine. DAPI (Blue) labels the nuclei and scale bar represents 10 μm. Arrows point to CBCs. (C–D) Single Lgr5-GFP CBCs were transduced with either Sc. shRNA or Rfng shRNA. The experiment was performed in triplicate. (C) Colony forming efficiency measured after 7 days. Quantitative analysis calculated from 1000 cells/replicate presented as mean ± s.d. (D) Left: Representative flow cytometry plots indicating gated percentage of Lgr5+ (GFPhigh) and Paneth cells (CD24high/SSChigh). Right: Ratio of Lgr5-GFP+ CBCs/Paneth cells as determined by flow cytometry and presented as mean ± s.d. (E) Left: Representative plots indicating gated population of CBCs (CD166+CD24loCD44+GRP78-) from the intestine of Rfng+/+ and Rfng-/- mice. Percentage reflects fraction of total population. Right: Ratio of number of CBCs to Paneth cells of n = 3 mice and presented as mean ± s.d. (F) RT-qPCR quantification of Lgr5 in crypts extracted from Rfng+/+ and Rfng-/- mice. n = 3 mice. Data is presented as mean ± s.d. (*p<0.05; **p<0.01; ***p<0.001).

Figure 1—figure supplement 1. Paneth Cells express Rfng.

Figure 1—figure supplement 2. Histological and flow cytometric analysis of Rfng null intestines.

Figure 1—figure supplement 3. Colony formation ability of Lgr5+ CBCs when mixed with Paneth cells from control or Rfng null mice.
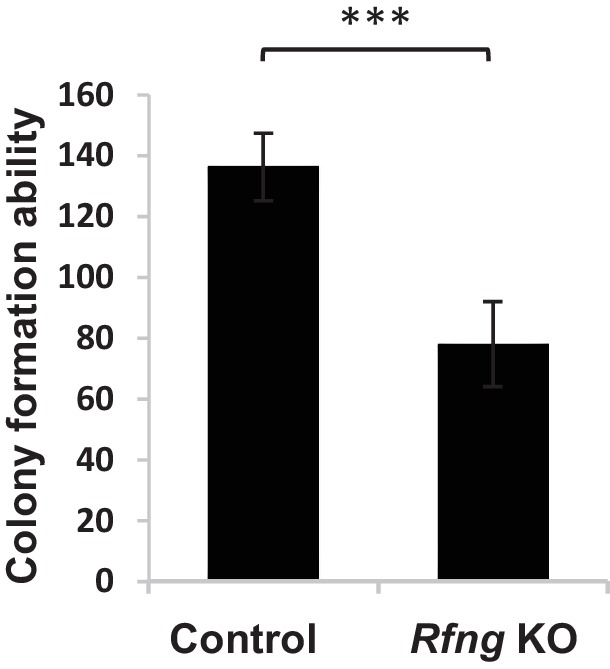
We then established an in vitro knockdown (KD) model using organoid cultures of epithelial cells obtained from Lgr5-GFP mice. Single Lgr5-GFP+ CBCs were transduced with scrambled (Sc.) shRNA (control) or Rfng shRNA and propagated as organoids (Figure 1—figure supplement 1F). The colony formation efficiency of the Rfng KD CBCs was reduced compared to the control (Figure 1C). Flow cytometric analysis showed that the number of Lgr5+ CBCs decreased after Rfng loss, whereas the number of Paneth cells remained relatively unchanged (Figure 1D).
We confirmed the observation in vivo using previously published Rfng deficient (Rfng−/−) mice (Moran et al., 2009). Crypt cells were isolated from Rfng−/− and Rfng+/+ control mice and analysed by flow cytometry using a combination of surface markers to identify CBCs (CD24loCD44+CD166+GRP78-) (Wang et al., 2013). Analysis revealed that the Rfng−/− mice had almost a two-fold depletion in CBCs (Figure 1E). A reduction of CBC marker Lgr5 transcripts in the crypts harvested from Rfng−/− mouse intestines was observed by RT-qPCR measurement when compared to the control (Figure 1F). The number of Paneth and goblet cells remain largely unchanged and no other significant phenotype was detected in the epithelium (Figure 1—figure supplement 2A–F). Loss of Rfng in organoids seems to show a more significant phenotype in CBC reduction than its loss in vivo. This may be because CBCs in vivo also receive cues from the mesenchyme and not just the Paneth cells as in case of organoids.
To confirm that the loss of Rfng only in the Paneth cells can affect the CBCs, we performed the Organoid Reconstitution Assay (ORA) described previously (Rodríguez-Colman et al., 2017). FACS sorted Lgr5-GFP+ CBCs were incubated with Paneth cells from wild type or Rfng null mice for 10 min at room temperature and plated in Matrigel. We find that the colony formation ability of CBCs incubated with Paneth cells lacking Rfng was significantly lower than the control (Figure 1—figure supplement 3). It should be noted that not all CBCs associate with a Paneth cell during the incubation. Also, the Lgr5-GFP+ CBCs divide and give rise to Paneth cells with Rfng. Hence the result of this assay is not as significant as that shown in Figure 1C.
Rfng promotes Notch signalling in CBCs
We isolate, by FACS, the CBCs and Paneth cells from the Rfng KD and control seven days old organoids described earlier. Western blotting shows that Notch target genes Hes1 and Hey1 have reduced expression in the CBCs upon loss of Rfng. However, the levels of ligands DLL1, four and JAG1 on Paneth cells were not significantly altered, consistent with the post-translational modifying role of Fringe (Figure 2A). Rfng KD and control CBCs were then transfected with an RBPJκ-dsRed reporter (Hansson et al., 2006) as an indicator of Notch activity, cultured overnight and analysed by flow cytometry (Figure 2B). Rfng shRNA decreased the mean RBPJκ-dsRed fluorescent intensity, indicating reduced overall Notch signalling in CBCs.
Figure 2. Rfng promotes Notch signaling in Lgr5+ CBC.
(A) Western blot analysis of Notch signaling components in CBCs and Paneth cells FACS sorted from Rfng KD and control organoids. (B) Left: Representative plots for RBPJκ-dsRed and Lgr5-GFP expression indicating a gated double positive fraction for Rfng KD and control CBCs transfected with RBPJκ-dsRed reporter. Right: Mean fluorescence intensity (MFI) of RBPJκ-dsRed expression. The experiment was performed in triplicate and presented as mean ± s.d. (C) Ligand availability on Rfng KD and control Paneth cells. Representative traces (left) and MFI (right) showing ligand binding to NOTCH1 measured by flow cytometry. Unstained Paneth cells were used as a negative control. The experiment was performed in triplicate and presented as mean ± s.d. (D) Cell surface DLL1, DLL4, and JAG1 concentration on Rfng KD and control unpermeabilised Paneth cells. Left: Representative traces measured by flow cytometry. Right: MFI measurements. The experiment was performed in triplicate and presented as mean ± s.d. (E) Cell surface DLL1, DLL4, and JAG1 concentration on Rfng KD and control permeabilised Paneth cells. (**p<0.01).

Figure 2—figure supplement 1. Dll1 expression in the crypts.

Fringes are known to modulate Notch signalling when present in receptor expressing cell (Haines and Irvine, 2003). But here we find Rfng in the ligand presenting cell promoting Notch activity in the neighbouring CBCs. We confirmed that the Paneth cells express the ligand Dll1 by RNA-ISH (Figure 2—figure supplement 1). To understand the mechanism behind this, we examined ligand availability and concentration on the cell surface according to a previously established method using flow cytometry (LeBon et al., 2014; Taylor et al., 2014; Yang et al., 2005). Seven days old Rfng KD and control organoids were dissociated and single unpermeabilised cells were labelled with CD24 to mark Paneth cells and NOTCH1-Fc to quantify ligand binding to NOTCH1 (Figure 2C). Mean fluorescent intensity (MFI) of NOTCH1 binding to Paneth cells with Rfng knockdown was reduced compared to the scrambled control. We further confirmed that the ligands available on the Paneth cell surface have reduced by using specific antibodies for DLL1, DLL4 and JAG1. Flow cytometry showed that DLL1 and DLL4 levels on the Paneth cell surface reduced after the loss of Rfng (Figure 2D), although the total expression level of DLL1 and DLL4 within Paneth cells is not changed by Rfng knockdown after the cells were permeabilised (Figure 2E). Western blotting also confirmed that the total DLL1 and DLL4 expression in Paneth cells does not change significantly after the loss of Rfng (Figure 2A). The outcomes of the ligand availability assays suggest that the DLLs available on the Paneth cell surface for NOTCH1 to bind to have been reduced after the loss of RFNG, which could decrease Notch activity in the adjacent CBCs.
Mfng plays an insignificant role
Mfng is expressed by scattered cells in the intestinal epithelium (Schröder and Gossler, 2002). To understand its potential function in maintaining the epithelium, we established an in vitro shRNA based Mfng knockdown model as before. Western blotting and RT-qPCR analysis validated Mfng knockdown (Figure 3A,B). Gene expression levels of Lgr5 and Notch components were comparable between Sc. Control and Mfng KD organoids (Figure 3B). Additionally, the colony forming efficiency (Figure 3C) and the expression pattern of Lgr5-GFP (CBC) and MUC2 (goblet cells) (Figure 3D) of Mfng shRNA-expressing CBCs were similar to the scrambled control. We quantified this observation using flow cytometry, which confirmed no significant change in the number of Lgr5-GFP+ CBCs and goblet cells (Figure 3E,F). Finally, the percentage of differentiated cells, identified by CK20 expression, was not significantly altered between Sc. control and Mfng KD organoids (Figure 3G).
Figure 3. Mfng plays an insignificant role.
Single Lgr5-GFP CBCs were transduced with either Sc. shRNA or Mfng shRNA. The experiment was performed in triplicate. (A) Western blot for Mfng expression. (B) RT-qPCR quantification of Mfng and Notch components in organoids. (C) Colony forming efficiency measured after 7 days. Quantitative analysis from 1000 cells/replicate. (D) Representative bright field and co-IF images indicating Lgr5-GFP (green) expression. MUC2 (red) marks Goblet cells. DAPI (blue) labels nuclei and scale bar represents 25 μm. (E) Representative flow cytometry plots indicating gated percentage of Lgr5+ CBCs (GFPhigh) and goblet cells (UEA-1+/CD24-). (F) Percentage of Lgr5+ CBCs and goblet cells as determined by flow cytometry and presented as mean ± s.d. (G) Left: Representative flow cytometry histograms indicating KRT20+ (CK20+) cells. Right: Percentage of KRT20+ cells and presented as mean ± s.d.

Figure 3—figure supplement 1. Histological analysis of Mfng null intestines.

Figure 3—figure supplement 2. No significant phenotype detected upon loss of Mfng.

We then analysed intestinal tissues from Mfng deficient (Mfng−/−) mice (Moran et al., 2009) (Figure 3—figure supplement 1A–C). IF microscopy showed similar MUC2 staining in intestinal sections of Mfng−/− and wild-type (Mfng+/+) mice (Figure 3—figure supplement 1D). Quantification in intestinal tissues based on IF expression indicated that the number of goblet cells was not significantly altered in Mfng+/+ mice compared to Mfng−/− mice. Finally, we examined the total number of CK20+ cells in intestines, which was similar in wild-type and Mfng null mice (Figure 3—figure supplement 2A).
We observed that goblet cells were slightly enriched in Mfng when compared to the CBCs (Figure 3—figure supplement 2B). We found no significant change in the cell surface expression of DLLs on goblet cells after the loss of Mfng (Figure 3—figure supplement 2C–F). Overall, these data suggest Mfng plays an insignificant role in intestinal tissues.
Lfng deletion leads to increased goblet cell differentiation
Lunatic Fringe is known to be expressed in the crypts and scattered cells in the villous epithelium (Schröder and Gossler, 2002). Immunofluorescence analysis of intestines from Lfng-GFP reporter mice confirmed that Lfng is expressed by a subset of cells in the upper crypt (transient-amplifying cell region) and villus (Figure 4A). We observe that Lfng-GFP+ cells are post-mitotic in the upper-crypt. (Figure 4A). Further analysis showed that these Lfng-GFP+ cells express ChgA, Dclk1 or Muc2 which are markers for enteroendocrine, Tuft or goblet cells respectively (Figure 4B–D). Secretory cells in the intestine, mainly enteroendocrine and goblet cells, are known to express Notch ligands, especially DLL1 (van Es et al., 2012). In the upper crypt, immunofluorescence analysis showed Notch1 activity in the cells adjacent to Lfng-GFP+ cells but not in themselves (Figure 4E). We performed RT-qPCR measurement of Lfng using goblet cells and CBCs isolated from Lgr5-GFP mice and confirmed that Lfng is in goblet cells and not CBCs (Figure 4—figure supplement 1A).
Figure 4. Lfng loss results in increased goblet cell differentiation in vitro.
(A–E) Representative IF images of the small intestine of Lfng-GFP reporter mice. (A) GFP (green) shows the Lfng expression and EdU (red) marks the proliferating cells. DAPI (blue) labels nuclei. Scale bar represents 50 μm. (B) GFP (green) shows the Lfng expression and DCAMKL1 (red) marks the Tuft cells. Scale bar represents 20 μm. (C) GFP (green) shows the Lfng expression and CHGA (red) marks the enteroendocrine cells. Scale bar represents 20 μm. (D) GFP (green) shows the Lfng expression and MUC2 (red) marks the goblet cells. Scale bar represents 20 μm. (E) GFP (red) shows the Lfng expression and NICD (green) identifies the cells with NOTCH1 activity. Scale bar represents 20 μm. (F) Representative bright field and co-IF images of Lfng KD and control organoids indicating Lgr5-GFP (green) expression. MUC2 (red) marks goblet cells. DAPI (blue) labels nuclei and scale bar represents 25 μm. (G) Representative plots indicating gated percentage of Lgr5+ (GFPhigh) and goblet cells (UEA-1+/CD24-) of Lfng KD and control organoids. (H) Ratio of goblet cells to Lgr5-GFP + CBCs as determined by flow cytometry. The experiment was performed in triplicate and presented mean ± s.d. (***p<0.001).

Figure 4—figure supplement 1. Characterisation of Lfng KD organoids.

We established an in vitro shRNA based Lfng knockdown model as before (Figure 4—figure supplement 1B). We observed only a slight decrease in colony forming efficiency of CBCs after Lfng knockdown and no significant change in the level of Notch activity in the CBCs (Figure 4—figure supplement 1C,D). However, we find that the number of goblet cells (MUC2+) increased after the loss of Lfng (Figure 4C). Quantification by flow cytometry showed that number of goblet cells (UEA-1+/CD24-) (Wong et al., 2012) was increased significantly in Lfng KD organoids (5.5% of the total population) when compared to the scrambled control (1.9%) (Figure 4D). Accordingly, the ratio of the number of goblet cells to Lgr5+ CBCs increased approximately three times in Lfng shRNA-expressing organoids (Figure 4E).
We confirmed these observations in vivo by examining the intestinal tissues from Lfng deficient (Lfng−/−) mice (Moran et al., 2009). We observed an increase in the number of goblet cells in the Lfng null mice as expected (Figure 5A and Figure 5—figure supplement 1A,B). Goblet cells were quantified in villus crypt units (VCU) of the small intestine (Ishikawa et al., 1997). Immunofluorescence analysis based on MUC2 expression in small intestinal tissues from Lfng−/− mice showed an increase in the number of goblet cells when compared to the control (Lfng+/+) mice (Figure 5B). Finally, using flow cytometry we quantified goblet cell numbers in Lfng−/− mice: 14.1% of small intestinal cells, which is significantly higher than the 7.9% goblet cells in the small intestine of wild-type litter-mate control mice (Figure 5C). We observed no change in the Paneth cell numbers after loss of Lfng (Figure 5—figure supplement 1C).
Figure 5. Lfng loss results in increased goblet cell differentiation in vivo.
(A) Representative H and E sections from the small intestine of Lfng+/+ and Lfng−/− mice. Scale bar represents 50 μm. (B) Left: Representative IF images of intestine of Lfng+/+ and Lfng−/− mice. MUC2 (red) marks goblet cells. DAPI (blue) labels nuclei. Right: Quantification of the number of goblet cells of n = 4 mice/condition and n = 500 VCU per mouse presented as mean ± s.d. (C) Left: Representative plots indicating gated percentage of goblet cells (UEA-1+/CD24-) from intestinal tissue derived from Lfng+/+ or Lfng−/− mice. Right: Percentage of goblet cells presented as mean ± s.d. The data represent n = 3 mice/condition. (D) Left: Representative plots indicating gated population of intestinal progenitors from the intestine of Lfng+/+ and Lfng−/− mice. Percentage reflects fraction of total population. Right: RT-qPCR measurements in progenitor cells from Lfng+/+ and Lfng−/− mice. The experiment was performed in triplicate presented as mean ± s.d. (**p<0.01).

Figure 5—figure supplement 1. Histological and flow cytometric analysis of Lfng null intestines.

Figure 5—figure supplement 2. Lfng loss results in reduced Notch activity.

Lfng deletion reduces Notch signalling
Suppression of Notch signalling is known to increase the goblet cell numbers (van Es et al., 2005). We isolated and analysed intestinal progenitor cells (CD24loCD44+CD166+GRP78+) from Lfng+/+ and Lfng−/− mice using an established protocol (Wang et al., 2013) (Figure 5D). RT-qPCR measurements indicated decreased Hes1 and increased Atoh1 (transcriptional factor essential for generating secretory lineage (Shroyer et al., 2007)) expression in Lfng−/− progenitors compared to the control. We also confirmed reduced activated Notch1 (NICD) in the upper crypts of Lfng null mice intestines (Figure 5—figure supplement 2A,B). Therefore, Lfng silencing appears to lower Notch activity in the progenitors and promotes the secretory lineage leading to an increase in goblet cell numbers (Zheng et al., 2011; Kim and Shivdasani, 2011).
Secreted LFNG plays no apparent function
Previous reports have indicated that Lfng may be secreted into the extracellular space (Shifley and Cole, 2008; Williams et al., 2016 ). We first examined the medium from intestinal organoid cultures derived from Lgr5-GFP mice using solid-phase ELISA. Secreted Lfng was detected at a concentration of approximately 315–325 ng/mL using two independent LFNG primary antibodies (Figure 6A and Figure 6—figure supplement 1A). The other Fringes, RFNG and MFNG, were not detected in the culture medium (Figure 6—figure supplement 1B,C). We tried to understand if secreted LFNG influences Notch signalling by affecting receptors in a non-cell autonomous manner. As before, single Lgr5-GFP + CBCs were transduced with Lfng shRNA and propagated as organoids followed by incubation with conditioned medium harvested from wild-type organoids that contained soluble form of secreted LFNG (sLFNG). After 24 hr, organoid cultures were analysed using flow cytometry, which showed that the percentage of goblet cells remained similar to the Lfng knockdown (shRNA) condition and significantly higher than scrambled shRNA-expressing organoids which express endogenous LFNG (Figure 6B). RT-qPCR revealed that the expression levels of Notch ligands DLL1 and DLL4 were similar between Lfng knockdown with and without soluble LFNG (Figure 6—figure supplement 1D).
Figure 6. Secreted LFNG plays no apparent function.
(A) ELISA of the secretion of LFNG in culture medium from Lgr5-GFP organoids. Culture medium (T = 0 days) was used as a control. The experiment was performed in triplicate and presented as mean ± s.d. (B) Left: Representative plots indicating gated percentage of goblet cells (UEA-1+/CD24-) for organoids under Sc. shRNA control, Lfng KD and Lfng KD treated with sLFNG conditions. Right: Percentage of goblet cells in each condition. The experiment was performed in triplicate and presented as mean ± s.d. (C) Left: Representative IF images of intestine of Lfng+/+ and LfngRLfng/+ mice. MUC2 (red) marks goblet cells. DAPI (blue) labels nuclei. Right: Quantification of the number of goblet cells of n = 4 mice/condition and n = 500 VCU/mouse. Data presented as mean ± s.d. (**p<0.01).

Figure 6—figure supplement 1. Secretion of Fringe proteins.

We then examined intestinal tissues from mutant Lfng mice (LfngRLFNG/+ or RLfng) in which the N-terminal sequence of LFNG, which normally allows for protein processing and secretion, is replaced with the N-terminus of Radical fringe (a Golgi resident protein) (Williams et al., 2016) (Figure 6—figure supplement 1E). IF analysis based on MUC2 expression in small intestinal tissues from RLfng mice showed similar goblet cell numbers in villus crypt units compared to wild-type (Lfng+/+) mice (Figure 6C). Taken together, our in vitro and in vivo findings suggest that the effect of LFNG on goblet cell numbers and intestinal homeostasis is not dependent on its secreted form.
LFNG promotes DLL expression on the cell surface
In order to understand if LFNG, like RFNG, can affect the cell surface expression of DLL, we examined ligand availability and concentration on the cell surface. Seven days old Lfng KD and control organoids were dissociated and single unpermeabilised cells were labelled with CD24 and UEA-1 to mark goblet cells and NOTCH1-Fc to quantify ligand binding to NOTCH1 (Figure 7A). Mean fluorescent intensity of NOTCH1 binding to goblet cells with Lfng knockdown was reduced compared to the control, suggesting that the ligands available on the goblet cell surface for NOTCH1 to bind to were reduced after the loss of Lfng. Flow cytometry shows that DLL1 and DLL4 levels, detected using specific antibodies, on the goblet cell surface reduced after the loss of Lfng (Figure 7B), although the total expression of DLL1 and DLL4 by the goblet cells measured after the permeabilising the cells remained almost the same (Figure 7C). Western blotting also confirmed that the total DLL1 and DLL4 expression in goblet cells does not change significantly after the loss of Lfng (Figure 4—figure supplement 1D).
Figure 7. LFNG promotes cell surface expression of DLL.

(A) Ligand availability on Lfng KD and Sc. Control goblet cells. Representative traces (left) and MFI (right) showing ligand binding to NOTCH1 measured by flow cytometry. Unstained goblet cells were used as a negative control. The experiment was performed in triplicate and presented as mean ± s.d. (D) Cell surface DLL1 and DLL4 concentration on Lfng KD and Sc. Control unpermeabilised goblet cells. Left: Representative traces measured by flow cytometry. Right: MFI measurements. The experiment was performed in triplicate and presented as mean ± s.d. (E) Cell surface DLL1 and DLL4 concentration on Lfng KD and Sc. Control permeabilised goblet cells. (**p<0.01).
Discussion
We report that Rfng is enriched in the Paneth cells and promotes cell surface expression of DLL1 and DLL4. This promotes Notch activity in the neighbouring Lgr5+ CBCs assisting their self-renewal. Mfng does not appear to contribute significantly in maintaining the epithelium. Lfng on the other hand is expressed by enteroendocrine, Tuft and goblet cells and suppresses the secretory lineage (Figure 8). Even though Fringe proteins do not appear to be essential, they provide another layer of spatial and lineage-specific modulation that might enhance robustness of intestinal homeostasis. This is consistent with the highly robust regulation of Notch activity in the intestinal epithelium as inhibition of Notch1 or Dll1 only causes minor defective phenotype, while inhibition of Notch2, Dll4, Jag1, Hes1, Hes3 or Hes5 causes no significant phenotype (Pellegrinet et al., 2011; Wu et al., 2010; Ueo et al., 2012).
Figure 8. Summary.
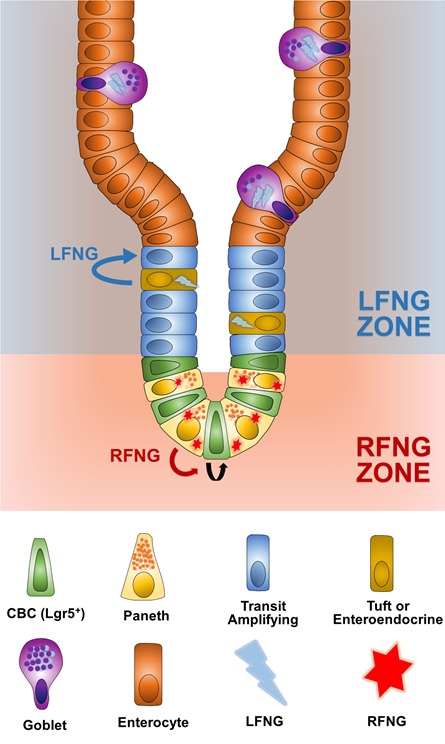
Rfng is enriched in the Paneth cells and promotes cell surface expression of DLL1 and DLL4. This promotes Notch activity in the neighbouring Lgr5+ CBCs assisting their self-renewal. Mfng does not appear to contribute significantly in maintaining the epithelium. Lfng on the other hand is expressed by enteroendocrine, Tuft, and goblet cells and suppresses the secretory lineage.
We have observed that both RFNG and LFNG can increase the presence of DLL1 and DLL4 on the plasma membrane. This can potentially contribute to the increase in cis-inhibition of NOTCH1 by DLL1 in the presence of fringe (LeBon et al., 2014). Fringe modulation of ligands will be of significance in understanding Notch activity in cancer stem cell asymmetric division where LFNG, DLL1 and NOTCH1 are present in the same cell (Bu et al., 2013; Bu et al., 2016). However, the mechanism behind the increase in cell-surface expression of the ligands still needs to be understood. The glycosylation state of proteins has been known to affect their intracellular trafficking (Huet et al., 2003; Ohtsubo and Marth, 2006). It raises the possibility that fringe mediated glycosylation or the addition of Galactose and Sialic acid post fringe activity might affect the trafficking of DLLs to the cell surface. Lfng in the Dll1 expressing cell, in the presence of Dll3, is known to reduce Notch activity in the neighbouring cell (Okubo et al., 2012). This raises the possibility that ligands interact with each other in the presence of Lfng which might explain our observation. In vitro reductionist studies may need to be conducted in systems expressing single ligand and fringe to understand the mechanism in detail. Also, our experiments cannot completely rule out the possibility that low levels of Rfng expression in CBCs (in comparison to Paneth cells) can also contribute to the phenotype by directly modulating Notch receptors. We have observed some mesenchymal cells also express Rfng detectable by RNA ISH. We also observe that some of the mesenchymal cells also express Dll1 (Figure 2—figure supplement 1). Further studies are necessary to map the expression of all the Notch ligands in different mesenchymal cell types. This raises the possibility that the mesenchyme can also provide Notch ligands to the Lgr5 + CBCs in vivo. In case that is true, our proposed mechanism that Rfng promotes cell surface expression of Dll1 might be applicable to the mesenchymal cells too. Upon loss Rfng, reduced Dll1 expression on the cell surface of Paneth cells and mesenchymal cells would result in reduced Notch activity in the CBCs, as observed. However, the crypt cells are separated from the mesenchyme by the basement membrane. The efficacy of DLL mediated Notch signalling across the intestinal basement membrane needs to be explored.
Although we have observed that the Lfng expressing cells are found both in the upper crypt and in the villus, our data suggests that LFNG in NICD- post-mitotic secretory cells of the upper crypt promotes Notch activity in the neighbouring enterocyte progenitors. As Notch signalling is not active in the villus, the Lfng+ cells of the villi likely do not impact epithelial cell differentiation. It would be interesting to explore the reason secretory cells expressing Notch ligands and Lfng are found in the villi. The differences, other than functional consequence, between the Lfng+ cells of the upper crypt and villus needs to be explored.
Notch pathway is a potential therapeutic target, but blocking the pathway leads to serious GI related side effects (van Es et al., 2005). Targeting the Notch pathway through fringe appears to be a potentially viable strategy to exclusively modulate intestinal epithelial regeneration or its functions, absorption and mucus secretion, as Notch activity in the stem cells or progenitors can be specifically targeted by blocking Rfng or Lfng respectively.
Materials and methods
Mice
Lgr5-GFP (Jackson Lab #8875, RRID:IMSR_JAX:008875) strain has been described previously (Sato et al., 2009). Lfng null (Lfngtm1Rjo), Mfng null (Mfngtm1Seco, RRID:MGI:3849430) and Rfng null (Rfngtm1Tfv) mice were maintained as described here (Moran et al., 2009; Ryan et al., 2008). LfngRLFNG/+ mice were maintained as previously described (Williams et al., 2016). Littermates of Fringe mutants with wild-type gene expression were used as controls. Lfng-GFP (GENSAT # RRID:MMRRC_015881-UCD) were received as FVB/N - C57BL/6 hybrids and crossed to C57BL/6 mice for at least 10 generations (Gong et al., 2003; Semerci et al., 2017). All procedures were conducted under protocols approved by the appropriate Institutional Animal Care and Use Committees at Ohio State University (# 2012A00000036-R1), Duke University (# A286-15-11), Baylor College of Medicine (# AN-5004), Cornell University (# 2010–0100) or Research Animal Resource Center of Weill Cornell Medical College (# 2009–0029).
Organoid culture and flow cytometry
Organoids from Lgr5-GFP mouse intestines were cultured as previously described with minor modifications (Sato et al., 2011; Sato et al., 2009). Briefly, small intestines were harvested, washed with PBS and opened up longitudinally to expose luminal surface. A glass coverslip was then gently applied to scrape off villi and the tissue was cut into 2–3 mm fragments and incubated with 2 mM EDTA for 45 min on a rocking platform at 4°C. EDTA solution was then decanted and replaced with cold PBS. The tissues were vigorously agitated to release the crypts. Next, single cell dissociation was achieved by incubating purified crypts at 37°C with Trypsin-EDTA solution containing 0.8KU/ml DNase, 10 μM Y-27632 for 30 min. To isolate Lgr5-GFP+ cells, single cells were resuspended in cold PBS with 0.5% BSA and GFPhigh cells were sorted by FACS (Beckman Coulter/BD FACSAria).
Dissociated cells were also stained with anti-CD24 antibody and UEA-1. Paneth cells were sorted based on side scatter and CD24 expression (CD24high/SSChigh) and goblet cells were identified as UEA-1+/CD24- (Sato et al., 2011; Wong et al., 2012). Viable cells were gated based on 7-AAD or Sytox blue staining. Data analysis was performed using FlowJo software.
Single Lgr5-GFP+ CBCs were plated in Matrigel and cultured in medium containing: Advanced DMEM/F12 supplemented with Glutamax, 10 mM HEPES, N2, B27 without vitamin A, 1 μM N-acetylcysteine, 50 ng/mL EGF, 100 ng/mL Noggin, and 10% R-SPONDIN1 conditioned medium.
Lentiviral constructs containing Lfng shRNA (sc-39491-SH), Mfng shRNA (sc-39493-SH), Rfng shRNA (sc-39495-SH), or scrambled shRNA (sc-108060) were purchased from Santa Cruz Biotechnology. Lentiviral transduction of Lgr5-GFP CBCs were performed by ‘spinoculation’ method described previously (Koo et al., 2011). Transduced CBCs were cultured as organoids and analysed after 7 days. RBPJκ-dsRed reporter (Addgene #47683) was transfected into single Sc. shRNA-expressing or Rfng shRNA-expressing sorted Lgr5-GFP CBCs using Lipofectamine-2000 as described earlier (Schwank et al., 2013).
Organoid Reconstitution Assay was performed as described previously (Rodríguez-Colman et al., 2017). Briefly, FACS sorted Paneth cells and Lgr5-GFP+ CBCs were mixed, spun down and incubated at room temperature for 10 min. The pellet was then plated in Matrigel.
RT-qPCR and protein analysis
A Qiagen RNeasy kit was used to extract total RNA. RT-PCR primers from Genecopoeia were used for the following genes: β-Actin, Lgr5, Lfng, Mfng and Rfng. Taqman primers (ABI) were used for: Lgr5, Notch1, Hes1, Hes5, Dll1, Dll4, and Jag1. Gapdh or β-Actin was used as internal control. Protein isolation and western blotting were performed as previously described, using β-ACTIN for normalisation (Pan et al., 2008). ELISA kits for LNFG, RFNG, and MFNG were purchased from MyBioSource and assays were performed according to the manufacturer’s instructions similar to the following protocol. Solid-phase ELISA assays were independently conducted using LFNG, RFNG, and MFNG antibodies (referred to as antibody-2) purchased from Santa Cruz Biotechnology for verification of results obtained from the corresponding kits.
Ligand availability assay
Ligand availability assays were performed as previously described (LeBon et al., 2014). Briefly, blocking buffer (PBS, 2% FBS, 100 μg/mL CaCl2) and binding Buffer (PBS, 2% BSA, 100 μg/mL CaCl2) were prepared. Subsequently, cells were incubated in blocking buffer for 30 min at 37°C followed by incubation with 0.5 μg/mL NOTCH1-Fc (R and D #5267) diluted in binding buffer for 1 hr at 4°C. Cells were then washed three times in blocking buffer and incubated in secondary antibody diluted in binding buffer for 40 min at room temperature. Finally, cells were washed three times in blocking buffer and analysed by flow cytometry.
Immunofluorescence (IF) and immunohistochemistry (IHC)
Sections of paraffin embedded tissues were deparaffinised using Xylene and rehydrated. Antigen retrieval was performed using Proteinase K (Dako) or 10 mM Tris buffer at pH9. The sections were incubated in Protein Block (Dako) for 10 min at room temperature (RT). Primary antibodies diluted in Antibody Diluent (Dako) were added and incubated overnight at 4°C. Slides were then washed in PBS and incubated in secondary antibodies diluted in Antibody Diluent for 1 hr at RT and washed in PBS. The slides were then mounted using Vectashield mounting medium containing DAPI. Intestinal sections were stained with Haematoxylin and Eosin (H and E), Periodic Acid-Schiff (PAS), Alcian Blue (AB) or Nuclear Fast Red according to standard methods. Intestinal organoids embedded in Matrigel were fixed with 3% PFA for 15 min at room temperature and permeabilised using 0.2% Triton-X for IF according to the protocol described above. Antibodies used are listed in supplementary methods. Antibodies used are listed in Supplementary file 1.
Protocol was modified while staining for Notch1 intracellular domain (NICD). Antigen retrieval was performed using Trilogy (Cell Marque). Sections were then incubated in 3% hydrogen peroxide diluted in PBS for 10 min. Protein blocking, primary antibody and secondary antibody incubation were performed as described above. Signal was further amplified using TSA Plus Fluorescein kit (Perkin Elmer). To quantify, NICD+ nuclei and total number of nuclei (based on DAPI signal) were counted in each crypt (35 to 50 crypts from each section) to obtain the fraction of NICD+ nuclei.
0.5 mg EdU in 150 μl PBS (∼16.66 mg/kg) was injected intraperitoneally into Lfng-GFP mice two hours prior to euthanasia (Kabiri et al., 2014). Incorporated EdU was detected using Click-It EdU imaging kit (Thermo Fisher #C10640).
RNA in situ hybridisation (ISH)
RNA-ISH was performed using RNAscope 2.5HD duplex assay kit (ACDBio) (Wang et al., 2012) as per manufacturer’s instructions. Briefly, the assay was first validated by using a positive control probe for Polr2a and a negative control probe for a bacterial gene dapB. Probes, labelled with Alkaline Phosphatase, for Rfng or Dll1 were hybridised to the tissue sections. The signal was generated using Fast Red substrate. The slides were washed in water and then PBS and were stained for Lysozyme protein as described above in the Immunofluorescence section. Fast Red signal was detected by a fluorescence microscope as described in (Lauter et al., 2011).
Statistical analysis
The data is represented as mean ± S.E.M (standard error of mean) unless otherwise indicated. A Student t-test was applied to compare two groups using p<0.05 to establish statistical significance.
Acknowledgement
We are grateful to Dr Brigid Hogan of Duke University, Dr Linda Samuelson of University of Michigan and Dr Robert Haltiwanger of University of Georgia for their valuable comments. We thank Dr Steven Lipkin of Weill Cornell Medical College for providing R-SPONDIN1 conditioned medium. We thank Dr Kameswaran Surendran of Sanford Research for sharing the protocol for NICD staining.
Funding Statement
The funders had no role in study design, data collection and interpretation, or the decision to submit the work for publication.
Contributor Information
Xiling Shen, Email: xiling.shen@duke.edu.
Fiona M Watt, King's College London, United Kingdom.
Funding Information
This paper was supported by the following grants:
National Institutes of Health R35GM122465, R01GM114254 to Xiling Shen.
Defense Advanced Research Projects Agency HR0011-16-C-0138 to Xiling Shen.
National Science Foundation NSF 1350659 career award to Xiling Shen.
Additional information
Competing interests
No competing interests declared.
Author contributions
Conceptualization, Data curation, Formal analysis, Investigation, Visualization, Writing—original draft, Project administration, Writing—review and editing.
Data curation, Formal analysis, Investigation, Visualization, Writing—original draft, Writing—review and editing.
Resources, Maintained the mouse colonies and, harvested and processed intestinal samples.
Formal analysis, Investigation, Visualization.
Investigation, Performed experiments to generate supporting data not shown in the manuscript.
Investigation, Performed experiments to generate supporting data not shown in the manuscript.
Resources, Writing—review and editing.
Resources, Writing—review and editing.
Resources, Writing—review and editing.
Conceptualization, Resources, Writing—review and editing.
Conceptualization, Supervision, Funding acquisition, Writing—review and editing.
Ethics
Animal experimentation: All procedures were conducted under protocols approved by the appropriate Institutional Animal Care and Use Committees at Ohio State University (# 2012A00000036-R1), Duke University (# A286-15-11), Baylor College of Medicine (# AN-5004), Cornell University (# 2010-0100) or Research Animal Resource Center of Weill Cornell Medical College (# 2009-0029).
Additional files
List of antibodies used for Immunofluorescence and Western blotting.
Major datasets
The following previously published dataset was used:
Sato T, author; van Es JH, author; Snippert HJ, author; Stange DE, author; Vries RG, author; van den Born M, author; Barker N, author; Shroyer NF, author; van de Wetering M, author; Clevers H, author. Paneth cells constitute the niche for Lgr5 stem cells in intestinal crypts. 2011 https://www.ncbi.nlm.nih.gov/geo/query/acc.cgi?acc=GSE25109 Publicly available at the NCBI Gene Expression Omnibus (accession no: GSE25109)
References
- Barker N, van Es JH, Kuipers J, Kujala P, van den Born M, Cozijnsen M, Haegebarth A, Korving J, Begthel H, Peters PJ, Clevers H. Identification of stem cells in small intestine and colon by marker gene Lgr5. Nature. 2007;449:1003–1007. doi: 10.1038/nature06196. [DOI] [PubMed] [Google Scholar]
- Bray SJ. Notch signalling: a simple pathway becomes complex. Nature Reviews Molecular Cell Biology. 2006;7:678–689. doi: 10.1038/nrm2009. [DOI] [PubMed] [Google Scholar]
- Bu P, Chen KY, Chen JH, Wang L, Walters J, Shin YJ, Goerger JP, Sun J, Witherspoon M, Rakhilin N, Li J, Yang H, Milsom J, Lee S, Zipfel W, Jin MM, Gümüş ZH, Lipkin SM, Shen X. A microRNA miR-34a-regulated bimodal switch targets Notch in colon cancer stem cells. Cell Stem Cell. 2013;12:602–615. doi: 10.1016/j.stem.2013.03.002. [DOI] [PMC free article] [PubMed] [Google Scholar]
- Bu P, Wang L, Chen KY, Srinivasan T, Murthy PK, Tung KL, Varanko AK, Chen HJ, Ai Y, King S, Lipkin SM, Shen X. A miR-34a-Numb feedforward loop triggered by inflammation regulates asymmetric stem cell division in intestine and colon cancer. Cell Stem Cell. 2016;18:189–202. doi: 10.1016/j.stem.2016.01.006. [DOI] [PMC free article] [PubMed] [Google Scholar]
- Fre S, Huyghe M, Mourikis P, Robine S, Louvard D, Artavanis-Tsakonas S. Notch signals control the fate of immature progenitor cells in the intestine. Nature. 2005;435:964–968. doi: 10.1038/nature03589. [DOI] [PubMed] [Google Scholar]
- Gong S, Zheng C, Doughty ML, Losos K, Didkovsky N, Schambra UB, Nowak NJ, Joyner A, Leblanc G, Hatten ME, Heintz N. A gene expression atlas of the central nervous system based on bacterial artificial chromosomes. Nature. 2003;425:917–925. doi: 10.1038/nature02033. [DOI] [PubMed] [Google Scholar]
- Haines N, Irvine KD. Glycosylation regulates Notch signalling. Nature Reviews Molecular Cell Biology. 2003;4:786–797. doi: 10.1038/nrm1228. [DOI] [PubMed] [Google Scholar]
- Hansson EM, Teixeira AI, Gustafsson MV, Dohda T, Chapman G, Meletis K, Muhr J, Lendahl U. Recording Notch signaling in real time. Developmental Neuroscience. 2006;28:118–127. doi: 10.1159/000090758. [DOI] [PubMed] [Google Scholar]
- Hicks C, Johnston SH, diSibio G, Collazo A, Vogt TF, Weinmaster G. Fringe differentially modulates Jagged1 and Delta1 signalling through Notch1 and Notch2. Nature Cell Biology. 2000;2:515–520. doi: 10.1038/35019553. [DOI] [PubMed] [Google Scholar]
- Huet G, Gouyer V, Delacour D, Richet C, Zanetta JP, Delannoy P, Degand P. Involvement of glycosylation in the intracellular trafficking of glycoproteins in polarized epithelial cells. Biochimie. 2003;85:323–330. doi: 10.1016/S0300-9084(03)00056-7. [DOI] [PubMed] [Google Scholar]
- Ishikawa N, Wakelin D, Mahida YR. Role of T helper 2 cells in intestinal goblet cell hyperplasia in mice infected with Trichinella spiralis. Gastroenterology. 1997;113:542–549. doi: 10.1053/gast.1997.v113.pm9247474. [DOI] [PubMed] [Google Scholar]
- Iso T, Kedes L, Hamamori Y, Hes HY. HES and HERP families: multiple effectors of the Notch signaling pathway. Journal of Cellular Physiology. 2003;194:237–255. doi: 10.1002/jcp.10208. [DOI] [PubMed] [Google Scholar]
- Kabiri Z, Greicius G, Madan B, Biechele S, Zhong Z, Zaribafzadeh H, Edison, Aliyev J, Wu Y, Bunte R, Williams BO, Rossant J, Virshup DM. Stroma provides an intestinal stem cell niche in the absence of epithelial Wnts. Development. 2014;141:2206–2215. doi: 10.1242/dev.104976. [DOI] [PubMed] [Google Scholar]
- Kim TH, Shivdasani RA. Genetic evidence that intestinal Notch functions vary regionally and operate through a common mechanism of Math1 repression. Journal of Biological Chemistry. 2011;286:11427–11433. doi: 10.1074/jbc.M110.188797. [DOI] [PMC free article] [PubMed] [Google Scholar]
- Koo BK, Stange DE, Sato T, Karthaus W, Farin HF, Huch M, van Es JH, Clevers H. Controlled gene expression in primary Lgr5 organoid cultures. Nature Methods. 2011;9:81–83. doi: 10.1038/nmeth.1802. [DOI] [PubMed] [Google Scholar]
- Kopan R. Notch: a membrane-bound transcription factor. Journal of Cell Science. 2002;115:1095–1097. doi: 10.1242/jcs.115.6.1095. [DOI] [PubMed] [Google Scholar]
- Lauter G, Söll I, Hauptmann G. Two-color fluorescent in situ hybridization in the embryonic zebrafish brain using differential detection systems. BMC Developmental Biology. 2011;11:43. doi: 10.1186/1471-213X-11-43. [DOI] [PMC free article] [PubMed] [Google Scholar]
- LeBon L, Lee TV, Sprinzak D, Jafar-Nejad H, Elowitz MB. Fringe proteins modulate Notch-ligand cis and trans interactions to specify signaling states. eLife. 2014;3:e02950. doi: 10.7554/eLife.02950. [DOI] [PMC free article] [PubMed] [Google Scholar]
- Moloney DJ, Panin VM, Johnston SH, Chen J, Shao L, Wilson R, Wang Y, Stanley P, Irvine KD, Haltiwanger RS, Vogt TF. Fringe is a glycosyltransferase that modifies Notch. Nature. 2000;406:369–375. doi: 10.1038/35019000. [DOI] [PubMed] [Google Scholar]
- Moran JL, Shifley ET, Levorse JM, Mani S, Ostmann K, Perez-Balaguer A, Walker DM, Vogt TF, Cole SE. Manic fringe is not required for embryonic development, and fringe family members do not exhibit redundant functions in the axial skeleton, limb, or hindbrain. Developmental Dynamics. 2009;238:1803–1812. doi: 10.1002/dvdy.21982. [DOI] [PMC free article] [PubMed] [Google Scholar]
- Ohtsubo K, Marth JD. Glycosylation in cellular mechanisms of health and disease. Cell. 2006;126:855–867. doi: 10.1016/j.cell.2006.08.019. [DOI] [PubMed] [Google Scholar]
- Okubo Y, Sugawara T, Abe-Koduka N, Kanno J, Kimura A, Saga Y. Lfng regulates the synchronized oscillation of the mouse segmentation clock via trans-repression of Notch signalling. Nature Communications. 2012;3:1141. doi: 10.1038/ncomms2133. [DOI] [PubMed] [Google Scholar]
- Pan Z, Sikandar S, Witherspoon M, Dizon D, Nguyen T, Benirschke K, Wiley C, Vrana P, Lipkin SM. Impaired placental trophoblast lineage differentiation in Alkbh1(-/-) mice. Developmental Dynamics. 2008;237:316–327. doi: 10.1002/dvdy.21418. [DOI] [PubMed] [Google Scholar]
- Panin VM, Papayannopoulos V, Wilson R, Irvine KD. Fringe modulates Notch-ligand interactions. Nature. 1997;387:908–912. doi: 10.1038/43191. [DOI] [PubMed] [Google Scholar]
- Pellegrinet L, Rodilla V, Liu Z, Chen S, Koch U, Espinosa L, Kaestner KH, Kopan R, Lewis J, Radtke F. Dll1- and dll4-mediated notch signaling are required for homeostasis of intestinal stem cells. Gastroenterology. 2011;140:1230–1240. doi: 10.1053/j.gastro.2011.01.005. [DOI] [PMC free article] [PubMed] [Google Scholar]
- Rampal R, Luther KB, Haltiwanger RS. Notch signaling in normal and disease States: possible therapies related to glycosylation. Current Molecular Medicine. 2007;7:427–445. doi: 10.2174/156652407780831593. [DOI] [PubMed] [Google Scholar]
- Riccio O, van Gijn ME, Bezdek AC, Pellegrinet L, van Es JH, Zimber-Strobl U, Strobl LJ, Honjo T, Clevers H, Radtke F. Loss of intestinal crypt progenitor cells owing to inactivation of both Notch1 and Notch2 is accompanied by derepression of CDK inhibitors p27Kip1 and p57Kip2. EMBO reports. 2008;9:377–383. doi: 10.1038/embor.2008.7. [DOI] [PMC free article] [PubMed] [Google Scholar]
- Rodríguez-Colman MJ, Schewe M, Meerlo M, Stigter E, Gerrits J, Pras-Raves M, Sacchetti A, Hornsveld M, Oost KC, Snippert HJ, Verhoeven-Duif N, Fodde R, Burgering BM. Interplay between metabolic identities in the intestinal crypt supports stem cell function. Nature. 2017;543:424–427. doi: 10.1038/nature21673. [DOI] [PubMed] [Google Scholar]
- Ryan MJ, Bales C, Nelson A, Gonzalez DM, Underkoffler L, Segalov M, Wilson-Rawls J, Cole SE, Moran JL, Russo P, Spinner NB, Kusumi K, Loomes KM. Bile duct proliferation in Jag1/fringe heterozygous mice identifies candidate modifiers of the Alagille syndrome hepatic phenotype. Hepatology. 2008;48:1989–1997. doi: 10.1002/hep.22538. [DOI] [PubMed] [Google Scholar]
- Sato T, van Es JH, Snippert HJ, Stange DE, Vries RG, van den Born M, Barker N, Shroyer NF, van de Wetering M, Clevers H. Paneth cells constitute the niche for Lgr5 stem cells in intestinal crypts. Nature. 2011;469:415–418. doi: 10.1038/nature09637. [DOI] [PMC free article] [PubMed] [Google Scholar]
- Sato T, Vries RG, Snippert HJ, van de Wetering M, Barker N, Stange DE, van Es JH, Abo A, Kujala P, Peters PJ, Clevers H. Single Lgr5 stem cells build crypt-villus structures in vitro without a mesenchymal niche. Nature. 2009;459:262–265. doi: 10.1038/nature07935. [DOI] [PubMed] [Google Scholar]
- Schröder N, Gossler A. Expression of Notch pathway components in fetal and adult mouse small intestine. Gene Expression Patterns. 2002;2:247–250. doi: 10.1016/S1567-133X(02)00060-1. [DOI] [PubMed] [Google Scholar]
- Schwank G, Andersson-Rolf A, Koo BK, Sasaki N, Clevers H. Generation of BAC transgenic epithelial organoids. PLoS One. 2013;8:e76871. doi: 10.1371/journal.pone.0076871. [DOI] [PMC free article] [PubMed] [Google Scholar]
- Semerci F, Choi WT, Bajic A, Thakkar A, Encinas JM, Depreux F, Segil N, Groves AK, Maletic-Savatic M. Lunatic fringe-mediated Notch signaling regulates adult hippocampal neural stem cell maintenance. eLife. 2017;6:e24660. doi: 10.7554/eLife.24660. [DOI] [PMC free article] [PubMed] [Google Scholar]
- Shifley ET, Cole SE. Lunatic fringe protein processing by proprotein convertases may contribute to the short protein half-life in the segmentation clock. Biochimica Et Biophysica Acta (BBA) - Molecular Cell Research. 2008;1783:2384–2390. doi: 10.1016/j.bbamcr.2008.07.009. [DOI] [PubMed] [Google Scholar]
- Shroyer NF, Helmrath MA, Wang VY, Antalffy B, Henning SJ, Zoghbi HY. Intestine-specific ablation of mouse atonal homolog 1 (Math1) reveals a role in cellular homeostasis. Gastroenterology. 2007;132:2478–2488. doi: 10.1053/j.gastro.2007.03.047. [DOI] [PubMed] [Google Scholar]
- Taylor P, Takeuchi H, Sheppard D, Chillakuri C, Lea SM, Haltiwanger RS, Handford PA. Fringe-mediated extension of O-linked fucose in the ligand-binding region of Notch1 increases binding to mammalian Notch ligands. PNAS. 2014;111:7290–7295. doi: 10.1073/pnas.1319683111. [DOI] [PMC free article] [PubMed] [Google Scholar]
- Ueo T, Imayoshi I, Kobayashi T, Ohtsuka T, Seno H, Nakase H, Chiba T, Kageyama R. The role of Hes genes in intestinal development, homeostasis and tumor formation. Development. 2012;139:1071–1082. doi: 10.1242/dev.069070. [DOI] [PubMed] [Google Scholar]
- van der Flier LG, Clevers H, Cells S. Stem cells, self-renewal, and differentiation in the intestinal epithelium. Annual Review of Physiology. 2009;71:241–260. doi: 10.1146/annurev.physiol.010908.163145. [DOI] [PubMed] [Google Scholar]
- van Es JH, Sato T, van de Wetering M, Lyubimova A, Yee Nee AN, Gregorieff A, Sasaki N, Zeinstra L, van den Born M, Korving J, Martens ACM, Barker N, van Oudenaarden A, Clevers H. Dll1+ secretory progenitor cells revert to stem cells upon crypt damage. Nature Cell Biology. 2012;14:1099–1104. doi: 10.1038/ncb2581. [DOI] [PMC free article] [PubMed] [Google Scholar]
- van Es JH, van Gijn ME, Riccio O, van den Born M, Vooijs M, Begthel H, Cozijnsen M, Robine S, Winton DJ, Radtke F, Clevers H. Notch/gamma-secretase inhibition turns proliferative cells in intestinal crypts and adenomas into goblet cells. Nature. 2005;435:959–963. doi: 10.1038/nature03659. [DOI] [PubMed] [Google Scholar]
- VanDussen KL, Carulli AJ, Keeley TM, Patel SR, Puthoff BJ, Magness ST, Tran IT, Maillard I, Siebel C, Kolterud Å, Grosse AS, Gumucio DL, Ernst SA, Tsai YH, Dempsey PJ, Samuelson LC. Notch signaling modulates proliferation and differentiation of intestinal crypt base columnar stem cells. Development. 2012;139:488–497. doi: 10.1242/dev.070763. [DOI] [PMC free article] [PubMed] [Google Scholar]
- Wang F, Flanagan J, Su N, Wang LC, Bui S, Nielson A, Wu X, Vo HT, Ma XJ, Luo Y. RNAscope: a novel in situ RNA analysis platform for formalin-fixed, paraffin-embedded tissues. The Journal of Molecular Diagnostics : JMD. 2012;14:22–29. doi: 10.1016/j.jmoldx.2011.08.002. [DOI] [PMC free article] [PubMed] [Google Scholar]
- Wang F, Scoville D, He XC, Mahe MM, Box A, Perry JM, Smith NR, Lei NY, Davies PS, Fuller MK, Haug JS, McClain M, Gracz AD, Ding S, Stelzner M, Dunn JC, Magness ST, Wong MH, Martin MG, Helmrath M, Li L. Isolation and characterization of intestinal stem cells based on surface marker combinations and colony-formation assay. Gastroenterology. 2013;145:383–395. doi: 10.1053/j.gastro.2013.04.050. [DOI] [PMC free article] [PubMed] [Google Scholar]
- Wang Y, Shao L, Shi S, Harris RJ, Spellman MW, Stanley P, Haltiwanger RS. Modification of epidermal growth factor-like repeats with O-fucose. Molecular cloning and expression of a novel GDP-fucose protein O-fucosyltransferase. The Journal of Biological Chemistry. 2001;276:40338–40345. doi: 10.1074/jbc.M107849200. [DOI] [PubMed] [Google Scholar]
- Williams DR, Shifley ET, Braunreiter KM, Cole SE. Disruption of somitogenesis by a novel dominant allele of Lfng suggests important roles for protein processing and secretion. Development. 2016;143:822–830. doi: 10.1242/dev.128538. [DOI] [PubMed] [Google Scholar]
- Wong VW, Stange DE, Page ME, Buczacki S, Wabik A, Itami S, van de Wetering M, Poulsom R, Wright NA, Trotter MW, Watt FM, Winton DJ, Clevers H, Jensen KB. Lrig1 controls intestinal stem-cell homeostasis by negative regulation of ErbB signalling. Nature Cell Biology. 2012;14:401–408. doi: 10.1038/ncb2464. [DOI] [PMC free article] [PubMed] [Google Scholar]
- Wu Y, Cain-Hom C, Choy L, Hagenbeek TJ, de Leon GP, Chen Y, Finkle D, Venook R, Wu X, Ridgway J, Schahin-Reed D, Dow GJ, Shelton A, Stawicki S, Watts RJ, Zhang J, Choy R, Howard P, Kadyk L, Yan M, Zha J, Callahan CA, Hymowitz SG, Siebel CW. Therapeutic antibody targeting of individual Notch receptors. Nature. 2010;464:1052–1057. doi: 10.1038/nature08878. [DOI] [PubMed] [Google Scholar]
- Yang LT, Nichols JT, Yao C, Manilay JO, Robey EA, Weinmaster G. Fringe glycosyltransferases differentially modulate Notch1 proteolysis induced by Delta1 and Jagged1. Molecular Biology of the Cell. 2005;16:927–942. doi: 10.1091/mbc.E04-07-0614. [DOI] [PMC free article] [PubMed] [Google Scholar]
- Zheng X, Tsuchiya K, Okamoto R, Iwasaki M, Kano Y, Sakamoto N, Nakamura T, Watanabe M. Suppression of hath1 gene expression directly regulated by hes1 via notch signaling is associated with goblet cell depletion in ulcerative colitis. Inflammatory Bowel Diseases. 2011;17:2251–2260. doi: 10.1002/ibd.21611. [DOI] [PubMed] [Google Scholar]